Reduction of Nauplii Size in an Allochthonous Artemia Strain through Selective Breeding
*Corresponding Author(s):
Vikas PASubject Matter Specialist-Fisheries Krishi Vigyan Kendra (Ernakulam) Of Central Marine Fisheries Research Institute, (Indian Council Of Agricultural Research) Narakkal, Kochi, Kerala, India
Tel:+91 4842394867/+91 9447993980,
Email:vikaspattath@gmail.com
Abstract
The present study was aimed to develop an Artemia strain producing small nauplii through selective breeding. Fifteen generations of mass selection was carried out for the reduction of nauplii size in the indigenous Artemia, which was identified to be Artemia franciscana naturalized in the Indian salinas. Mean values of life history traits, heritability of nauplii size, selection differentials, standardized selection differential, and predicted and realized selection responses were estimated from the full sib data. The selection response realized from fifteen generation of selection was 14.9 per cent reduction in nauplii length (from 517.0 ± 39.8 µm to 439.3 ± 27.0µm). Five per cent reduction in cyst size (from 224.83 ± 14.81 µm to 212.5 ± 9.5 µm) was realized as correlated response. Concurrently with the reduction in nauplii and cyst size, significant increase in cyst hatching percentage (10%) was also realized as correlated gain (from 54.4% to 64.58). Heritability estimates (h2) were found to be generally very high. Heritability estimate for the first day nauplii length, pooled for the fifteen generations was 0.94 ± 0.27. The reduction gained in nauplii length selection indicates the efficiency of selection. Since nauplii/cyst size and hatching efficiency along with the nutrient profile are the prime indicators that determine the suitability of Artemia as larval feed, the selectively bred Artemia of the present study make it a promising strain for larviculture activities.
Keywords
Artemia; Cyst size; Hatching percentage; Heritability; Selective breeding; Small nauplii
Introduction
Aquaculture continues to grow more rapidly than all other animal food production sectors in the world. Production from aquaculture has outpaced population growth, with the annual average per capita supply from aquaculture increasing at the rate of 7.1 per cent [1]. Success of any aquaculture venture principally depends on the timely availability of suitable larvae and fingerlings of cultivable size in the required numbers and this can only be provided by a hatchery based larval production system [2]. In hatcheries, live feeds play a key role in deciding the survival, growth and development of the larvae [3,4]. Live feeds can stimulate the feeding and improve the digestive process of the larvae than the artificial micro diets through its prey-predator interactions and exogenous digestive enzymes that aid in digestion [5,6]. Since larvae cannot biosynthesize the essential Polyunsaturated Fatty Acids (PUFAs) namely 20:5n3 and 22:6n3 from its precursors, it has to be supplied through external diets especially live feeds [3,7,8].
Among the different live feeds, Artemia are widely used as the starter diet in larviculture, mostly because of its on-demand hatching ability, soft texture, motility and nutrient content. Although all stages of Artemia are suitable diet for diversified group of finfish and shellfish larvae, nauplii stage is considered as the most preferred larval diet. Hatching efficiency, nauplii size and nutrient profile are the foremost indicators that determine the suitability of the Artemia for larviculture. The nauplii size is the most important factor in larviculture. This is because most of the finfish larvae are small with narrow buccal openings, and therefore, exogenous foods of small size are needed one or two days after hatching by which time vitellinic reserves are depleted [9]. Selection of the diet by the larvae depends to a great extent on the prey size rather than its nutritional quality. Pepin and Penney observed a positive correlation between the mouth widths of the larvae with the prey size. Live feed- larvae interactions have been studied in many fish species [10]. According to Munk [11], the prey size preferred by cod larvae is about 5% of its length. Fernandez-Diaz. et al., reported that the preferred size of live and inert prey for gilthead sea bream larvae is a function of mouth size in the range of 0.1-0.8 times the mouth width. Marine larvae switch to bigger prey slower than their physical capacity to ingest larger prey. In this scenario there is a need for reducing the Artemia nauplii.
Heritability of the trait has an important role in the genetic gain realized from selective breeding since it determines the proportion of the selection differential that can be transferred to the progenies. Heritability is the proportion of the variance in a trait among individuals that is attributable to the differences in genotype. It in the narrow sense is the ratio of additive genetic variance to phenotypic variance. Heritability is a concept that summarizes how much of the variation in a trait is due to variation in genetic factors [12]. Frequently, heritability is used in reference to the resemblance between parents and their offspring. In this context, high heritability implies a strong resemblance between parents and offspring with regard to a specific trait, while low heritability implies a low level of resemblance [12,13] has used the intra-sire correlations or regressions of offspring on dam as a method of estimating heritability. Falconer [14] defined heritability as the regression of breeding value on phenotypic value (h2 = bGP), which is equivalent to the square of correlation between breeding values and phenotypic values (h2= r2GP).
Information on the selective breeding studies in Artemia is scanty. However, heritability estimates of hatching percentage, cyst size, growth rate, thermal stability and heat resistance have been reported, and these reports have indicated the superiority of genotypic influence over the phenotypic control on these traits [15-18]. Half-sib analysis of the naupliar length data of Artemia franciscana by Shirdhankar & Thomas [19] have shown heritability values of moderate magnitude.
Selective breeding in Artemia franciscana for reduction of the naupliar length by Shirdhankar & Thomas [19] have shown that it is very much amenable to selection as the genetic gain realized was substantial. Clegg et al, [16,20] reported that the changes in thermal stability and heat resistance may occur extremely rapidly using genetic selection in Vietnam strain of Artemia.
In this scenario, the objective of the present study was to develop a small nauplii producing Artemia by selective breeding. Generation’s wise estimation of heritability of naupliar size, life history traits and hatching percentage were also made from the selectively bred Artemia and compared with the base generation.
Materials And Methods
Collection of Artemia cysts
Artemia cysts collected from the hypersaline habitats of Kelambakam (CKF), Southeast region of the India (12047’ N - 800 13’ E) during 2008 were brought to the Central Marine Fisheries Research Institute, Cochin laboratory in hypersaline brine filled polyethylene bags. These cysts were cleaned and processed by biphasic flotation method and dried under sun.
Hatching and rearing
Base generation of Artemia (G0) was developed by hatching the cysts (1gm Lr-1) following the established procedure [21]. Freshly hatched nauplii were harvested and stocked (5 individuals per mL) in cylindrical acrylic tanks containing 35 ppt seawater (10Lr). Optimum temperature of 25±10C, with mild aeration and photoperiod of 12h D: 12h L were maintained in all the three rearing tanks. Microalgae, Isochrysis galbana (30 X 104 cells ml-1) taken from the microalgae culture facility of Central Marine Fisheries Research Institute, India were used as the feed (two times a day) for rearing Artemia daily. Artemia tanks were monitored daily and ten percent of the culture medium was exchanged daily using fresh seawater.
Selective breeding
Mass selection was carried out following the established method described by Falconer [22]. Freshly hatched Artemia nauplii (about 1.5 lakhs) were used as base generation, and the small individuals (15,000 constituting about 10%) were selected using different mesh filtering unit of 500, 480, 450 and 400µm. Selected individuals were restocked (1 individual per mL) in to round acrylic tanks (12Lr) containing seawater (35 ± 2‰) for further rearing. The selected and unselected individuals were reared separately under standard culture conditions described above. By the age of fourteen days, males and females of both the selected and unselected populations started to form riding pairs. From the selected population, the precopulatory pairs (1,000 pairs) were selectively harvested and stocked (1 precopulatory pairs per 20 mL) in cylindrical acrylic tanks (20L) and reared under uniform conditions.
Riding pairs started to produce first generation progenies (nauplii) from the third day (D3) of stocking. These progenies were collected and restocked in 3Lr plastic containers (2individuals mL-1). Small progenies were selected to produce the next generation (G2). Likewise, progeny collection and selection process was continued up to eighth day (D8). The selected Artemia were finally pooled and reared in 50Lr circular acrylic tanks (5 individual per mL). From the offspring produced by G2, small nauplii were further selected as described earlier to produce the next generation (G3). Selection for small size nauplii were carried out for fifteen generations (G1 to G15).
Recording and analysis of nauplii length, cyst biometry and hatching percentage
Nauplii length: Nauplii length or First Day Length (FDL) of the generations (G0 to G15) of the selected animals were recorded from the representative samples using a microscope attached with DIGI EYE 330 camera and software (Dewinter Bio-wizard, India) and the mean values were estimated generation wise.
Cyst biometry
The Selectively Bred Artemia Strain (SBAS) biomass was scaled up in one ton fiber-reinforced plastic tanks (FRP) following the standard culture conditions. Thereafter the salinity of the culture medium was increased slowly (10 ‰ daily -1) to 250 ‰ to induce the oviparous reproduction in the SBAS. The newly formed cysts were collected, cleaned, processed, and dried under the shade and stored (40C) until further analysis. To estimate the cyst biometry, cysts were incubated in fresh water at 280C for 2 h for hydration and fixed with Lugol’s Iodine solution to arrest further development and retain its circular shape. The diameter (µm) of the 500 representative cyst samples from each location was measured using a microscope attached with DIGI EYE 330 camera with the Dewinter software (Biowizard). Cyst biometry was compared with the reference strains such as A. franciscana (SFB), Artemia salina (ASL) Artemia tibetiana (TBS), Artemia Vietnam strain (VVC) and also with the native Artemia strains (CKF, GMJ, TTJ, TMM, VDA, and TNM).
Hatching percentage
Hatching percentage of the SBAS were analyzed and compared with the reference Artemia and other indigenous Artemia collected from different hypersaline habitats of India viz., Vedaranyam (VDA), Tuticorin (TTJ), Marakanam (TMM), Tamaraikulam (TNM) and Gujarat (GMJ). Artemia cysts were individually incubated in micro plates (96 well) having seawater (35‰) at room temperature, and kept under light. The plates were observed hourly after 8 hours of incubation for nauplii. Hatching percentage (H %) of the cysts was calculated from the data as follows: hatching % = (number of nauplii hatched /total number of cysts) X 100.
Heritability estimation
Heritability of the selected trait was estimated for each generation. Heritability estimate from the data generated through pair mating. Generation wise heritability estimates were then pooled and mean heritability was estimated.
The variance component analysis was used to estimate sire component of variance, and heritability was estimated from it. The linear statistical model used was
Yik = µ + P + eik
Where,
Yik = Observation of the kth progeny of the ith sire
µ = Overall mean
Pi = Effect of ith sire, where i= 1, 2, 3…..P
eik = Random error attributed to individuals, assumed to be normally and independently distributed with mean zero and variance σ2e.
The Degree of Freedom (D.F.), Sum of Squares (SS), Mean sum of Squares (MS) and Expected sum of Squares (EMS) used for estimation of heritability are given below:
Analysis of variance
|
Source of variation |
D.F. |
SS |
MS |
EMS |
|
Between pairs |
P-1 |
SSP |
MSP |
σ2 W + K1 σ2 P |
|
Between progeny within pairs |
n-P |
SSW |
MSW |
σ2 W |
Where,
P = Total number of pairs
N = Total number of progeny
K1 = Average number of progeny per sire
σ2 = Pair component of variance
σ2W = Error variance component
Computational formula
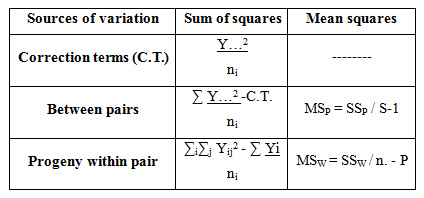
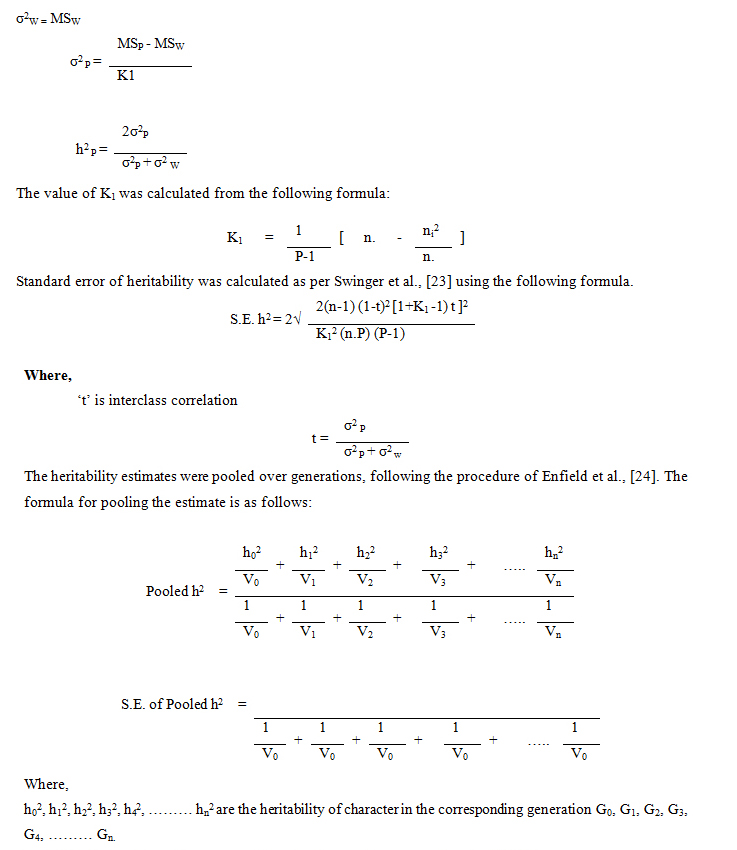
Estimation of variance and heritability
Selection differentials
Selection differentials were calculated as the difference between the mean of the selected individuals who has parented the next generation and the mean of the population before selection of the parents [14]. Standardized selection differential was estimated following the method described by Falconer [22].
Standardized selection differential (i) = (Selection differential) / (Phenotypic standard deviation)
Predicted response and selection gain in each generation was estimated from the full sib data following the method described by Falconer [22].
Predicted genetic response (R) = i σ2p h2
R = Average predicted response per generation
i = Standardized selection differential
σ2p = Phenotypic standard deviation of the trait under selection
h2 = Pooled heritability of selected trait
Pooled heritability was used for prediction of response since it is supposed to be more accurate than individual generation estimates [25].
Statistical analysis
Generation-wise means of all parameters were examined for significance by Analysis of Variance (ANOVA) using the Duncan multiple tests by SPSS programme 13.0 (SPSS Inc, Chicago, USA).
Results
Phenotypic parameters
Morphological observations revealed the length of the freshly hatched Artemia nauplii within the base generation (G0) ranged from 400.0 µm to 570.0 µm with a mean value of 517.0 ± 39.8 µm (Table 1).
|
Generation |
Mean nauplii length with SD* (µm) |
|
G0 |
517.0±39.8a |
|
G1 |
514.6±20.5ab |
|
G2 |
504.7±38.5abc |
|
G3 |
501.7±20.3c |
|
G4 |
491.0±38.7cd |
|
G5 |
490.1±19.4cd |
|
G6 |
482.5±23.1de |
|
G7 |
477.1±27.1ef |
|
G8 |
471.4±27.1efg |
|
G9 |
464.1±30.1fgh |
|
G10 |
463.4±24.8fgh |
|
G11 |
459.4±21.4gh |
|
G12 |
454.5±29.1hj |
|
G13 |
452.2±25.0hjk |
|
G14 |
444.4±31.8jk |
|
G15 |
439.3±27.0k |
Table 1: Generation wise mean nauplii length (µm) in selectively bred Artemia.
* SD= Standard Deviation.
Values with same superscript are not significantly different at (P>0.01).
Heritability estimates of nauplii length
Heritability estimate of the Artemia nauplii (first day length) are presented in table 2. Heritability estimates of the selected Artemia showed generation to generation variations. Heritability was 0.99 ± 0.36 in the base generation while it varied between 0.36 and 1.64 in other generations. Though, the heritability estimates and the standard errors associated with individual generations varied widely the pooled heritability and standard error of the selected trait was 0.96 ± 0.01 (Table 2).
|
Generation |
Heritability |
Standard error |
|
G0 |
0.99 |
0.36 |
|
G1 |
1.10 |
0.30 |
|
G2 |
0.73 |
0.39 |
|
G3 |
1.27 |
0.24 |
|
G4 |
0.47 |
0.18 |
|
G5 |
0.98 |
0.35 |
|
G6 |
1.09 |
0.28 |
|
G7 |
0.31 |
0.23 |
|
G8 |
0.36 |
0.31 |
|
G9 |
1.36 |
0.24 |
|
G10 |
1.21 |
0.29 |
|
G11 |
1.15 |
0.22 |
|
G12 |
1.64 |
0.21 |
|
G13 |
0.42 |
0.28 |
|
G14 |
0.53 |
0.30 |
|
G15 |
1.46 |
0.19 |
Table 2: Heritability estimate and standard error of the Artemia nauplii (first day length).
Selection differentials
Mass selection was practiced in the Artemia nauplii to bring about change in nauplii size. Selection differentials and standard selection differential are presented in table 3. Selection differential in the base generation was -25.97 and it showed variations over the generations. Selection differentials ranged from -33.17 to -8.66 µm in other generations. Lowest selection differential was noticed in G14. Standard selection differential was -0.65 at the base generation and it showed generation wise variations and ranging from -0.95 to -0.27. Phenotypic standard deviation of the different generations is illustrated in table 3. Base generation showed highest phenotypic standard deviation (39.84 µm) followed by G4 (38.75 µm) and G2 (38.59 µm).
|
Generation |
Selection differential (µm) |
Phenotypic standard deviation (µm) |
Standard Selection differential |
|
G0 |
-25.97 |
39.84 |
-0.65 |
|
G1 |
-33.17 |
35.52 |
-0.93 |
|
G2 |
-29.98 |
38.59 |
-0.78 |
|
G3 |
-32.54 |
34.38 |
-0.95 |
|
G4 |
-24.17 |
38.75 |
-0.62 |
|
G5 |
-25.78 |
27.48 |
-0.94 |
|
G6 |
-21.26 |
23.15 |
-0.92 |
|
G7 |
-16.52 |
27.19 |
-0.61 |
|
G8 |
-13.73 |
27.10 |
-0.51 |
|
G9 |
-10.19 |
30.13 |
-0.34 |
|
G10 |
-11.43 |
24.86 |
-0.46 |
|
G11 |
-11.82 |
21.44 |
-0.55 |
|
G12 |
-14.19 |
29.19 |
-0.49 |
|
G13 |
-14.02 |
25.09 |
-0.56 |
|
G14 |
-8.66 |
31.84 |
-0.27 |
|
G15 |
NA |
27.09 |
NA |
Table 3: Selection differential of length (µm), Phenotypic standard deviation (µm) and Standard Selection differential of the fifteen generations of selected Artemia.
Response to selection
The generation wise mean values of nauplii length with standard deviation are presented in table 1. The mean nauplii length was 439.3±27.0 µm, after fifteen generations of selection, as against 517.0±39.8 µm in the base generation. A gradual decrease in nauplii length was noticed during the selection process. Mean nauplii length was 514.6±20.5 µm in G1 while it was 504.7±38.5 µm in G2, likewise reduced in other generations also. Selection gain was -2.40 µm in G1 while it reduced sharply in G2 to -9.86 µm maximum selection gain was noticed in G4 (-10.70 µm) and minimum was in G10 (-0.76 µm). Selection gain in the Fifteenth Generation (G15) was -5.13 µm. Cumulative selection gain after the fifteen generations of selection was 77.67 µm table 4.
|
Generation |
Predicted gain (µm) |
Realized gain (µm) |
Cumulative gain (µm) |
|
G0 |
-24.93 |
NA |
NA |
|
G1 |
-31.84 |
-2.4 |
-2.4 |
|
G2 |
-28.78 |
-9.86 |
-12.26 |
|
G3 |
-31.24 |
-2.97 |
-15.23 |
|
G4 |
-23.2 |
-10.7 |
-25.93 |
|
G5 |
-24.75 |
-0.95 |
-26.89 |
|
G6 |
-20.41 |
-7.61 |
-34.49 |
|
G7 |
-15.85 |
-5.33 |
-39.82 |
|
G8 |
-13.18 |
-5.78 |
-45.6 |
|
G9 |
-9.79 |
-7.21 |
-52.81 |
|
G10 |
-10.97 |
-0.76 |
-53.57 |
|
G11 |
-11.35 |
-3.94 |
-57.51 |
|
G12 |
-13.63 |
-4.96 |
-62.47 |
|
G13 |
-13.46 |
-2.31 |
-64.78 |
|
G14 |
-8.31 |
-7.76 |
-72.54 |
|
G15 |
NA |
-5.13 |
-77.67 |
Table 4: Predicted, realized and cumulative gain (µm) in nauplii length of Artemia from fifteen generations of selective breeding.
Correlated response
Cyst size: A reduction in cyst size was realized in the Selectively Bred Artemia Strain (SBAS) as a correlated response. After 15 generations of selection the cyst size in the selected line got reduced to 212.5 ± 9.4 µm from 224.83 ± 14.81 µm in the base generation. It was also smaller than reference strains VVC (218.26 ± 10.84 µm), SFB (222.0 ± 14.5 µm), ASL (261.7 ± 17.4 µm) and TBS (319.4 ± 24.7 µm) as well as the other indigenous strains studied (236.4 to 219.6 µm) (Table 5). Duncan’s multiple range test categorized Artemia strains based on the cyst size into eight different homogeneous subsets. SBAS formed the first sole group with lowest cyst size, while the reference VVC and SFB strains and the native TMM strains formed the second group with marginally higher cyst size (218 to 221 µm). Other native strains viz, VDA and TNM, and exotic species like ASL and TBS which possessed significantly higher cyst sizes (231.56, 236.38, 261.72 and 319.39 respectively) formed different subsets (Table 5).
|
Artemia strain |
Mean with SD1 (µm) |
SE 2 |
|
Base generation3 |
224.83 ± 14.81a |
1.3 |
|
SBAS4 |
212.49 ± 9.418d |
1.41 |
|
TTJ5 |
223.35 ± 11.57ca |
0.85 |
|
TMM6 |
219.63 ± 10.99bc |
1.54 |
|
VDA7 |
231.56 ± 15.61e |
1.17 |
|
TNM9 |
236.37 ± 19.00f |
2.03 |
|
GMJ10 |
226.16 ± 14.01a |
1.42 |
|
VVC8 |
218.26 ± 10.84b |
1.16 |
|
ASL11 |
261.72 ± 17.35g |
1.66 |
|
TBS12 |
319.39 ± 24.74h |
2.41 |
|
SFB13 |
221.95 ± 14.45bca |
1.46 |
Table 5: Mean cyst diameter of the base, selectively bred Artemia strains (SBAS) and the different reference Artemia strains.
1SD: Standard Deviation, 2SE: Standard Error, 3CKF/ Base strain: Kelambakam, 4SBAS: Selectively Bred Artemia Strain, 5TTJ: Tuticorin, 6TMM: Marakanam, 7VDA: Vedaranyam, 8VVC: Artemia Vietnam strain, 9TNM: Tamaraikulam , 10GMJ: Mithapur- Gujrat, 11ASL: Artemia salina, 12TBS: Artemia tibetiana and 13SFB: A. franciscana.
Values with same superscript are not significantly different at (P>0.01).
Hatching percentage
Selective breeding for nauplii size reduction resulted in a correlated increase in the hatching percentage also. At the end of 15 generations of selection the hatching percentage in the selectively bred strain was 64.58% as against 54.4% in the base generation which is collected from wild. It was higher than other indigenous strains except GMJ (84.52%) and exotic strains except SFB (72.22%).
Discussion
The genetic studies in Artemia are limited to cytogenetics, genetic diversity, molecular taxonomy, phylogenetic analysis, etc. There is an apparent knowledge gap in quantitative genetics of the Artemia since only few attempts to study quantitative genetic parameters and quantitative genetic manipulations have been made hitherto.
In the present study, 14.9 per cent reduction in the nauplii length was realized from fifteen generations of selective breeding for size reduction in the indigenous Artemia. Concurrently, 5 per cent reduction in the cyst size and 10% increase in hatching percentage were also realized as correlated response in the selectively bred Artemia strain.
The nauplii length in the SBAS could be brought down to 439.3±27.0µm from 517.0±39.8 µm in the base generation through fifteen generation of mass selection. Size-wise, it is smaller than the nauplii of the commercial strain of Artemia franciscana (502.6±97.13) hatched along with the selected strain, and naupliiar size reported for A. franciscana (487.07 µm and 490.67 µm) by Shirdhankar et al., [26]. Needless to say it is smaller than the naupliiar size reported for various Artemia species globally viz., Artemia franciscana, Greek Artemia sp. (507.4 to 455.0 μm) [27], Artemia urmiana (466.3 to 505.0 μm) [28], Spanish Lamata Artemia (469.2 μm) [29], Italian Margherita di Savoia Artemia (517.0 μm) [30], Portugal Samouco Artemia (503.5 μm) [31] and Artemia tibetiana strain (667.0 μm) [32]. The Italian Tore Colimena strain (422.7 μm) has the smallest nauplii length [33].
Correlated response by way of reduction in the cyst size and increase in hatching percentage were also realized in the selectively bred Artemia strain. Selection has resulted in 5% (-12.34µm) reduction in cyst size than that of base generation. SBAS cyst was found to be smaller than that of various Artemia strains reported worldwide viz., A. urmiana (262.7 to 286.6 μm) [28], Srilankan Artemia sp. (248.7 to 267.9 μm) [34], Algerian Artemia sp. (236.0 μm) [35] and A. parthanogenetica (260.0, 244.9 μm) [29,36]. The reduction gained in cyst size and nauplii length after fifteen generations of selection indicates the efficiency of selection. Phenotypic differences observed among the offspring were due to genetic differences among parents pursuant to selection because all were cultured under the same environmental conditions. Size reduction following the selective breeding is brought about through changes in gene frequencies at loci that influence the selected character [22]. Selection induces a change in gene frequency by separating the individuals into large and small groups with a difference in gene frequencies, from which the small groups were selected for developing the SBAS.
Heritability of the selected trait
Trait under selection was nauplii size and the full-sib values of nauplii length were used to estimate the heritability. Higher heritability (h2) estimates were obvious in the different generations of Artemia subjected to selection in the present study. Heritability estimated from the full sibs produced from pair mating is the heritability in the broad sense and it represents the ratio of the total genetic variance to the total phenotypic variance. The total genetic variance includes additive genetic variance, variance due to dominance deviation and epistatic interaction [37] and hence are of higher magnitude than the estimate from half-sib data. Lester [38] has reported that the maternal effects and genetic difference among families may also result in an inflated value for heritability estimated from full sib data resulting from pair mating.
Though the pooled h2 estimates for FDL in the SBAS was high (0.96 ± 0.01), it was lower than the h2 estimates of A. franciscana strain (1.33 ± 0.04, 1.4 ± .04 and 1.3 ± .04) as reported by Shirdhankar & Thomas [19]. High heritability estimates values observed in full sibs from sire dam pair mating may be due to a substantial quantum of dominance deviation and / or epistatic interaction and maternal effects in the population under study as suggested by Shirdhankar [37] and Lester [38]. Briski et al. [18], observed wide variations in h2 values in the Artemia sp. subjected to selection (0.11 to 0.95). Reports of h2 estimate beyond the normal theoretical limits in several species are not uncommon in the literature [39,40]. Lester [38] suggested that the maternal effects and genetic differences among the families can result in inflated h2 estimates from full sib data as evidenced in the early growth phase of Penaeus stylirostris (1.31 ± 0.62 to 0.64 ± 0.58). Falconer [41] has observed that variations in the h2 often occur in generations, but they do not follow any particular trend as reported earlier. According to Wickins [42], ectotherms aquatic animals generally lack sophisticated endogenous homeostasis mechanisms like mammals and birds possess, and because of this environment holds profound effect on phenotypic expression of the individual’s genotype.
The h2 estimates of the FDL from the present work clearly indicate that the genetic effect on the nauplii length of Artemia sp profound. A substantial portion of the variance in the population is due to additive genetic variance, which is reflected in the cumulative selection gain of the mass selection programme. However, the higher h2 values indicate that non-additive genetic factors are also contributing substantially to the total genetic variance.
Hatching percentage is an important quality indicator which decides the potential of the Artemia strain for aquaculture application. The present study shows that the cyst hatching percentage has significantly improved after the selection (10% increase) when compared to the base generation. The SBAS had higher hatching percentage (64%) than the unselected indigenous strains studied (45 to 55%), except the GMJ strain and exotic SFB strain of A. franciscana.
Nauplii/cyst size, hatching efficiency and nutrient profile are considered as the prime indicators that determine the quality of the Artemia strains for larviculture. The selectively bred Artemia strain developed from the present study fulfils all the above requirements making it a promising candidate strain for larviculture activities.
Conclusion
Present study reports the reduction in nauplii length by 14.9% as the direct response to fifteen generations of mass selection for nauplii size reduction in indigenous Artemia. Reduction of cyst size (5%) and increase in the hatching percentage (10 %) were also realized as correlated response. The selectively bred Artemia strain developed from the present work has small sized nauplii and cyst size and high hatching efficiency making it a promising candidate strain for larviculture. Further studies are required to validate the performance of the strain in field conditions.
Acknowledgement
The authors are thankful to the Director, CMFRI and Cochin for providing necessary facilities to carry out the work. The senior author thankfully acknowledges the fellowship from Department of Biotechnology (DBT), Government of India. Thanks are due to P. Shiju for his help rendered in laboratory works at CMFRI, Kochi, India.
References
- FAO (2010) The state of world fisheries and aquaculture 2010. FAO, Rome, Italy. Pg no: 6.
- Vikas PA, Sajeshkumar NK, Thomas PC, Chakraborty K, Vijayan KK (2012) Aquaculture related invasion of the exotic Artemia franciscana and displacement of the autochthonous Artemia populations from the hypersaline habitats of India. Hydrobiologia 684: 129-142.
- Vikas PA, Chakraborty K, Kumar NKS, Thomas PC, Sanil NK (2016) A unraveling the effects of live microalgal enrichment on Artemia nauplii. Indian Journal of Fisheries 59: 111-121.
- Sorgeloos P, Dhert P, Candreva P (2001) Use of the brine shrimp, Artemia, in marine fish larviculture. Aquaculture 200: 147-159.
- Kamarudin MS, Jones DA, Vay LL, Abidin AZ (1994) Ontogenetic change in digestive enzyme activity during larval development of Macrobrachium rosenbergii. Aquaculture 123: 323-333.
- Baskerville-Bridges B, Kling LJ (2000) Early weaning of Atlantic cod (Gadus morhua) larvae onto a microparticulate diet. Aquaculture 189: 109-117.
- Vikas PA, Thomas PC, Kumar NKS, Chakraborty K, Sanil NK (2016) Effect of salinity stress on biochemical constituents and ArHsp22 gene expression in Artemia franciscana. Indian Journal of Fisheries 61: 150-156.
- Sargent J, Tocher D, Bell G (2002) The lipids In: Halver JE, Hardy RW (eds.). Fish Nutrition, (3rd edn). Academic Press, San Diego, California, USA. Pg no: 181-257.
- de Barros HP, Valenti WC (2003) Food intake of Macrobrachium rosenbergii during larval development. Aquaculture 216: 165-176.
- Olsen AI, Attramadal Y, Jensen A, Olsen Y (1999) Influence of size and nutritional value of Artemia franciscana on growth and quality of halibut larvae (Hippoglossus hippoglossus) during the live feed period. Aquaculture 179: 475-487.
- Munk P (1992) Foraging behaviour and prey size spectra of larval herring Clupea harengus. Marine Ecology Progress Series 80: 149-158.
- Lush JL (1940) Intra-sire correlations or regressions of offspring on dam as a method of estimating heritability of characteristics. Journal of the American Society of Animal Production 1940: 293-301.
- Wray N, Visscher P (2008) Estimating trait heritability. Nature Education 1: 29.
- Falconer DS (1960) Introduction to quantitative genetics. Oliver and Boyd Ltd, Edinburg, London.
- Tackaert W, Vanhaecke P, Sorgeloos P (1987) Preliminary data on heritability of some quantitative characteristics in Artemia In: Sorgeloos P, Bengtson DA, Decleir W, Jaspers E (eds.). Artemia Research and its Applications Vol 1 Morphology Genetics Strain characterization Toxicology Universa PressWetteren Belgium. Pg no: 241-248.
- Clegg JS, Jackson SA, Hoa NG, Sorgeloos P (2000) Thermal resistance, developmental rate and heat shock proteins in Artemia franciscana, from San Francisco Bay and southern Vietnam. Journal of Experimental Marine Biology and Ecology 252: 85-96.
- Clegg JS, Trotman CAN (2002) Physiological and biochemical aspects of Artemia ecology. Artemia: Basic and Applied Biology 1: 129-170.
- Briski E, Stappen GV, Bossier P, Sorgeloos P (2008) Laboratory production of early hatching Artemia sp. cysts by selection. Aquaculture 282: 19-25.
- Shirdhankar MM, Thomas PC (2003) Heritability Estimates of Naupliar Length in Artemia franciscana Using Different Methods. Asian Fisheries Science 16: 69-76.
- Clegg JS, Trotman CAN (2002) Physiological and biochemical aspects of Artemia ecology. Artemia: Basic and Applied Biology. Pg no: 129-170.
- Sorgeloos P (1986) Live animal food for larval rearing in aquaculture: The brine shrimp Artemia. In Bilio M, Rosenthal H, Sindermann CJ (eds.). Realism in Aquaculture: Achievements Constraints Perspectives. World Conference on Aquaculture Venice, Italy. Pg no: 199-214.
- Falconer DS (1981) Introduction to quantitative genetics (2nd edn). Longman, NewYork, USA. Pg no: 340.
- Swinger LA, Harvey WR, Everson DO, Gregory KE (1964) The variance of intraclass correlations involving groups with one observation. Biometrics 20: 818-826.
- Enfield FDRE, Comstock RE, Braskerud O (1966) Selection for pupa weight in Tribolium castaneum I Parameters in Base Populations Genetics. 54: 523-533.
- Kinney TB, Shoffner RN (1967) Phenotypic and genetic responses to selection in a meat type poultry population. Poultry Science 45: 900-910.
- Shirdhankar MM, Thomas PC, Barve SK (2004) Efficacy of selection in sexually breeding Artemia (Artemia franciscana Kellogg, 1906) Aquaculture Research 37: 1276-1281.
- Moraiti-Ioannidou M, Castritsi-Catharios J, Miliou H, Kotzamanis YP (2007) Fatty acid composition and biometry of five Greek Artemia populations suitable for aquaculture purposes. Aquaculture Research 38: 1664-1672.
- Abatzopoulos TJ, Baxevanis AD, Triantaphyllidis GV, Criel G Pador EL, et al. (2006) Quality evaluation of Artemia urmiana Günther (Urmia Lake, Iran) with special emphasis on its particular cyst characteristics (International Study on Artemia LXIX). Aquaculture 254: 442-454.
- Hontoria F (1990) Caracterizacio a ´rea levantina espan toral Thesis Universidad Auto ˜ola del crusta´n de tres poblaciones originarias del ´podo Artemia Doc´ceo branquio ´noma de Barcelona. Pg no: 326.
- Vanhaecke P, Sorgeloos P (1980) International Study on Artemia IV The biometrics of Artemia strains from different geographical origin. In: Persoone G, Sorgeloos P, Roels O, Jaspers E (eds.). The Brine Shrimp Artemia Vol 3 Ecology Culturing Use in Aqua- culture Universa Press, Wetteren, Belgium. Pg no: 393-405.
- Vilela MH, Branco MAC (1987) Characterization of Portuguese Artemia strains. In: Sorgeloos P, Bengtson D, Decleir AW, Jaspers E (eds.). Artemia Research and its Applications Vol 1 Morphology Genetics Strain Characterization Toxicology. Universa Press, Wetteren, Belgium. Pg no: 211-217.
- Abatzopoulos TJ, Zhang BO (1998) Artemia tibetiana: preliminary characterization of a new Artemia species found in Tibet (People’s Republic of China). International Study on Artemia International Journal of Salt Lake Research 7: 41-44.
- Mura G, Baxevanis AD, Lopez GM, Hontoria F, Kappas I, et al. (2005) The use of a multidisciplinary approach for the characterization of a diploid parthenogenetic Artemia population from Torre Colimena (Apulia, Italy). Journal of Plankton Research. Pg no: 1-27.
- Kuruppu MM, Ekaratne SUK (1995) Ecology and population structure of the Artemia parthenogenetica population inhabiting a major saltern in Sri Lanka. International Journal of Salt Lake Research 4: 117-131.
- Kara MH, Bengraine KA, Derbal F, Chaoui L, Amarouayache M (2004) Quality evaluation of a new strain of Artemia from Chott Marouane (Northeast Algeria). Aquaculture 235: 361-369.
- John CJA, Abatzopoulos TJ, Marian PM (2004) Characterization of a new parthenogenetic Artemia population from Thamaraikulam, India. Indian journal of biological research 2: 63-74.
- Shirdhankar MM (1999) Studies on genetic architecture and predicted response in biometrical traits of sexually breeding Artemia. PhD Thesis.
- Lester LJ (1988) Differences in larval growth among families of Penaeus stylirostris Stimpson and P vannamei Aquaculture Research 19: 243-251.
- Mclaren I, Corkett C (1978) Unusual genetic variation in body size development times oil storage and survivorship in the marine copepod Pseudocalanus. Biol Bull 155: 347-359.
- Durborow RM, Avault JW, Jr Johnson WA, Koone KL (1985) Differences in mortality among full-sib channel catfish Families at Low Dissolved Oxygen. Progressive Fish-Culturist 47: 169-175
- Falconer DS (1955) Patterns of response in selection experiments with mice. Cold Spring Harbour Symposium on Quantitative Biology 20: 178-196.
- Wickins JF (1981) Water quality requirements for intensive aquaculture a review. In: Tiews K (eds) Proc World Symp on Aquaculture in heated effluents and recirculation systems Stavanger. Pg no: 28-30.
Citation: Vikas PA, Sajeshkumar NK, Thomas PC, Chakraborty K, Jayasankar J, et al. (2021) Reduction of Nauplii Size in an Allochthonous Artemia Strain through Selective Breeding. J Aquac Fisheries 5: 041.
Copyright: © 2021 Vikas PA, et al. This is an open-access article distributed under the terms of the Creative Commons Attribution License, which permits unrestricted use, distribution, and reproduction in any medium, provided the original author and source are credited.