Simulation-Based Reconstruction for Totoaba (Totoaba macdonaldi [Gilbert, 1890]; Perciformes, Sciaenidae) Stock: Recovery Scenario and Management Implications
*Corresponding Author(s):
Ernesto A ChávezInterdisciplinary Center Of Marine Sciences, Department Of Fisheries And Marine Biology, La Paz, Mexico
Tel:52 6121203845,
Email:echavez@ipn.mx
Abstract
Totoaba, is a fish endemic to the upper Gulf of California, protected since 1975. Juveniles are incidentally caught by shrimp boats, but the gillnet fishery and poaching also capture solder specimens. Therefore, the goal of this paper is to determine the current status of the totoaba stock after 45 years of prohibition of its capture. The analysis of the age structure from catch data and simulation of potential biomass reconstructing the current population carried-out. Current stock biomass is estimated in >41,000 t, as compared to 16,000 t estimated for 1933, and <2,000 t in 1945-1974, when the stock was collapsed. The number of adults estimated for 2015 exceeds 637,000 and the total stock size is >2.4 Million fish. Results suggest a population recovery, but the illegal exploitation induced by high demand, may result in booming illegal trade. Reopening the fishery is suggested to avoid an uncontrolled illegal exploitation and the risk of new collapse of the totoaba. A catch quota of 1,000 adults the first year is recommended.
Keywords
Endangered species; Fisheries management; Gulf of California; Simulation; Stock assessment; Totoaba
INTRODUCTION
The totoaba is the largest fish of the Family Sciaenidae (Figures 1&2), measuring up to 2 m long and with a weight of up to 135 kg [1-5]. It is endemic to the upper Gulf of California, where it displays a migratory pattern [6,7] making use of the Colorado River estuary as a nursery ground. This species suffered an intense exploitation for decades until 1974, when the stock collapsed and then protected with a permanent ban in place since 1975 [8]. One year later, the IUCN declared it as endangered [9,10]. However, since 1979, the US government, through NOAA, declared totoaba as an endangered species [11]. Establishment of the Biosphere Reserve in the Upper Gulf of California and the Colorado River Delta in 1993 was the most important institutional effort to improve the conservation of totoaba and the vaquita (Phocoena sinus), an endangered dolphin. Since then, the population was endangered and has been legally untouchable, although poaching has existed since the beginning of the closure, increasing in recent years, stimulated by the demand and high cost of the swim bladder in the black market, leading to be considered part of a transnational organized crime [12].
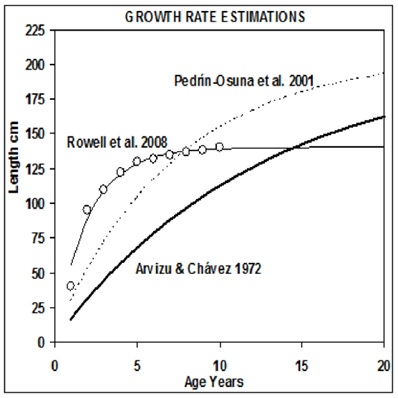 Figure 1: Growth rate of totoaba described by the von Bertalanffy growth model.
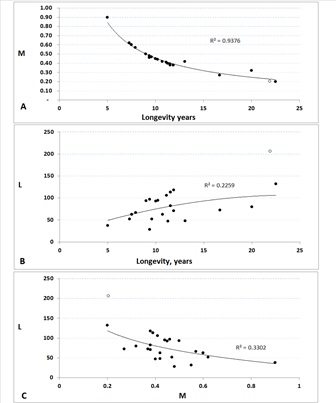 Figure 2: Comparison of some critical variables of the population dynamics of the totoaba and other components of the Family Sciaenidae.
Factors associated to the population collapse
Lercari & Chavez [13] stated that several factors contributed to the decline of the stock, finding a significant correlation with the virtual disappearance of the Colorado River discharge and loss of nursery habitat caused by the construction of the Hoover dam in 1934 and the Glenn Canyon dam in 1953 on the American side of the river. The excessive growth of the fleet catching totoaba is a factor that undoubtedly contributed to the collapse, as well as the recent discovery of the influence of climate variability, as measured by the Index of the Pacific Decadal Oscillation (PDOI). The impact of climate seems to be more general than believed [14,15]. Over exploitation of all the stock, juvenile overexploitation as by catch in shrimp fishery and plundering are identified as main causes of stock depletion of totoaba [16-18]. Effects of all these factors had a synergistic effect. The increasing black market and poaching were stimulus for writing the present paper, hoping to awake the interest of the Mexican authorities for supporting further studies addressed to the application of management regulations based on accurate stock assessment and controlling the growing problem of illegal exploitation.
METHODS
The FISMO-simulation model was used [19,20], as a basis for this analysis; it was developed for the assessment of exploited stocks. It uses the population parameters and catch data since 1930 as input, used to rebuild the age structure during the time the fishery flourished. It allowed the simulation of an additional 40 years for the estimation of the status of the stock. The limited information available provided the basis for calibrating the simulation model before 1974.
Initial stage of the evaluation of a currently or potentially exploitable stock is to evaluate the growth rate. Then, estimated growth rate referred to the age structure in the population sampled, referred to the population in its habitat. By using this process, it is feasible to determine the decline in the number of individuals in a cohort as they get older and by using an exponential equation, the coefficients of natural and fishing mortality could be estimated. The exploited biomass was evaluated by multiplying the number of individuals of each age by their mean weight at each age. The sum of the weights of the animals of all ages can provide an estimate of the biomass caught, and with some reference to the population abundance, it is feasible to evaluate the total stock biomass.
The simulation model reconstructs the population in numbers and volume per age group, both during the historical period and in the 41-year projection. The 41-year reconstruction was made by using an approximately constant fishing mortality. In this case, the estimated fishing mortality through estimates of by-catch by the two fleets mentioned (F = 0.002 - 0.003) was used exploiting about 0.001 % of the population. This low exploitation rate is assumed to be equivalent to the incidental catch by the shrimp fishery.
The rate of exploitation (E = F/(M + F)) is considered a part of the diagnosis for each year of the series, where M = Natural mortality and F = Fishing mortality, M is a constant and F was estimated for each year. The values of E were compared to that of E at the level of the maximum yield (MSY = Maximum Sustainable Yield), which is the threshold of overexploitation or maximum acceptable limit of exploitation at FMSY, the fishing mortality that produces the MSY. With these calculations made, it was possible to diagnose the state of the exploitation for each year of the data series, with the F values below the horizontal line indicating the boundary between a population underexploited and those above the line indicate which one is overexploited. Details of the stock assessment procedure are based on methods described by Beverton & Holt [21], and were adopted in the simulation model. Data used as input of the simulation model are in table 1.
|
Parameter |
Value |
Unitsor ref. |
|
K |
0.14 |
Bertalanffy |
|
L |
206 |
cm Bertalanffy |
|
W |
102,623 |
g Bertalanffy |
|
to |
-0.30 |
years Bertalanffy |
|
a |
0.02 |
Length - Weight |
|
b |
2.90 |
Length - Weight |
|
Age of 1st catch |
3 |
Years |
|
Maturity age |
7 |
Years |
|
Longevity as 3/K |
21 |
Years |
|
Natural mortality, M |
0.21 |
per year |
Table 1: Parameter values used to feed the simulation model of Totoaba.
The model estimates recruitment rate during the historical period of the fishery, and the recruitment predicted during the future projection by using the same parameter values of the Beverton & Holt recruitment model [21], with which it was possible to evaluate the status of the stock. In this case, recruits were considered as those fish one-year old and for the simulation period, recruitment rate was based on the mean number of recruits per adult of the historical record.
Model calibration
Because of the need of recent data on the population abundance of totoaba and constrained by the legal impossibility of sampling the population in its natural environment, the limited information available was used. The calibration was a necessary step in the assessment process. The Atlas by Pedrín & German [22] provides, among other data, the totoaba by catch in the shrimp fishery in 1991, which were used to make a calibration of the stock and the fishery during the historical catch records and 40 years after the closure, allowing estimating its abundance through the simulation period.
RESULTS
Age and growth rate
The estimated number of individuals and biomass of the population are variables subject to a high degree of uncertainty. This uncertainty is greater if the sample size used as the basis for the estimation is low and thus has the risk of being not representative. The problem of lack of representativeness and thus the implicit error in the estimates becomes evident when comparing growth rates estimated using various sources [3-5,23]. Consequently, resulting growth rates differ in the asymptotic length in up to 40 cm, as shown in figure 1, which translates into huge differences in the biomass of the whole population. The growth values adopted here are from Pedrín-Osuna [5].
The curves from Arvizu and Chávez [3] and Pedrín Osuna et al. [5], are from the source. The curve of Rowell et al. [23], was calculated from data “post-dam” (presumably in their figure 3, the length of one year in the data “pre-dam” were omitted, and if so, trends before and after the dam display very little difference).
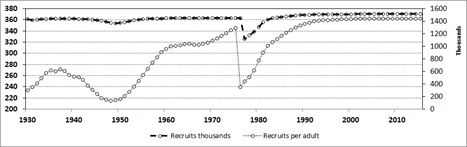 Figure 3: Recruitment of the population of totoaba, estimated for the historical period and simulated after 1974 (blue line, left axis). In red line (right axis), the number of recruits per adult is shown; the low recruitment is evident, approaching zero from the years 1945 to 1973. Since 1993 the number of one year old recruits per adult is >1,438,000, suggesting that the stock is fully recovered since then and exceeding in twice the values estimated for the late thirties.
Comparative dynamics of the totoaba in the context of Sciaenidae
With the purpose of examining the dynamics of T. macdonaldi in a comparative way, population parameters of the 25 species of the Family Sciaenidae recorded in Fish Base [24] were examined. From this data series, three parameters were compared, asymptotic Length (L), natural Mortality (M), and longevity. For consistency of the analysis in this paper, the parameter values used for the totoaba in this comparison were the same as those in the simulation model. These values are shown in figure 2; from here, longevity was used as independent variable in two cases, and M and L are dependent variables (Figure 2). In the third case, M is the independent variable and L is the dependent variable (Figure 2). In the first case, correlation was high (R2 = 0.9475); the two others are hardly significant. However, trends are consistent showing that M displays a strong inverse correlation with longevity (Figure 4); the maximum size does not show a strong correlation with longevity; however, the same pattern as in the first case is observed, indicating what is already known, that large fish live longer (Figure 2) and vice versa.
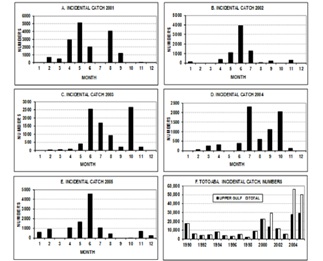 Figure 4: Incidental totoaba monthly catch data for 2001 to 2005 and total of the years 1990 - 2005. In the F figure, three of the last five-year columns show an increasing number of the catch outside the upper Gulf; before that period, the numbers are even. This increase can be evidence of stock recovery.
In each graph, the position of totoaba is indicated with a white dot. A. Correlation of natural mortality (M) and the longevity. B. Maximum length as a function of longevity; the totoaba is the largest species of the group displaying a large longevity. C. Maximum length (L) as a function of natural mortality (M); here again, the totoaba displays the longest size together with a low mortality. This attribute makes it very susceptible of depletion as consequence of overexploitation.
By testing the relation between L and M, a negative correlation between these variables is shown, although is low; but again, the trend suggests that the species with low M have high longevity and vice versa (Figure 2). In this figure, the totoaba displays the highest L and the lowest M values on the left side of the graph, indicating that a low natural mortality is closely associated to the largest size of the group.
Incidental catch
Data from direct samplings and from the incidental catch of totoaba in the shrimp fishery were confidential until now. These data were crucial to enable a more accurate approach on assessing the stock biomass in the upper Gulf of California. Data suggest that the catch can occur all year round, though it is more likely between May and October (Figure 4). The historical trend of 2001 to 2005 shows that in 2001 more than 16,000 individuals were caught and then the number declined, but between 2002 and 2005 an increasing trend between 7,500 and 10,500 totoaba were taken (Figure 4). The latter was interpreted as an upward trend. The by-catch is so large in all these years that may approach 250 t, which obviously is a good indicator of its overall abundance in the ecosystem of the Upper Gulf of California and it may be interpreted as an evidence of stock recovery.
The size composition of incidental catch during 2002 to 2004 (Figure 5) suggests that the by catch contains almost exclusively young animals, because this species reaches maturity size at 130 cm total length. That information may be insufficient, but under the absence of any other data, this allowed an estimation of the fishing mortality of the by catch in the shrimp fishery. It was also assumed that in the gillnet fishery, the totoaba had a similar mortality. From the model calibrated to these data, F values were known and a fishing scenario was defined.
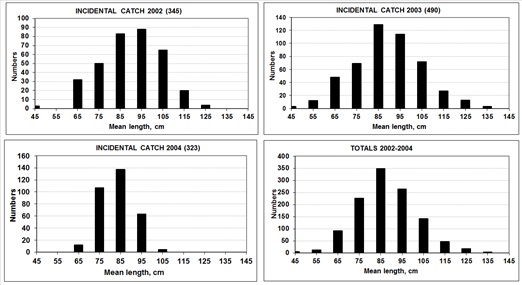 Figure 5: Size composition of the incidental catch of the years 2002-2004. A, 2002 sample, n = 345 fish. B, 2003 sample, n = 490 fish. C, 2004 sample, n = 321 fish. D, all data in samplings. The y-axis indicates numbers per size class. All fish in these samples are juvenile.
Diagnosis of the population
Reconstruction of the stock biomass from 1930 to 1974 shows a dramatic decline in the last year of the fishery; in 1932 and 1933 had low catch values. Afterwards, it was followed by an increase to 2,200 t, then a decrease the next two years, and another peak reaching about 2,300 t the year after, then followed by another drop till 1957 when there was a low harvest of 350 t. After this, a new weak increase reached about 1,300 t and then dropped to its virtual disappearance in 1974 with a catch of only 57 t (Figure 6).
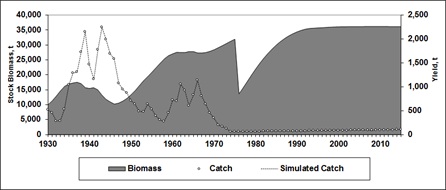 Figure 6: Trends of the stock biomass, catch and simulated totoaba catch (t), since 1930 to 2015. An evident drop in the stock biomass is remarkable in 1974, when the fishery collapsed and the ban was imposed. Catch data after 1974 (right scale), correspond to the resulting harvest after applying an assumed F = 0.002.
By examining the Exploitation rate (E) and the Fishing mortality (F) over the exploitation period (Figure 7), it is evident that the stock was over exploited in 1939 and from 1941 to 1949. Likewise, the exploitation rate suggests that the fishery was over exploited from 1937 to 1949, excepting the year 1940.
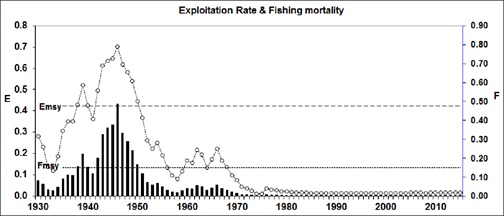 Figure 7: Diagnosis of the status of exploitation of totoaba, based on F and E values during 45 years of the fishery, and 41 additional years of simulation. Bars represent fishing mortality (F, right scale) and the estimated and simulated exploitation rates (E), in dashed line (left side scale). E and F at the MSY level are the two horizontal lines.
When both sets of E values were checked, it became evident that the totoaba was underexploited for only the fifteen first fishing seasons, from 1930 to 1944 (Figure 7) and finally since 1971, when the fishery was in the way of being closed. During these last four years, the stock showed little signs of recovery, probably as result of its scarcity and further reduction of the fishing effort. This evidence is a sign of overexploitation of the stock in a process that inevitably led to its collapse.
The number of one-year old recruits followed a similar decrease, and though they depended on the number of adults, the trend does not reflect a parallel decline (Figure 3). Here in the years 1974 to 1975, the recruit number displayed a severe drop decreasing from 1,225 thousand to near 400 thousand the year after, when the ban to the fishery was imposed. By estimating a constant number of recruits per adult, in the simulation, recruits displayed a consistent increase as consequence of the increasing number of adults, and recruit number reached its maximum once the adult stock was fully recovered (Figure 3).
RECRUITMENT
In the depleted period of the fishery, recruitment shows an abrupt drop after 1945 from nearly 469,000 to 223,000 in 1971 with a partial recovery showing two peaks between 1950 and 1971. However, as consequence of the closure of the fishery, and with some delay, the number of recruits displayed an increase also abrupt after 1971, attaining the normal range of about 475,000 by 1984, being stable afterwards until the last year of simulation (Figure 3). By examining the recruitment rate per adult, the analysis indicates that during the period of collapse of the fishery, there was a significant reduction of the recruitment rate. In the years of exploitation, the stock had high recruitment rate, with more than 600,000 per adult, declining to less than 11,000 for the years 1945 to 1973. The period of recovery started in 1974 until 1992, when the rate surpassed 1,400,000 recruits per adult, maintaining these high numbers afterwards (Figure 3).
Age structure
Estimated fishing mortality through estimates of by-catch by the two fleets mentioned (F = 0.002 - 0.003) was used exploiting about 0.001 % of the population. This is a low fishing intensity allowing the stock to recover, as evidenced in figures 8&9, showing the trend of age groups in numbers (Figure 8) and in biomass (Figure 9) during the historical period and during the additional years of simulation.
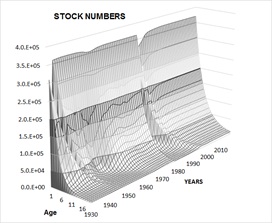 Figure 8: Reconstruction of the population of totoaba in numbers during the exploitation period (1930-1974) and for 41 additional years since the establishment of the permanent ban. According to data, the stock shows an inherent capacity to recover its biomass, despite the incidental catch, which is not so severe as to constrain significantly its recruitment rate.
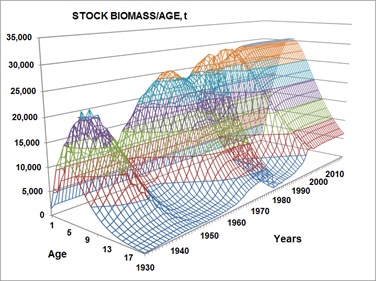 Figure 9: Reconstruction of the population of totoaba stock in biomass (t) during the exploitation period (1930-1974) and for 41 additional years since the establishment of the permanent ban. A maximum level of biomass of about 36,000 t was estimated, probably determined by the carrying capacity and by its fecundity, which is consequence of adaptive process.
Potential yield
The simulation model allowed predicting potential yield as a function of the values of growth, mortality, recruitment, and catch volumes recorded in recent years. Thus, depending on the age at first capture and fishing mortality as independent variables, the model suggests that the potential stock biomass of totoaba is higher than 36,000 t and the catch could exceed 2,370 t at an age at first capture of seven years and an F = 0.2. This is just a preliminary assessment, because the background data may be insufficient to provide a more accurate evaluation to support a categorical statement. Therefore, if the authority decides to reopen the fishery, the capture to be authorized should be based on adults only, with fish older than 7-years-old, where total length ≥ 130 cm and a weight ≥ 25 kg. In these circumstances and by considering the status of the population, is advised the capture of 1,000 adult totoaba by the sport fleet only and for just the first fishing season. These adults should be exploited from 232,000 adult fish in the stock. For subsequent years, new quotas should be determined before opening each fishing season.
Results of this evaluation suggest that the exploitation rate proposed here would go from E = 0.09 in 1933 to more than 0.8 in the decade of 1960-1970. The stock biomass dropped from 23,000 t in 1936 to only 1,500 t in the years 1968-1970. After this period, and with the prohibition of the fishery, there was a gradual recovery of the stock biomass until 2015 when it attained > 36,000 t. These results suggest that, in case that the fishery is open, it should be necessary to make annual assessments of the stock to determine well in advance the effects of the last fishing season. In addition, to be able to assess the number of individuals in the stock before the authorization of the quota for the following season, implementing an adaptive management process of this resource. The fishery might be open annually as a sport-fishing tournament.
Prognosis
The simulation allowed a reconstruction of the stock biomass and the catch over time, which is from 1930 until a projection to the year 2015. Starting with the recruit number, the tendency indicates declining numbers after 1945, from 443,000 to only 223,000 in 1971. After this, an increasing trend is displayed, with a maximum recruit number of > 1,440,000 after 1994 and being maintained afterwards. This has its equivalence in the number of adults, with 335,000 in 1940 and > 637,000 after 2010 (Figure 8).
The stock biomass shows a tendency similar to recruitment, with nearly 123,000 t in 1936 followed by the collapse through 1945 until 1975, when the biomass dropped to below 2,000 t most years, with a low stock (Figure 9). So, the over exploitation driving to the collapse took about thirty years and the stock recovery after closing the fishery took nearly twenty years. Simulation indicates that a recovery of the stock biomass up to 34,000 t in 1990 may occurred, maintaining these values until 2015, the last year of simulation. This means to increase of more than twice the level the population had in 1936, when was recorded the highest catch. The incidental catch and a future projection of it for a few years suggest that it is not significant when compared to the overall stock biomass.
DISCUSSION
The delta of the Colorado River supports one of the most productive artisanal fisheries in Mexico [25]. However, aggressive fishing practices lead to totoaba stock depletion, in addition to other factors, like the loss of Colorado river discharge, reducing growth and increasing the age of maturity [26,27], and the protection instruments have been clearly ineffective [28]. Evidence by Rowell et al. [29] shows dramatic slowed half growth rate and three-year delayed maturation of totoaba after the dam construction reducing the Colorado river flow and loss of habitat, advising an appropriate water flow of the Colorado river to allow recovering the population of the stock [23].
Controversial ideas on the recovery of the totoaba stock have been expressed [30-35], as releases of water across the border in excess of agricultural usage will probably have a positive impact upon endangered species habitat [36]. The delta of the Colorado River is not dead, but it requires international collaboration for its recovery [16].
In recent years, research on different aspects of the totoaba was intensified [35,37-43]. The unexpected catch of two five-foot-long adult totoaba, caught in East Cape, near to San José del Cabo (its maximum adult range previously known extends southward only to about Bahia de Los Angeles on the Baja coast. Kira [44] suggests as a logical explanation to this event, that the totoaba stock recovered after so many years after its fishery was banned, and nowadays a probable irruption of the surplus population extends its range looking for new areas induced by the need of reducing intra specific competition.
Because it is a long-lived species, totoaba is a slow growing species and matures until the age of seven years, attributes that make it a density-dependent population. For this reason, it is very vulnerable to overfishing, but as occurred in other species, it has the potential to recover and nowadays it can withstand new exploitation, which must be well regulated and strictly controlled. As in other species, the stocks may not be as vulnerable to a managed fishing pressure as previously thought, which when are compared to recent increases, may represent a significant recovery compared to the population abundances before depletion [45].
The intention of ranching juveniles from artificial breeding seems to be a futile strategy. With the level of knowledge of its basic requirements and life cycle, no effort to recover the wild stock by releasing cultured animals seems to be feasible with traditional procedures, as has been seen elsewhere [46]. However, places in the upper Gulf where it could be cultivated are suggested [47], ignoring that releasing juveniles in the wild, would expose them to predation, because they have not had the opportunity to receive the imprinting in their original nursery ground. In order to be the most cost effective to achieve the conservation targets, more resources addressed to its protection should be invested [48].
Overfishing has not been solely responsible for the historic exhaustion of the population. The global climate variability and the habitat loss produced by the virtual suspension of the runoff of the Colorado River, caused by the construction of the Hoover and Glenn Canyon Dams in 1930 and 1963 have also contributed to its depletion [13,49]. Despite the consideration that the upper Gulf of California is like an estuary of the Río Colorado [33], it was suggested that the population could never be restored to the highest levels ever achieved in historical records. This was supported by development of a response index addressed to demonstrate the impact of floodwaters on the habitat of Delta endangered species [36]. However, the results of the simulation indicate a much more optimistic perspective and are consistent with the paper by Valenzuela-Quiñonez et al. [35]. Morzaria-Luna et al. [50], found that increasing ecosystem function and structure lead to lower economic performance indicators, and joint efforts have been conducted between US and Mexico addressed to outline conservation priorities [51].
The recommendation of opening the activity as a strictly regulated sport fishery tournament is based on the belief that this is the most likely way to do samplings of the wild stock. In addition, the exploitation would be a way to evaluate and to control the real fish numbers caught from the wild stock, and evaluating the stock biomass, avoiding or at least minimizing illegal catch that is taking place nowadays, which is impossible to evaluate. Strengthening local protection is imperative to the recovery of this or other endangered populations [52], drawing attention to justifiable conservation needs [53].
CONCLUSION
- The collapse of the stock was caused by overfishing, loss of habitat, and climate change.
- So far, there has been no authorized fishery for more than 40 years and the stock seems to be recovered.
- Evidences, like increase of illegal exploitation, smuggling, reduced control of poaching, and casual fishing of adults in the southern Gulf, suggest that the population of totoaba increased significantly.
- Increasing illegal exploitation of totoaba, given the high value of its gall bladder, is a risk of stock depletion that must be controlled
- Based on the former considerations and after the simulation of the stock, it seems evident that there are conditions to restart the capture of totoaba on a small-scale and under conditions of strict control and regulation, until a more accurate assessment is made, based in representative samples.
- If the fishery is reopen and capture is authorized, the more desirable option would be as a sport fishery in first place, as an incentive for attracting foreign currency. If the fishery is open, high fees of the fishing permits should accompany it. This would allow controlling the access to the stock, a regulation of the catch controlled by observers on board, and an accurate evaluation of the fishery.
RECOMMENDATIONS
- Access to the fishery should authorize to sport fishing activity only. This would imply encouraging that part of the commercial fishing fleet should address their activity into sport fishery, ensuring a fair distribution of the potential income.
- The number of permits should not exceed 1,000 (one animal per permit) during the first year.
- After assessing the stock based on data of the first fishing season, a new catch quota should be determined afterwards.
- Establishment of a legal minimum size of 130 cm total length or 25 kg weight.
- The permit fees should be high enough to create a fund to pay the costs of monitoring, with observers on board, and the stock assessment by a competent group.
- Before the beginning of each fishing season, there must be an updated assessment to provide sufficient evidence of the stock size that will serve as a prerequisite for setting the fishing quota for the next season.
- If these recommendations are adopted, conditions for a truly sustainable totoaba fishery will be achieved in socioeconomic terms and under the framework of resource conservation.
ACKNOWLEDGEMENT
Víctor Valdez-Ornelas provided access to data from the incidental catch. An anonymous reviewer read the manuscript and made valuable suggestions. The author holds research fellowships from COFAA and EDI, IPN.
REFERENCES
- Berdegué AJ (1956) La pesquería de la totoaba Cynoscion macdonaldi (Gilbert) en San Felipe, Baja California. Revista de la Sociedad Mexicana de Historia Natural 16: 45-78.
- Cannon R (1966) The sea of Cortez. Lane Magazine and book Co, Menlo Park, California, USA.
- Arvizu J, Chávez H (1972) Sinopsis sobre la biología de la totoaba Cynoscion macdonaldi Gilbert, 1890. FAO Fisheries Synopsis. Pg No: 108.
- Román-Rodríguez MJ, Hammann G (1997) Age and growth of totoaba, Totoaba macdonaldi (Sciaenidae) in the upper Gulf of California. Fishery Bulletin 95: 620-628.
- Pedrín-Osuna O, Córdova-Murueta JH, Delgado-Marchena M (2001) Crecimiento y mortalidad de la totoaba, Totoaba macdonaldi, del alto Golfo de California. SAGARPA. México. Ciencia Pesquera 14: 131-138.
- Cisneros-Mata MA, Montemayor-López G, Román-Rodríguez MJ (1995) Life history and conservation of Totoaba macdonaldi. Conservation Biology 9: 806-814.
- Cisneros-Mata MA, Botsford LW, Quinn JF (1997) Projecting viability of Totoaba macdonaldi, a population with unknown age-dependent variability. Ecological Applications 7: 968-980.
- Barrera-Guevara JC (1990) The conservation of Totoaba macdonaldi (Gilbert), (Pisces: Sciaenidae), in the Gulf of California, Mexico. Journal of Fish Biology 37: 201-202.
- Baillie J, Groombridge B (1996) IUCN red list of threatened animals. IUCN, Gland, Switzerland.
- IUCN (2004) IUCN Red List of Threatened Species. IUCN, Gland, Switzerland.
- Federal Register (1979) Rules and regulations: Totoaba, listing as an endangered Federal Register 44: 29478-29480.
- Phelps-Bondaroff T, Retano N, van der Werf W (2015) The Illegal Fishing and Organized Crime Nexus: Illegal Fishing as Transnational Organized Crime. The Global Initiative against Transnational Organized Crime and the Black Fish. Amsterdam, Netherlands.
- Lercari D, Chávez EA (2007) Possible causes related to historic stock depletion of the totoaba, Totoaba macdonaldi (Perciformes: Sciaenidae), endemic to the Gulf of California. Fisheries Research 86: 136-142.
- Godley BJ (2009) Incorporating climate change into endangered species conservation: Introduction. Endangered Species Research 7: 85-86.
- Salvadeo CJ, Lluch-Belda D, Gomez-Gallardo A, Urbán-Ramírez J, MacLeod CD (2010) Climate change and a poleward shift in the distribution of the Pacific white-sided dolphin in the northeastern Pacific. Endangered Species Research 11: 13-19.
- Flessa K, Dettman WDL, Schöne BR, Goodwin DH, Rodriguez CA, et al. (2001) Antes de las presas: Historia ecológica sobre el delta del Río Colorado, Méx Simposio México - Estados Unidos Sobre el Delta del Río Colorado, La Comisión International de Límites y Aguas entre México y los Estados Unidos (CILA). Mexicali, Baja California, México.
- Buisman R (2016) Mexican porpoise facing extinction due to illegal fishing. Environmental Investigation Agency, London, UK.
- Mijarez L (2017) Mexican Totoaba Fish near Extinction -Bladder with Aphrodisiac Properties worth More Than Cocaine. Latin Post Report, New York.
- Chávez EA (2005) FISMO: A generalized fisheries simulation model. In: Kruse GH, Gallucci VF, Hay DE, Perry RI, Peterman RM, Shirley TC, Spencer PD, Wilson B, Woodby D (eds.). Fisheries assessment and management in data-limited situations. Alaska Sea Grant College Program, University of Alaska Fairbanks. Pg No: 659-681.
- Chávez EA (2014) Un modelo numérico para la administración sustentable de laspesquería CICIMAR Oceánides 29: 45-56.
- Beverton RJ, Holt SJ (1957) On the dynamics of exploited fish populations. UK Ministry of Agriculture Fisheries Investigations, Basel, Switzerland. Pg No: 533.
- Pedrín-Osuna O, Alemán L (1998) Atlas pesquero de la fauna de acompañamiento de camarón del alto Golfo de California. Instituto Nacional de la Pesca. CRIP Ensenada, México.
- Rowell K, True C, Flessa KW, Dettman DFL (2008) Fish without water: Validation and application of δ18O in Totoaba macdonaldi Ciencias Marinas 34: 55-68.
- Froese R, Pauly D (2014) Fish Base. Stockholm, Sweden.
- Erisman B, Aburto-Oropeza O, González-Abraham C, Mascareñas-Osorio I, Moreno-Báez M, et al. (2012) Spatio-temporal dynamics of a fish spawning aggregation and its fishery in the Gulf of California. Scientific Reports 2: 1-11.
- Marsh J, Fox M (2007) Gulf of California Seafood Report. Southwest Region. Seafood Watch; Monterey Bay Aquarium.
- Rowell K, Dettman DL (2010) How has over allocating the Colorado River Affected Species in the Gulf of California? Proc. Colorado River Basin Science and Resource Management Symposium. USGS, Scottsdale, Arizona.
- Bobadilla M, Alvarez-Borrego S, Avila-Foucat S, Lara-Valencia F, Espejel I (2011) Evolution of environmental policy instruments implemented for the protection of totoaba and the vaquita porpoise in the Upper Gulf of California. Environmental Science and Policy 14: 998-1007.
- Rowell KK, Flessa W, Dettman DFL, Roman MJ (2008) Diverting the Colorado River leads to a dramatic life history shift in an endangered marine fish. Biological Conservation 141: 1138-1148.
- Roberts CM, Hawkins JP (1999) Extinction risk in the sea. Tree 14: 241-246.
- Sadovy Y, Cheung WL (2003) Near extinction of a highly fecund fish: The one that nearly got away. Fish and Fisheries 4: 86-99.
- Lozano-Montes H, Pitcher TJ, Haggan N (2008) Shifting environmental and cognitive baselines in the upper Gulf of California. Frontiers on Ecology and Environment 6: 75-80.
- Valdez-Muñoz C, Aragón-Noriega EA, Ortega-Rubio A, Salinas-Zavala CA, Arreola-Lizárraga JA, et al. (2010) Distribution and abundance of juveniles from Totoaba, Totoaba Macdonaldi, and the salinity of the breeding habitat. Interciencia 35: 136-139.
- Valenzuela-Quiñones F, García de León FJ, de Anda-Montañez JA, Balart E (2011) La totoaba del Golfo de California ¿una especie en peligro de extinción? Interciencia 36: 664-671.
- Valenzuela-Quiñones F, Arreguín-Sánchez F, Salas-Márquez S, García de León FJ, Garza JC, et al. (2015) Critically endangered totoaba Totoaba macdonaldi: Signs of recovery and potential threats after a population collapse. Endangered Species Research 29: 1-11.
- All JD, Yool R (2004) Indexing endangered species risk in the colorado river delta, Mexico using AVHRR NDVI time series data. Geocarto International 19: 5-13.
- García-de-León FJ, Valles-Jimenez R, Shaw K, Ward R, de Anda-Montañez JA, et al. (2010) Characterization of fourteen microsatellite loci in the endemic and threatened totoaba (Totoaba macdonaldi) from the Gulf of California. Conservation of Genetical Resources 2: 219-221.
- Espinoza-Tenorio A, Espejel I, Wolff M (2011) Capacity building to achieve sustainable fisheries management in Mexico. Ocean and Coastal Management 54: 731-741.
- Minjarez-Osorio C, González-Félix M, Perez-Velázquez M (2012) Biological performance of Totoaba macdonaldi in response to dietary protein level. Aquaculture 362-363: 50-54.
- Rueda-López S, Lazo JP, Correa-Reyes G, Viana MT (2011) Effect of dietary protein and energy levels on growth, survival and body composition of juvenile Totoaba macdonaldi. Aquaculture 319: 385-390.
- Díaz-Viloria N, Sánchez-Velazco L, Pérez-Enriquez R, Jiménez-Rosenberg SPA (2013) Molecular identification and morphological description of totoaba Totoaba macdonaldi and curvina Cynoscionreticulatuspreflexion larvae (Perciformes Sciaenidae). Ichthyol Res 60: 390-395.
- Galaviz MA, López LM, True CD, Sandoval G, García-Gasca A, et al. (2013) Expression and activity of three digestive proteases in larvae of the totoaba (Totoaba macdonaldi). Larvi ´13-Fish and Shellfish Larviculture Symposium. European Aquaculture Society, Public university in Ghent, Belgium.
- Valenzuela-Quiñones F, de Anda-Montañez JA, Gilbert-Horvath E, Garza JC, García de León FJ (2016) Panmixia in a critically endangered fish: The totoaba (Totoaba macdonaldi) in the Gulf of California. J Hered 107: 496-503.
- Kira G (2004) Northern Cortez fish discovered hundreds of miles out of its known range. Western Outdoor News.
- McClenachan L (2009) Historical declines of goliath grouper populations in South Florida, USA. Endangered Species Research 7: 175-181.
- Rasmussen JE, Belk MC, Peck SL (2009) Endangered species augmentation: A case study of alternative rearing methods. Endangered Species Research 8: 225-232.
- Reyes-Bonilla H, Précoma-de-la-Mora M, Calderón-Aguilera LE (2016) ¿Dónde reintroducir la totoaba en el Golfo de California? Sudcaliforniano en la Ciencia 7.
- Fairburn GA, Hughey KFD, Cullen R (2004) Cost effectiveness of endangered species management: the kokako (Callaeascinerea) in New Zealand. New Zealand Journal of Ecology 28: 83-91.
- Kellogg B (2004) The dam controversy: Does the Endangered Species act apply internationally to protect foreign species harmed by dams on the Colorado River? Journal of Transnational Law and Policy 13: 447-474.
- Morzaria-Luna HN, Ainsworth CH, Kaplan IC, Levin PS, Fulton EA (2013) Indirect effects of conservation policies on the coupled human-natural ecosystem of the upper gulf of california. PLos One 8: 64085.
- Liss-Lymer B, Carvajal M (2016) Appendix A3F. Colorado River, its Delta and links to the Gulf of California. In: Tengberg AA (ed.). A Conceptual Framework for Governing and Managing Key Flows in a Source-to-Sea Continuum. Research Gate Technical Report. Pg No: 81-85.
- López-Castro MC, Koch V, Mariscal-Loza A, Nichols WC (2010) Long-term monitoring of black turtles Chelonia mydas at coastal foraging areas off the Baja California Peninsula. Endangered Species Research 11: 35-45.
- Freeman MMR (2008) Challenges of assessing cetacean population recovery and conservation status. Endangered Species Research 6: 173-184.
Citation: Chávez EA (2019) Simulation-Based Reconstruction for Totoaba (Totoaba macdonaldi [Gilbert, 1890]; Perciformes, Sciaenidae) Stock: Recovery Scenario and Management Implications. J Aquac Fisheries 3: 022.
Copyright: © 2019 Ernesto A Chávez, et al. This is an open-access article distributed under the terms of the Creative Commons Attribution License, which permits unrestricted use, distribution, and reproduction in any medium, provided the original author and source are credited.