Small-Scale Fisheries Production and Rural Livelihoods: A Case of Lake Mutirikwi (Lake Kyle), Zimbabwe
*Corresponding Author(s):
Wilson MhlangaDepartment Of Environmental Science, Bindura University Of Science Education, Bindura, Zimbabwe
Tel:+263 772236104,
Email:wmhlanga63@gmail.com
Abstract
This study was conducted on Lake Mutirikwi, Zimbabwe, to determine the annual fish production and the role of small-scale fisheries in rural livelihoods. Fish production data (catch and effort) were obtained from fishers’ records. Information on fishers’ demographics and livelihoods was obtained through a questionnaire survey. A total of 30 fishers were interviewed.
The annual fish production in 2011 and 2012 was estimated at 37.8 metric tons and 43.1 metric tons, respectively. The economic value of the annual fish landings was estimated at US$ 89 600 and US$ 98 800 in 2011 and 2012, respectively. Fishers were predominantly male (97%). There were both full-time (60%) and part-time fishers (40%). Part-time fishers were also engaged in other non-fishing income-generating activities. The major reasons cited for engaging in fishing were income-generation and to ensure household food security. Fishers faced both marketing and non-marketing problems.
The study showed that small-scale gill-net fishing plays an important role in rural livelihoods. Similar studies should be carried out on other water bodies in Zimbabwe as they are likely to have very different characteristics from those observed in this study.
INTRODUCTION
The fisheries sector is very important at the global, continental and, national level. In 2016, global capture fish production was estimated at 90.9 million tons which was made up of 12.2% from inland fisheries and 87.2% from marine fisheries [1].
In terms of income and livelihoods, it was estimated that approximately 40.3 million people were involved in capture fisheries [1]. Suuronen and Bartley [2], observed that inland fisheries are an important source of food and livelihood. At the individual level, inland fisheries are important for food security, economic security and empowerment [3]. However, the role of inland fisheries in livelihoods, food security and sustainable development is often overshadowed by the higher profile interest in marine issues [4].
In Africa, the value of inland fishing was estimated at US$ 4,676 billion [5]. It was estimated that almost 2 million people were employed in inland fisheries [5].
In most societies small scale fishers suffer the greatest deprivations as they have low social status, low income and poor living conditions [6]. People often turn to natural resources when other livelihood options are limited and fisheries can act as a safety net for the poor [7]. FAO [8], reported that 5.8 million small scale fishers earn less than US$ 1 a day.
In a review of the literature, it was observed that there was a perception that “fisheries rhyme with poverty [9]”. The conclusion was that “in the case of fisheries, it was important to realize that the different socio-institutional mechanisms that govern the command of the fishery resources (namely, the social positions and the institutional arrangements controlling access to, and use of these resources) played a more critical role in determining poverty or wealth, than economic or biological factors [9]”.
It has been noted that there is an urgent need to correct the simplistic and ill-conceived views that present poverty in fisheries as a consequence of the tragedy of the commons [10]. Some researchers have argued that there is a need to re-establish a more comprehensive understanding of the dynamics of poverty in small- scale fisheries [10].
Smith et al [11], reviewed the fisher household characteristics and objectives as well as the livelihood functions of fishing. They observed that while there was a lot of literature supporting the notion of fishing as an activity of last resort pursued by the poor and marginalized, there is also abundant evidence from literature that contradicts this view. From these observations, they concluded that “firstly, fishing can be an activity of households who, if not wealthy in absolute monetary terms, certainly have incomes and living standards above those of the poorest groups within the same region, and secondly that fishing may be pursued for a range of livelihood objectives beyond those of bare subsistence”.
Based on their recognition of the diverse functions that fishing can perform in the livelihoods of rural households, Smith et al [11], came up with a typology of these functions as shown in table 1 below.
|
Livelihood Strategy |
Livelihood functions of fishing |
|
Survival (fishing as sole activity) |
· Subsistence (food production and income). |
|
Semi-subsistence diversification (fishing is one of a range of activities e.g. farming) |
· Own consumption (food security and nutrition). · Complementarities in labour use with farming. · Means of barter, or for participation in reciprocal exchange and social networks. · Occasional cash source. · Diversification for labour and consumption · Smoothing: Risk reduction as a safety net/buffering against risk. |
|
Specialisation (fishing as a sole activity but a lot more resources are invested to ensure maximum returns possible) |
· Market production and income · Accumulation |
|
Diversification for accumulation (fishing is one activity in a portfolio of activities that produce surplus to subsistence requirements. |
· Accumulation · Recreation |
Table 1: Livelihood functions of fishing as household incomes rise and livelihood strategies develop. Source: Smith et al [11].
As a landlocked country, Zimbabwe only has inland fishery resources. There are several small-scale fisheries on man-made lakes such as Kariba, Mutirikwi, Chivero, Manyame, Sebakwe, and Osborne. However, the full potential of the country’s water bodies to support artisanal/small-scale fisheries has still not been realized. According to the FAO [12], artisanal fisheries can be defined as “traditional fisheries involving fishing households (as opposed to commercial companies), using relatively small amount of capital and energy, relatively small fishing vessels (if any), making short fishing trips, close to shore, mainly for local consumption”. It is acknowledged that the definition of artisanal fisheries may vary from country to country. Artisanal fisheries, which are sometimes referred to as small-scale fisheries, can be subsistence or commercial fisheries, providing local consumption or export [12].
Lake Mutirikwi (formerly Lake Kyle) is one of the water bodies that have a regulated small-scale fishery. This fishery is important in supporting the livelihoods of the fishers on the lake. However, since information on the role of this fishery in contributing to livelihoods is not readily available, this study aimed at filling this gap.
Thus, the aim of the study was to determine the annual fish production and economic value of the fishery as well as some socio-economic characteristics of the fishers on Lake Mutirikwi, particularly with respect to household income and livelihoods.
METHODS AND MATERIALS
Figure 1 shows the location of the study area. Lake Mutirikwi is an artificial impoundment in Masvingo District and was built in 1960. Prior to the construction of the Tugwi Mukosi (Tokwe-Murkosi) dam, Lake Mutirikwi, formerly known as Lake Kyle, was the second largest lake in Zimbabwe after Kariba. It lies in south eastern Zimbabwe, south of Masvingo city. It lies between Latitude 20°15'S and Longitude 31°1'E. The major rivers that flow into the lake are Mbebvi, Matare, Pokoteke, Umpopinyani, Makurumidzi and Mushagashe.
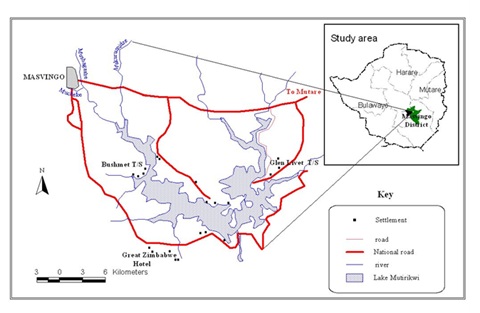
Figure 1: Map of Lake Mutirikwi.
The dam was built to provide irrigation water to the farming estates on the Lowveld around Triangle and Chiredzi, where the main crop is sugar cane. The lake also supplies water to the city of Masvingo (formerly Fort Victoria). The creation of the lake gave rise to several secondary activities, including commercial gill-net fishing and recreational angling.
The fishery resources on the lake are managed by the Zimbabwe Parks and Wildlife Management Authority (ZPWMA). Entry into the gill-net fishery is through a licensing system administered by ZPWMA. In order to regulate fishing effort, the fishing licences stipulate the maximum number of nets to be used as well as a minimum stretched mesh size of 76mm. All the licensed fishers use multifilament gill-nets which are top-set. The fishers also use non-motorised fibreglass boats.
The licensed fishers operate as fishing co-operatives. During the time of the study, there were 6 cooperatives. Each cooperative had 12 members; hence, there were 72 licensed fishers.
DATA COLLECTION AND COLLATION
Primary and secondary data were used in this study. The primary data on demographics and livelihoods were collected through questionnaires. A total of 30 fishers were interviewed from 5 of the co-operatives (8 from Co-operative 1, 5 from Co-operative 2, 5 from Co-operative 3, 9 from Co-operative 4 and 3 from Co-operative 5). Microsoft Access was used for data capture and collation.
Secondary data on annual catch, effort and catch per unit effort were obtained from the fishers’ monthly catch and effort records. Microsoft Excel was used for data capture and collation.
ETHICAL CONSIDERATIONS
For the questionnaire survey, consent was sought from interviewees to participate in the study. The identity of individual participants was not a requirement so as to ensure confidentiality.
RESULTS
Table 2 shows the monthly catch, effort, and catch per unit effort in 2011 and 2012.
|
Month |
|
Jan |
Feb |
Mar |
Apr |
May |
Jun |
Jul |
Aug |
Sep |
Oct |
Nov |
Dec |
Mean |
|
Catch (x 1000kg) |
2011 2012 |
3,07 3.53 |
1,53 2.26 |
1,01 4.06 |
1,14 2.58 |
3,04 2.57 |
3,87 2.64 |
0,723 0.929 |
3,56 4.31 |
5,392 5.34 |
5,582 5.24 |
5,09 4.17 |
3.842 3.85 |
3.153 3.46 |
|
Effort (x 1000m) |
2011 2012 |
56,7 135.6 |
78,6 173.8 |
67,2 192.5 |
58,4 156 |
66,8 147 |
86,8 157.8 |
41.2 60 |
100,8 171.6 |
128,35 159.9 |
139 238.2 |
71,8 277.2 |
167 172.5 |
119,521 170.175 |
|
CPUE (kg/100m) |
2011 2012 |
5.4 2.6 |
1.9 1.3 |
1.5 2.1 |
1.9 1.7 |
4.6 1.7 |
4.5 1.7 |
1.8 1.5 |
3.5 2.5 |
4.2 3.3 |
4.0 2.2 |
7.1 1.5 |
2.3 2.2 |
2.6 2.0 |
Table 2: Monthly catch, effort, and catch per unit effort in 2011 and 2012.
The Bream species were sold at US$ 2.50/kg, while Catfish and Bottlenose were sold at US$ 2.00/kg. In 2011, the highest monthly catch and effort was in October, while the lowest monthly catch and effort was in July. The highest monthly cpue was in November, while the lowest was in March. In 2012, the highest monthly catch was in September, while the lowest was in July. The lowest monthly fishing effort was in July, while the highest effort was in November. Monthly cpue was highest in September and lowest in February. July is the coolest month, while October is the warmest month (https://weather-and-climate.com). In both years, monthly fishing effort was lowest during the coolest month (July). Fishers deliberately reduced their fishing effort in July, as they reported that catches were lowest during this month. Although the monthly fishing effort was generally higher in 2012 than in 2011, the monthly cpue was generally lower in 2012 compared to 2011.
The annual fish landings (production) and estimated economic value of the fishery in 2011 and 2012 are shown in tables 3 and 4, respectively.
|
Species/Group |
Catch (tons) |
Value (US$) |
|
Breams* (Oreochromis, Tilapia & Serranochromis) |
28 |
70 000 |
|
Catfish (C.gariepinus) |
4.1 |
8 200 |
|
Bottlenose (M.longirostris) |
5.7 |
11 400 |
|
Total |
37.8 |
89 600 |
Table 3: Annual fish production and estimated economic value of Lake Mutirikwi fishery in 2011.
Note: *The Bream species included O.mossambicus, Tilapia rendalli and Serranochromis robustus.
|
Species/Group |
Catch (tons) |
Value (US$) |
|
Breams (Oreochromis, Tilapia & Serranochromis) |
32 |
80 000 |
|
Catfish (Clarius gariepinus) |
3.7 |
7 400 |
|
Bottlenose (Mormyrus longirostris) |
5.7 |
11 400 |
|
Total |
41.3 |
98 800 |
Table 4: Annual fish production and estimated economic value of Lake Mutirikwi fishery in 2012.
Most of the fishers were men (97%), with women constituting a very small minority (3%). The marital status of the fishers was as follows: 67% were married, 28% were single, 3% were divorced and 3% were widowed.
The percentages of respondents in the various age groups are shown in table 5.
|
Age Group (years) |
Below 20 |
21-30 |
31-40 |
41-50 |
Above 50 |
|
% |
10 |
27 |
30 |
20 |
13 |
Table 5: Age groups of the respondents.
The respondents’ fishing experience is shown in table 6.
|
No. of years |
% of respondents |
|
0-3 |
70 |
|
4-10 |
23 |
|
Above 10 |
7 |
Table 6: Fishing experience of respondents.
There were only two fishers who had more than 10 years’ experience and these could be regarded as veterans since they had 27 and 38 years of fishing experience.
The majority of households (73%) had between 4 to 7 family members. There were a few households that had 1 to 3 members (17%) and only 10% of the households had between 8 to 10 members. Within each household, the number of dependents ranged from 1 to 5. This was because within a given household, there were other family members who were economically active. The dependents were defined as those who relied solely on the respondent (fisher) for their livelihood.
Full-time fishers constituted 40% of the respondents, while the rest (60%) were part-time fishers who were also engaged in other activities to supplement the income from fishing.
Table 7 shows the percentage of respondents whose mean monthly income from fishing falls in 3 categories.
|
Income Range (US$) |
150 and Less |
151-300 |
More than 300 |
|
% of respondents |
59 |
38 |
3 |
Table 7: Categories of respondents’ monthly income from fishing.
Note: In 2011, the gazetted minimum wage in the Agricultural sector ranged from USD 55 (Grade A1) to USD 109.95 (Grade C2). (Source: Mywage.org/Zimbabwe).
The categories of respondents’ income from non-fishing activities are shown in table 8.
|
Income Range (US$) |
150 and Less |
151-300 |
More than 300 |
|
% of respondents |
50 |
39 |
11 |
Table 8: Categories of respondents’ monthly income from non-fishing activities (n=18).
The part-time fishers were engaged in other non-fishing economic activities. These non-fishing activities included part-time jobs within the villages, such as building someone’s house, repairing nets and boats, farming, or formal jobs. Apart from formal jobs that have a stipulated salary, payment for the other services was not fixed but was negotiated and agreed upon beforehand. The full-time fishers who relied solely on fishing as their income source indicated that they had no time to engage in other income-generating activities.
Fishers on Lake Mutirikwi fish all year round. They fish 4 to 5 days a week and hence do not fish during weekends and on public holidays.
At least 50% of the fishers indicated that they wanted their children to take up fishing while the other 50% did not want their children to engage in fishing as a livelihood. Those who did not want their children to take up fishing cited several reasons that included the hard work involved (as the majority of fishers use non-motorised boats and they set and lift their gill-nets manually), high risk, and low economic returns. Some of the fishers indicated that they would want their children to take up professions that are more rewarding with a higher standard of living than theirs. Other fishers indicated that they would want to quit the profession, but were forced to continue fishing due to a lack of alternative livelihood options, including formal employment.
More than half of the respondents reported that their monthly income from fishing was less than US$ 150 (and this ranged from US$ 40 to US$ 150). About 27% of the fishers had a monthly income from fishing that was within the same range as that of farm labourers. About 67% of the fishers had a monthly income that was higher than that of the highest paid farm labourer (Grade C2).
For the part-time fishers, approximately 50% indicated that monthly income from non-fishing activities was not more than US$ 150, while the other 50% had a monthly income from non-fishing activities that was more than US$ 150.
The fishers highlighted several problems that they faced. They reported that the marked drawdowns (abstractions) in order to supply water to the Lowveld farms, such as the sugar-cane estates downstream, lead to reduced catches. The fishers noted that when lake levels are very low, some of the fish breeding sites are exposed, particularly for the nest-building cichlids and the remaining littoral areas under water may be rocky and hence unsuitable for breeding (nest-building). This situation is compounded in drought years when inflows from the lake’s catchment are also reduced. For example, in October 2012, the lake was 15% full (www.herald.co.zw) and in September 2016, the lake was 12.6% full (www.tellzim.com).
Fishers also experience low catches in winter. Hippopotamus (Hippopotamus amphibious) also poses a risk to the fishers. Fishers reported that wounded Hippos were a particular threat to them as they attacked fishing boats.
The fishers do not have access to capital to enable them to buy fishing equipment such as boats, outboard engines, nets, and life-jackets. Unlicensed/illegal fishers (poachers) undermine the fishers’ viability, since the poachers can sell their fish at a lower price. The lack of refrigeration facilities is a major limitation to the fishers’ viability as this means that they have to ensure that all the fresh fish are sold before they go bad. While fishers sometimes dry their fish, the dried fish have a higher price than fresh fish, and consequently, the demand for dried fish is low.
DISCUSSION
There was considerable intra-annual variability in fish catches and cpue in both years. Other studies have also observed variations intra-annual variability of the catches [13] and cpue [14]. The mean cpue observed in both years in this study was higher than that reported by Nyikahadzoi et al. [15] on the Zimbabwean side of Lake Kariba (1.29kg/100m), as well as that reported by Mbewe et al [16], on the Zambian side of Lake Kariba (0.09-0.31kg/100m). There were fewer fishers on Lake Mutirikwi compared to Lake Kariba and this is likely to have contributed to the higher cpue. Since Lake Kariba is an oligotrophic lake, this is likely to also contribute to reduced productivity in Kariba.
The annual catches observed in 2011 and 2012 were higher than those previously reported for the same lake. Previous reports indicated that annual catches from the lake varied from 14 to 20 tons [17]. This difference in catches is likely to have been due to temporal variations.
In terms of the gross annual value of the catches, the estimates were approximately US$ 90 000 in 2011 and US$ 99 000 in 2012. The values are denominated in US dollars because in 2009, Zimbabwe adopted a multi-currency system following the suspension of the Zimbabwe dollar, which was due to a very high hyperinflationary economic environment.
The fishery on Lake Mutirikwi is male-dominated. Similar trends (of male-dominated capture fisheries) have been observed at the global level [18] at the continental level, in Africa [5] as well as in Lake Kariba [19]. The majority of fishers (77%) were aged between 21 and 50 years. Approximately 33% of the fishers were above 40 years of age. This is in contrast to the observation on the Zambian side of Lake Kariba, where 15.7% of the artisanal fishers were above 40 years of age [20].
The majority of the fishers (93%) had fishing experience that ranged from 1 to 10 years. The fishers have not been in the fishery for a very long period. In the artisanal fishery on Lake Kariba, 56% of the artisanal fishers on the Zambian side also had less than 10 years of fishing experience [20]. From the figures obtained in this study, it appears that during the period of the study, there was a high turnover of fishers in the Lake Mutirikwi fishery.
The average household size observed in this study was similar to that observed on the Zambian side of Lake Kariba [20].
There were more part-time fishers than full-time fishers on Lake Mutirikwi. This is in contrast to the gill-net fishers on the Zimbabwean side of Lake Kariba, where the majority of the fishers were full-time fishers who spent over nine months of the year fishing [19]. Fewer alternative employment options are available for fishers on Lake Kariba since most of them reside in fishing villages that are far from non-fishing settlements.
At the time of this study, a substantial number of the fishers on Lake Mutirikwi had a monthly income that was higher than that of the average farm labourer. These findings indicate that in this particular case study, some of the fishers could not be classified as living in poverty. Governance arrangements, which include a licensing (permit) system as well as fishing effort regulation, play an important role in ensuring that fishers get a reasonable income from fishing. It has also been noted that institutional arrangements controlling access to and use of resources play a critical role in determining poverty or wealth [9].
With respect to the livelihood functions of fishing outlined by Smith et al [11], the individual fishers fall into different categories, namely “Survival”, “Semi-subsistence diversification” and “Diversification for accumulation”.
About 50% of the fishers preferred that their children take up non-fishing livelihood activities. In a study in a Brazil, most of the fishers reported they preferred their children to be well educated and choose an alternative life [21]. Similar observations were made in a study of the Turkish fishery in the southern Aegean Sea, most of the fisherwomen did not want their children to do the same work [22].
The conflict between fishers and hippopotamus in Lake Mutirikwi is similar to observations made in Malawi by Mkanda [23], who noted that areas with large hippopotamus populations were also important for agriculture and fisheries. Conflicts between fishers and hippopotamus were also reported on Lake Kariba [24].
Lack of access to capital was a problem faced by fishers on Lake Mutirikwi. A study of fishers in Uganda and Gambia also noted that fishers faced difficulties in accessing formal external finance [25]. These observations are in contrast to the fishers in Kisumu area of Lake Victoria who had access to credit [26].
Fishers on Lake Mutirikwi did not have access to refrigeration facilities hence they had to sell all the fresh fish. A study of artisanal fishers in Zambia also noted that due to a lack of refrigeration facilities, fishers had to sell fresh fish in order to avoid spoilage [27]. Similar observations were made on Lake Victoria where due to limited access to refrigeration fishers sold their fish as soon as they returned from fishing to prevent fish from going bad [28].
CONCLUSION
The fishery on Lake Mutirikwi is important at both the national and household levels. At the national level, annual production from the fishery contributes to the overall national fish production, particularly from capture fisheries. At the household level, the fishery provides an important livelihood option for both the full-time and part-time fishers. Lake Mutirikwi fishery is also important with respect to employment creation and income generation for fishing households. Although the fishers face several marketing and non-marketing problems, most of these problems can be resolved through the support of the relevant state and non-state actors.
ACKNOWLEDGEMENTS
We acknowledge the fishers who agreed to participate in this study for without them, this study would not have been possible. We are grateful to Sandra Zenda, Sallymah Manika, Obert Runeta, Alfred Gotosa, Abigail Mutandwa and Solomon Matavire for their assistance during data collection. We also thank the Zimbabwe Parks and Wildlife Management for facilitating this study at Lake Mutirikwi Recreational Park.
DECLARATION OF CONFLICTS OF INTEREST
There were no conflicts of interest. No external funding was received during this study.
REFERENCES
- FAO (2018)The state of world fisheries and aquaculture. Meeting the Sustainable Development Goals. Rome. Pg no: 210.
- Suuronen P, Bartley DM (2014) Challenges in managing inland fisheries - using the ecosystem approach Boreal Env. Res 19: 245-255.
- Lynch AJ, Cooke SJ, Deines AM, Bower SD, Bunnell DB, et al. (2016) The social, economic, and environmental importance of inland fish and fisheries. Environmental Reviews, 24: 115-121.
- Funge?Smith S, Bennett A (2019) A fresh look at inland fisheries and their role in food security and livelihoods. Fish and Fisheries20: 1176-1195.
- de Graaf G, Garibaldi L (2014) The value of African fisheries. FAO Fisheries and Aquaculture Circular, Rome, FAO. Pg no: 76.
- Pomeroy RS, Williams MJ (1994) Fisheries Co-management and Small-scale Fisheries: A Policy Brief. Pg no: 15.
- FAO (2009) Report of the Global Conference on Small-scale Fisheries: Securing sustainable small-scale fisheries: Bringing together responsible fisheries and social development. Fisheries and Aquaculture Report, Rome. Pg no: 189.
- FAO (2012) The state of world fisheries and aquaculture. FAO. Rome. Pg no: 147.
- Béné C (2003) When fishery rhymes with poverty: A first step beyond the old paradigm on poverty in small-scale fisheries. World Development 31: 949-975.
- Béné C, Friend RM (2011) Poverty in small-scale fisheries: Old issue, new analysis. Progress in Development Studies 11: 119-144.
- Smith LED, Khoa SN, Lorenzen K (2005) Livelihood functions of inland fisheries: Policy implications in developing countries. Water Policy 7: 359-383.
- FAO (1999) Guidelines for the routine collection of capture fishery data. FAO Fisheries Technical Paper, Rome, Pg no: 113.
- Cowx IG (2008) Management and ecology of river fisheries. John Wiley & Sons. Pg no: 237.
- Horta S, Defeo O (2012) The spatial dynamics of the whitemouth croaker artisanal fishery in Uruguay and interdependencies with the industrial fleet. Fisheries Research125: 121-128.
- Nyikahadzoi K, Mhlanga W, Madzudzo E, Tendaupenyu I, Silwimba E (2017) Dynamics of transboundary governance and management of small scale fisheries on Lake Kariba: implications for sustainable use. International Journal of Environmental Studies.
- Mbewe M, Mweemba C, Habulembe I (2011) Catch Assessment Survey for Kariba, Kafue and Itezhi-tezhi - 2011. Department of Fisheries. Chilanga. Zambia. Pg no: 14.
- FAO (2007) Fishery country profile. Republic of Zimbabwe. FID/CP/ZIM.
- FAO (2016) The State of World Fisheries and Aquaculture 2016. Contributing to food security and nutrition for all. Pg no: 200.
- Frame Survey (2011) Zimbabwe Lake Kariba Fisheries Frame Survey. Pg no: 38.
- Mbewe M, Mweemba C, Habulembe I, Silwimba E (2011) Lake kariba fishery frame survey report. (Draft). Department of Fisheries. Chilanga. Zambia. Pg no: 50.
- Santos AN (2015) Fisheries as a way of life: gendered livelihoods, identities and perspectives of artisanal fisheries in eastern Brazil. Marine Policy.62: 279-288.
- Göncüo?lu H, Ünal V (2011) Fisherwomen in the Turkish fishery, southern Aegean Sea. Journal of Applied Ichthyology, 27: 1013-1018.
- Mkanda FX (1994) Conflicts between hippopotamus (Hippopotamus amphibius (L.)) and man in Malawi. African Journal of Ecology 32: 75-79.
- Ndhlovu N, Saito O, Djalante R, Yagi N (2017) Assessing the sensitivity of small-scale fishery groups to climate change in Lake Kariba, Zimbabwe. Sustainability 9:
- Jaabi SA (2014) Enterprise finance and economic development: A study of the fishing industry in Uganda and the Gambia.Doctoral dissertation, University of Malaya. Pg no: 323.
- Nyang’aya ROA, Onyango OJ (2016) Accessing credit finance by artisanal fishermen: The case of lake victoria in kisumu, Kenya. International Journal of Science and Research 5: 702-709.
- Lungu A, Hüsken SMC (2010) Assessment of access to health services and vulnerabilities of female fish traders in the Kafue Flats, Zambia: Analysis report. World Fish.
- Mojola SA (2011) Fishing in dangerous waters: Ecology, gender and economy in HIV risk. Social science & medicine72: 149-156.
Citation: Rashidi M, Mhlanga W, Tiki M, Svosvai C (2020) Small-Scale Fisheries Production and Rural Livelihoods: A Case of Lake Mutirikwi (Lake Kyle), Zimbabwe. J Aquac Fisheries 4: 030.
Copyright: © 2020 Molline Rashidi, et al. This is an open-access article distributed under the terms of the Creative Commons Attribution License, which permits unrestricted use, distribution, and reproduction in any medium, provided the original author and source are credited.