Survival of Encapsulated Vs. Free Probiotics in Fruit Juices During Refrigerated Storage and In Vitro Gastrointestinal Digestion
*Corresponding Author(s):
Said AjlouniSchool Of Agriculture And Food, Ecosystem Sciences, Faculty Of Science, The University Of Melbourne, Victoria 3010, Australia
Email:said@unimelb.edu.au
Abstract
This study investigated the viability and resilience of free and encapsulated probiotic bacteria (Lactobacillus plantarum and Lactobacillus casei) in commercial apple and tomato juices during refrigerated storage and simulated gastrointestinal digestion. Individual probiotic species were encapsulated via freeze-drying and added to apple and tomato juices at 1% concentration. Samples were then stored refrigerated at 4°C for 28 days and analyzed for Lactic Acid Bacteria (LAB) counts, physicochemical properties (colour, pH, titratable acidity, total phenols) on days 1, 14, and 28, and in-vitro digestion and colonic fermentation were performed on days 1 and 21. Results showed the potential of encapsulation to enhance probiotic viability during storage and digestion compared to free probiotics. L. plantarum exhibited superior acid and bile tolerance than L. casei. Prolonged storage in acidic conditions led to a gradual decrease in LAB counts with noticeable variability in physicochemical properties. Total phenols also fluctuated due to microbial utilization, enzymatic degradation and pigment oxidation. Despite the consistently low pH, apple and tomato juices enriched with encapsulated probiotics could be applied effectively as a probiotic carrier matrix for up to 14 days of refrigerated storage. Thus, offering an alternative to traditional dairy-based carriers.
Introduction
Etymologically, the word “Probiotic” is derived from the Latin prepositions – “pro” and “biotic”, which means “for bios/life” [1]. It refers to living microorganisms, primarily bacteria and yeasts, that offer health benefits to the host when consumed in adequate amounts [2]. According to recent estimates, the worldwide market for probiotics was valued at USD 68.56 billion in 2022. It is projected to grow at a Compound Annual Growth Rate (CAGR) of 8.7% during the forecast period of 2021 to 2030 and is anticipated to reach approximately USD 133.92 billion by the end of 2030 [3]. These figures underscore the increasing importance of probiotics as a global market and the potential for significant growth in the coming years.
The Food and Agriculture Organization of the United Nations (FAO) and the World Health Organization (WHO) have emphasized that effective health benefits of probiotics demand maintaining their integrity in the digestive tract, regardless of the mode of delivery [2]. It has been reported that the survival rate of free probiotics during digestion is highly compromised. Therefore, their encapsulation is crucial to protect and improve their survival rate [4]. Various probiotic encapsulation techniques, including freeze-drying, spray-drying, spray-chilling, extrusion, ionic gelation, emulsification, coacervation, fluidized-bed coating, and co-encapsulation, have been researched for decades. However, freeze-drying is usually the preferred method for bacteria encapsulation due to the absence of heat treatment. [5]. explained that freeze-drying involves removing the water vapour from a frozen sample through ice sublimation. It preserves thermosensitive components, such as probiotics, and results in capsules of 1-1.5mm. Additionally, freeze drying offers higher convenience, longer shelf-life, better stability and protection against oxidation and degradation, and improves solubility and retention of probiotics bioactivity [5-8]. However, the high cost, complex equipment, loss of probiotic cell viability due to ice crystal formation during drying, fragility and sensitivity to moisture count are certain drawbacks of freeze-drying probiotics [9,10].
In terms of encapsulants, dairy food matrices have owned flagship in being one of the best conventional carriers and delivery systems for a vast range of probiotics [11]. This dominance can be attributed to the richness of dairy products with proteins and lipids, which act as protective shields for the probiotic species during extended periods of refrigerated storage and the harsh gut environment during consumption [12]. However, recent years have witnessed a gradual paradigm shift from dairy-based carriers to non-dairy alternatives. These non-dairy matrices include various options such as fruit and vegetable juices, fermented beverages derived from rice and tea, baked goods, cereals, sauces, and gums. The rationale for this transition stems from the various shortcomings associated with dairy-based carriers. These shortcomings include lactose intolerance, allergenic reactions to dairy proteins, and concerns regarding high cholesterol levels [13-18]. Additionally, it is noteworthy that the existing body of research has predominantly focused on probiotic encapsulation in the form of powders or capsules, while liquid solutions such as fruit juices remain an underexplored frontier.
The shift toward non-dairy probiotic carriers becomes increasingly imperative to direct research efforts towards exploring innovative techniques for preserving and delivering probiotics using non-dairy matrices. Current literature demonstrates a conspicuous gap in our understanding of the freeze-drying of probiotics, particularly strains like L. plantarum and L. casei, when incorporated into fruit juices using encapsulants such as whey protein [19-22]. Thereby, this project critically probes the stability and viability of encapsulated L. plantarum and L. casei using some fruit juices (apple and tomato) as carriers during prolonged refrigerated storage. Furthermore, the study also investigated the bioaccessibility of such probiotics when the apple and tomato fruit juices enriched with probiotics (probiotic fruit juice) were subjected to in vitro digestion and fermentation. It aimed to interpret the interplay between the encapsulated probiotics and the challenging acidic environment typically associated with fruit juices. Shedding light on the prospects of using fruit juices as probiotic carriers will establish innovative alternatives against their conventional dairy-based counterparts. This investigation is poised to contribute significantly to the knowledge of probiotics and their possible delivery using non-dairy food carriers.
Materials And Methods
Materials
The cryobeads of probiotic bacteria, Lactobacillus plantarum and Lactobacillus casei, were obtained from the stock cultures reserved in the microbiology laboratory at the School of Agriculture, Food, & Ecosystem Science, The University of Melbourne (Parkville, Melbourne, VIC, Australia). The Whey Protein Concentrate (WPC) was procured from Warrnambool Cheese and Butter Factory Company Holdings Ltd, Southbank VIC, Australia. The Apple Juice (Golden Circle ?), Tomato Juice (Woolworths Home brand) and Pink Lady apples were bought from Woolworths, a local supermarket in Melbourne, VIC, Australia.
Media and chemicals including De Man–Rogosa–Sharpe, Vegitone agar (MRS), MRS broth modified (Vegitone), plate count agar (PCA), bacteriological peptone, phosphate buffer solution (powder sachets), Folin-Ciocalteu Reagent (2N), gallic acid, pepsin (2500 U/mg), L- Cysteine HCl, mucin, fresh bile, bile salts, were purchased from Sigma-Aldrich Co., NSW, Australia. Peptone, tryptone, yeast extract KCl, NaCl, pectin, casein, NaHCO3, MgSO4.7H2O, guar gum, KH2PO4, CaCl2 and Tween 80 were purchased from the local Bio21 store, Melbourne, Australia. Pancreatin from porcine (2U/mg) was purchased from ChemSupply, Australia. KCL, KH2PO4, NaHCO3, NaCl, MgCl2(H2O)6, (NH4)2CO3, 1M HCl, 1M NaOH were procured from the Chemical Store of Building 194, School of Agriculture and Food, Faculty of Science, The University of Melbourne. The fresh faecal sample was collected from a healthy adult male donor without any history of antibiotics intake in the past six months before collection.
Methods
- Activation of Probiotics
The selected probiotics (L. plantarum and L. casei), on cryo-bead, were activated by aseptically transferring 1 bead into 50 ml MRS broth, followed by mixing and anaerobic incubation at 37°C for 48 hours. The final counts in the active cultures were between 106-107 CFU/ml.
- Preparation of free and encapsulated probiotics
The free probiotic cultures were pelletized via centrifuging of 1ml of each active culture at 8000 rpm for 2 minutes at 4°C using a benchtop centrifuge (Eppendorf™ 5424R). The encapsulation of both probiotic species was performed following the method of [23] with some modifications. Each activated culture (10 ml) was individually mixed with 200 ml of pasteurised whey protein solution (10% w/v) under aseptic conditions and left for about 5 to 6 hours at room temperature to allow the interaction between protein and probiotics. The active culture in whey protein solution was distributed into 50 ml Falcon tubes (35 ml each) and frozen at -20°C overnight before freeze-drying. The frozen suspensions were freeze-dried at -50°C for 72 hours using a benchtop freeze dryer (Dynavac FD3, United States) until the powders were obtained. The freeze-dried encapsulated probiotic powders were stored at -20°C until used. The actual probiotic counts in the active cultures were assessed before and after freeze-drying using a spread plate technique [24].
- Enrichment of fruit juice with free and encapsulated probiotics
All selected commercial fruit juices (apple and tomato) were enriched with 1% of the prepared probiotic cultures (L. plantarum or L. casei). The treatments included the enrichment of the fruit juices (apple and tomato) with 1% or the selected probiotic as following: (1) apple juice (Aj) enriched with free L. plantarum (AjFLp), (2) Aj with encapsulated L. plantarum (AjELp),
(3) Aj enriched with fee L. casei (AjFLc), (4) Aj with encapsulated L. casei (AjELc), (5) Aj as a control (no added probiotic). The same treatments were repeated with tomato juice samples to generate (TjFLp, TjELp, TjFLc, TjELc, and Tj). All treatments were prepared in duplicate and stored refrigerated (4°C) for 4 weeks and analysed on days 1, 14, and 28. The In vitro tests were done days 1 and 21.
- Examination of physicochemical properties
Colour analysis
The L*, a* and b* values of all the samples were measured using a Konica Minolta CR-400 Chromameter. All three colour parameters were measured in triplicates for each sample.
pH analysis
The pH value of each sample was recorded in duplicates using a digital pH meter re-calibrated with pH 4.0 and 7.0 buffers (HANNA Instruments, Vinsokite, RI, USA).
Titratable acidity
The titratable acidity of apple and tomato juice samples was measured by titrating 10 ml of juice solution with 0.1N NaOH using phenolphthalein indicator. The TA was further expressed as the percentage (%) of respective acid, malic acid for apple juice and citric acid for tomato juice [25].
The formula used for calculation was as follows
where,
F= targeted acid correct factor {malic acid F= 6.7; citric acid F = 14.4} V1 = volume of 0.1N NaOH
M = 0.1N of NaOH, V2 = sample volume
Total Phenolic Content
The total phenolic content (TPC) of all the samples were measured using the Folin-Ciocalteu Assay with some modifications [26]. Firstly, in a 10 ml falcon tube, 10 uL juice sample was mixed with 90 uL of methanol (Sigma Aldrich. St. Louis, Missouri, USA) to achieve ten-fold diluted extract (1:10). Then 2.5 ml of 0.2 N FCR was added to the diluted juice, mixed, and rested for 5 minutes at room temperature. Furthermore, 2 ml of 7.5% sodium carbonate concentrate was added to the solution and vortexed for 10 seconds using vortex mixer VX100 (Labnet International, Inc., Edison, NJ, USA). The tubes were then wrapped and kept in the dark for 1 hour at room temperature. Then three 200uL aliquots of each sample were transferred into a 96-well microplate, and their absorbance was measured in triplicates at 765 nm using a microplate reader (Thermo Scientific Multiskan GO). A standard curve was prepared following the same procedures and using various concentrations of gallic acid as standards. The TPC of each sample was expressed in ug/ml juice sample.
Assessment of microbiological counts
The lactic acid bacteria and total plate counts were analysed in duplicates using MRS agar. All samples were examined on days 1, 14 and 28 following the spread plate technique [24].
Performing in vitro gastrointestinal digestion of probiotic fruit juices
The in-vitro gastrointestinal digestion and fermentation of probiotic fruit juices were performed following the methods of Minekus [27]. Samples were subjected to gastrointestinal (enzymatic) digestion prior to the in vitro fermentation.
Preparation of fluids
- Simulated gastric fluid (SGF)
The SGF was prepared by mixing the stock solutions in the following quantities – 6.9 ml KCL,0.9 ml KH2PO4, 12.5 ml NaHCO3, 11.8 ml NaCl, 0.4 ml MgCl2(H2O)6, and 0.5 ml (NH4)2CO3.The pH was adjusted to 3 using 1 M HCl solution. The volume was made up to 500 ml using Milli-Q water. A simulated gastric premix (50 ml) was then prepared by mixing 45.5 ml SGF,0.08 g Pepsin (2500 U/mg), 25 uL CaCl2, 75 uL ml 1M HCL, and 4.4 ml Milli-Q water.
- Simulated Intestinal Fluid (SIF)
A solution of SIF was prepared by mixing stock solutions in the following quantities – 6.8 ml KCL, 0.8 ml KH2PO4, 42.5 ml NaHCO3, 9.6 ml NaCl, and 1.1 ml MgCl2(H2O)6. The pH of the solution was adjusted to 7 with 1 M NaOH and 1 M HCl. The volume was made up to 500 ml using Milli-Q water. A simulated intestinal premix was then prepared by mixing 46.25 ml SIF, 5 g pancreatin (2 U/ml), 0.408 g fresh bile, 225 uL 4M NaOH and 3.425 ml Milli-Q water.
- Basal Medium
The basal medium used for fermentation was prepared by adding 2.5 g of peptone, 2.5 g of tryptone, 2.25 g of yeast extract, 2.25 g of KCl, 4.5 g of NaCl, 2 g of mucin, 1 g of pectin, 1.5 g of casein, 0.75 g of NaHCO3, 0.4 g of L-Cysteine HCl, 0.62 g of MgSO4.7H2O, 0.5 g of guar gum, 0.25 g of KH2PO4, 0.2 g of bile salts, 0.55 g of CaCl2 and 0.5 mL of Tween 80 in 500 mL of Milli- Q water and autoclaved at 121°C for 1 hour, 15 psi (Systec DX200 Autoclave).
- Faecal Slurry
The faecal samples were collected after obtaining ethical approval (2023-26404-38860-4) from the human ethics team at the University of Melbourne. The fresh sample (20 g) was mixed with 100 ml sterile 0.1% bactopeptone and placed inside sterile stomacher filter bags. The faecal slurry was stomached for 2 min using a BagMixer (Interscience, France). The filter bags enabled the removal of any suspended matter under aseptic conditions. The prepared slurry was divided into subsamples (20 ml each) and frozen at -20°C until used. The bacterial count in that stock faecal culture was conducted immediately after preparation using a spread plate technique [23]. The lactic acid bacteria and total aerobic and anaerobic counts were conducted in duplicates using MRS and PCA agar plates, respectively.
- Gastric Digestion
Each tested Probiotic Fruit Juice (PFJ) sample (2.5 ml) was individually transferred into a 15 mL polypropylene tube containing 2.5 mL of simulated gastric premix (pH 3) containing pepsin (2500 U/mg) and incubated for 2 h at 37°C in a shaking incubator (ZWYR-240, Labwit Scientific, Australia) at 120 rpm. Digestion was stopped by adjusting the sample pH to 6.8 with 1 M NaOH, where pepsin was denatured.
- Intestinal digestion
A specific volume (2.5 ml) of the gastric digested samples was mixed with 2.5 ml of simulated intestinal pre-mixed fluid containing pancreatin (2 U/ml) and bile in a 15 mL polypropylene tube. All samples were incubated for 2 hours at 37 °C and 120 rpm in a shaking incubator (ZWYR-240, Labwit Scientific, Australia).
- Colonic fermentation
Colonic fermentation was conducted by mixing 2.5 ml of gastrointestinal digested samples with 1 ml of previously prepared faecal stock culture and 1.5 ml of basal medium. The tubes were flushed with N2 gas (purity 4.0, Coregas, Thomastown, Australia) before replacing the caps and incubating in anaerobic chambers (AnaeroGenTM, ThermoFisher Scientific, Scoresby, Australia) containing an anaerobic indicator (BR0055B, ThermoFisher Scientific, Scoresby, Australia). The chambers were placed into a shaking incubator (ZWYR-240, Labwit Scientific, Australia) at 37 °C and 100 rpm for 48 hours. LAB counts and total aerobic and anaerobic counts were conducted after 48 hours of fermentation. The blank samples were prepared using faecal slurry and basal medium only (no probiotic fruit juice).
Statistical Analysis
A one-way analysis of variance (ANOVA) was used to estimate any disparities among all treatments. The Fisher's Least Significant Difference (LSD) test was subsequently implemented to establish the means that differ significantly at a 95% confidence level (p < 0.05). All statistical analyses were conducted using Minitab® 19 Statistical Software for Mac (Minitab Inc., USA) and Microsoft Excel®.
Results
The physiochemical properties of probiotic fruit juices during refrigerated storage
- Changes in pH and titratable acidity
Changes in the pH of commercial apple and tomato juices enriched with free and encapsulated probiotics during refrigerated storage (4°C) are depicted in Table 1. The recorded pH values in the control apple and tomato juice samples (3.32± 0.01 and 3.65± 0.03, respectively) were in agreement with those reported in the literature (3.32-3.8 in apple and 3.65–3.9 in tomato juice) [28]. The control apple and tomato juice samples maintained a stable pH over the 28 days of storage, essentially due to the lack of any probiotic enrichment and refrigeration storage. The initial pH value in apple juice samples was 3.32± 0.01. It increased significantly to 3.8±0.01 and 3.6±0.0 on day 1 of adding encapsulated L. plantarum and L. casei, respectively. A similar trend was also detected in tomato juice samples, with a significant increase in pH upon the enrichment with encapsulated probiotics. However, the initial pH in tomato juice (3.65±0.03) was larger than the initial pH in apple juice (3.32±0.01). The same data also showed that enriching apple and tomato juices with free probiotics caused insignificant changes in pH values on day 1 of preparation (Table 1).
|
|
|
|
|
|
|
|
|
|
|
|
Storage Time (Days) |
|
||||
|
|
Samples |
|
|
||||
|
|
|
|
|
Day |
Day 14 |
Day 28 |
|
|
|
|
AjC |
3.32 ± 0.01efg |
3.38 ± 0.01e |
3.29 ± 0.01gh |
||
|
APPLE JUICE |
|
AjELp |
3.8 ± 0.1a |
3.52 ± 0.04cd |
3.57 ± 0.01bc |
||
|
|
|
AjELc |
3.6 ± 0b |
3.49 ± 0.01d |
3.53 ± 0.01cd |
||
|
|
|
AjFLp |
3.37 ± 0.01e |
3.19 ± 0.01hi |
3.34 ± 0.01efg |
||
|
|
|
AJFLc |
3.36 ± 0.01ef |
3.23 ± 0.01i |
3.3 ± 0.01fg |
||
|
|
|
|
|
|
|
|
|
|
|
|
TjC |
3.65 ± 0.03h |
3.44 ± 0.01j |
3.7 ± 0.01g |
||
|
|
|
TjELp |
3.9 ± 0.01c |
3.73 ± 0.01f |
3.95 ± 0.01a |
||
|
TOMATO JUICE |
|
TjELc |
3.92 ± 0.01b |
3.7± 0.01g |
3.97 ± 0.01a |
||
|
|
|
TjFLp |
3.76 ± 0e |
3.52 ± 0.01i |
3.76 ± 0.01e |
||
|
|
|
|
TjFLc |
3.77 ± 0.01e |
3.51 ± 0.01i |
3.82 ± 0d |
|
Table 1: Changes in pH in commercial apple and tomato juices enriched with free and encapsulated probiotics during refrigerated storage. Means in columns and rows within each treatment (apple and tomato) followed with different superscript letters were significantly different (P < 0.05). Aj= apple juice, C= control, E= encapsulated, F= free; Lp= L. plantarum; Lc= L.caAsyou wish Senakasei; Tj= tomato juice
The pH values showed similar trends in all treatments, with some decline in pH values after 14 and 28 days of refrigerated storage compared to day 1 results. However, the pH values in both apple and tomato juice samples enriched with encapsulated probiotics retained significantly (P < 0.05) larger values than the control and the samples enriched with free probiotics after 28 days of refrigerated storage. The significant increment (P < 0.05) in the pH observed in apple and tomato juices enriched with encapsulated probiotics could be attributed to the buffering capacity of the whey protein coating the probiotics [29-31]. This buffering capacity can counteract the acid-producing effects of Lactobacillus fermentation and contribute to resistance in pH changes [32]. Moreover, the increment in pH in samples enriched with encapsulated probiotics could be attributed to the lysis of some probiotic strains during prolonged storage (28 days) and the release of their cell wall components.
Enriching fruit juices with free probiotics, with no whey protein encapsulant, didn’t show significant (P>0.05) drops in pH in most treatments during the 28 days of refrigerated storage and maintained a pH value of close to that in the control samples (3.29 and 3.70 in apple and tomato juices, respectively). Such results could be attributed to the limited growth and fermentation by these added free probiotics in these high acidity conditions. The titratable acidity (TA) was expressed as % malic acid and % citric acid for apple and tomato juice samples, respectively. As the relationship between pH and TA is usually negative, it was expected to detect a larger %TA in control apple juice, which had a smaller pH (3.32) than tomato (3.65). On the contrary, the TA (0.52%) in the control apple juice on day 1 was smaller than that in tomato juice (0.86%) (Table 2). Similar patterns were also reported in all treatments after 14 and 28 days of refrigerated storage with greater %TA in tomato juices than in apple. Even though the pH values in tomato juices were greater than those in apple juice (Table 1), the %TA values were also larger than those in apple (Table 2). Such contradiction between the theoretical pH and %TA inverse relationship and actual reported results, which revealed a positive relation, could be attributed to the fact that % titratable acidity measures the total hydrogen ion concentration (free and bound), while pH measured free ions only. The reported greater % TA in tomato juice samples could indicate the presence of larger amounts of bound hydrogen ions in those samples compared to apple juice.
|
|
|
|
Storage Time (Days) |
|
|
Samples |
||||
|
|
|
Day 1 |
Day 14 |
Day 28 |
|
|
AjC |
0.52i |
0.54h |
0.55g |
|
|
AjELp |
0.59e |
0.59e |
0.60d |
|
APPLE JUICE |
AjELc |
0.59e |
0.62b |
0.63a |
|
|
AjFLp |
0.55g |
0.59e |
0.61c |
|
|
AjFLc |
0.55g |
0.58f |
0.60d |
|
|
TjC |
0.86i |
0.96f |
0.96f |
|
|
TjELp |
0.96f |
0.96f |
1.06c |
|
TOMATO JUICE |
TjELc |
0.99e |
1.02d |
1.12b |
|
TjFLp |
0.93h |
0.99e |
1.18a |
|
|
|
TjFLc |
0.93h |
0.99e |
1.12b |
Table 2: Changes in titratable acidity in apple and tomato juices enriched with free and encapsulated probiotics during refrigerated storage. Means in columns and rows within each treatment (apple and tomato) followed with different superscript letters were significantly different (P < 0.05). Aj= apple juice, C= control, E= encapsulated, F= free; Lp= L. plantarum; Lc= L.casei; Tj= tomato juice.
- Changes in Colour
The L*, a* & b* are the colour space values that denote the quantitative measure of a sample lightness/brightness, red-green, and yellow-blue component, respectively [33].
L* values
The L* value ranges from 0 (black) to 100 (white). Data in Table 3a represented the changes in the L* values of commercial apple and tomato juices (controls and enriched with free and encapsulated probiotics) during storage at 4°C for 28 days. As expected, the lighter colour in the control apple juice showed significantly (P < 0.05) larger L* values (58.5 ± 0.08) than that in tomato (39.19 ± 0.03). The same data revealed that enriching apple juice with encapsulated probiotics decreased the L* value significantly on day 1. While, adding free probiotics didn’t cause any significant (P>0.05) decline in L* (Table 3-a). The L* values in all treatments (apple and tomato juices) showed a continuous decline on days 14 and 28 of refrigerated storage.
The more significant decline in L* in the presence of encapsulated probiotics in both apple and tomato juices could be attributed to the increased turbidity caused by the whey protein encapsulant. Furthermore, the previously reported increment in %TA after days 14 and 28 (section 3.1.1), mainly in samples enriched with free probiotics (Table 2), could also contribute to the continuous decline in L* value during refrigerated storage. Acidity could affect the release of some anthocyanin and carotenoids, and hence the declining in lightness [34].
|
|
|
|
Storage Time (Days) |
|
|
Samples |
||||
|
|
|
Day 1 |
Day 14 |
Day 28 |
|
|
AjC |
58.5 ± 0.08b |
54.29 ± 0.01c |
53.41 ± 0.02e |
|
|
AjELp |
52.99 ± 0.33f |
39.65 ± 0.03k |
41.97 ± 0.02h |
|
APPLE JUICE |
AjELc |
53.83 ± 0.02d |
40.3 ± 0.01j |
41.65 ± 0.04i |
|
|
AjFLp |
58.83 ± 0.03b |
53.77 ± 0.01c |
52.44 ± 0g |
|
|
AjFLc |
58.64 ± 0.05b |
53.03 ± 0.01c |
52.31 ± 0.02g |
|
|
TjC |
39.19 ± 0.03a |
30.81 ± 0.03 j |
30.79 ± 0.01j |
|
|
TjELp |
38.5 ± 0.38b |
32.4 ± 0.05f |
31.89 ± 0.01g |
|
TOMATO JUICE |
TjELc |
38.49 ± 0.01b |
33.12 ± 0.01e |
31.75 ± 0.01g |
|
TjFLp |
37.42 ± 0.03d |
31.34 ± 0.01h |
31.06 ± 0i |
|
|
|
TjFLc |
37.82 ± 0.01d |
31.03 ± 0ih |
30.73 ± 0.01i |
Table 3a: Changes in L* values in commercial apple and tomato juices enriched with free and encapsulated probiotics during refrigerated storage. Means in columns and rows within each treatment (apple and tomato) followed with different superscript letters were significantly different (P < 0.05). Aj= apple juice, C= control, E= encapsulated, F= free; Lp= L. plantarum; Lc= L.casei; Tj= tomato juice.
a* values
The positive and negative a* values imply redness and greenness, correspondingly [33]. As shown in Table 3b, the negative a* in the control apple juice samples on day 1 (- 0.31 ± 0.03) depicted a green colour component. The control tomato juice showed a positive initial a* value (8.98±0.0I), revealing a significantly (p < 0.05) higher degree of redness, which is the common colour in tomato. Furthermore, most of the a* values in apple juice remained negative during storage and reflected more dominant green colour during storage. The same results indicated that a* values fluctuated in the presence of encapsulated or free probiotics in apple juice samples but didn’t change the negative a* values (green) into positive (red). Changes in a* values in tomato juice were more pronounced, with a significant (P < 0.05) decline on day 14. For example, a* in the control declined from 8.98 to 5.95 and remained stable until the end of the storage period. Similar patterns were observed in all other tomato juice treatments (Table 3b). These results showed that the intensity of red colour in tomato juice significantly (p < 0.05) declined in all treatments (control and enriched juice samples). Such decline in the degree of redness (a*) could be attributed to the oxidations and degradation of lycopene, the main colour ingredient in tomato.
|
|
|
|
|
Storage Time (Days) |
|
|
Samples |
|
|
|||
|
|
|
|
Day 1 |
Day 14 |
Day 28 |
|
|
|
AjC |
-0.31 ± 0.03e |
-0.84 ± 0.01f |
-0.64 ± 0.03d |
|
APPLE JUICE |
AjELp |
0.04 ± 0.01a |
0.06 ± 0.01b |
-0.04 ± 0.01b |
|
|
|
|
AjELc |
-0.01 ± 0.01a |
0.01 ± 0.01b |
-0.09 ± 0.02c |
|
|
|
AjFLp |
-0.25 ± 0.01b |
-0.8 ± 0.01e |
0.5 ± 0.01a |
|
|
|
AjFLc |
-0.32 ± 0.01b |
0.01 ± 0.93b |
-0.51 ± 0.03c |
|
|
|
|
|
|
|
|
|
|
TjC |
8.98 ± 0.01c |
5.95 ± 0g |
5.95 ± 0.03g |
|
|
|
TjELp |
9.4 ± 0a |
6.6 ± 0.01d |
6.41 ± 0.02e |
|
TOMATO JUICE |
TjELc |
9.33 ± 0.02a |
6.66 ± 0.01d |
6.3 ± 0.04f |
|
|
|
|
TjFLp |
9 ± 0.14c |
6.03±0.06g |
6.32±0.02ef |
|
|
|
TjFLc |
3.77 ± 0.01e |
5.93 ± 0.01g |
5.96 ± 0.04g |
Table 3b: Changes in a* values in commercial apple and tomato juices enriched with free and encapsulated probiotics during refrigerated storage. Means in columns and rows within each treatment (apple and tomato) followed with different superscript letters were significantly different (P < 0.05). Aj= apple juice, C= control, E= encapsulated, F= free; Lp= L. plantarum; Lc= L.casei; Tj= tomato juice
b* values
The b* chromaticity coordinate measures the yellow-blue attribute of a colour sample. Positive values signify the presence of yellowness, whereas negative values indicate the presence of blueness [35]. Data in Table 3-c display the changes in b* values in apple and tomato juices enriched with free and encapsulated probiotics during refrigerated storage. The overall b* in all apple juice treatments on day 1 was significantly (P < 0.05) smaller than those in tomato juices. For example, the b* values in the controls of apple and tomato juices were 1.23 ±0.06 and 8.07±0.08, respectively. Furthermore, apple juices with encapsulated probiotics showed significantly larger b* values than in the presence of free probiotics. Similar patterns were recorded after days 14 and 28 of refrigerated storage. The larger b* values in apple juices with encapsulated probiotics could be attributed to the effect of whey protein encapsulant and the possible oxidation of polyphenols in apple juice. The significantly (P < 0.05) greater b * values in all tomato juice treatments than in apple juices on day 1 could be related to the presence of lycopene in tomato juice. Furthermore, the significant (P < 0.05) decline in tomato juice b* on day 14 of refrigerated storage could be attributed to lycopene oxidation.
|
|
|
|
Storage Time (Days) |
|
|
Samples |
|
|
||
|
|
|
Day 1 |
Day 14 |
Day 28 |
|
|
AjC |
1.23 ± 0.06hi |
2.58 ± 0.01de |
1.59 ± 0.01g |
|
|
AjELp |
2.9 ± 0.07bc |
3.02 ± 0.01abc |
3.06 ± 0.01ab |
|
APPLE JUICE |
AjELc |
2.74 ± 0.01cd |
3.24 ± 0.01a |
3.22 ± 0a |
|
|
AjFLp |
1.06 ± 0i |
2.41 ± 0e |
1.21 ± 0hi |
|
|
AjFLc |
1.36 ± 0.05gh |
1.94 ± 0f |
1.55 ± 0.51g |
|
|
TjC |
8.07 ± 0.08a |
3.06 ± 0.02l |
3.02 ± 0.01l |
|
|
TjELp |
6.63 ± 0.01b |
3.94 ± 0.01g |
3.67 ± 0.01h |
|
TOMATO JUICE |
TjELc |
5.89 ± 0.01d |
4.38 ± 0.02f |
3.58 ± 0i |
|
|
TjFLp |
5.38 ± 0.09e |
3.39 ± 0.01j |
3.46 ± 0.02j |
|
|
TjFLc |
6.08 ± 0.04c |
3.2 ± 0.01k |
3 ± 0.01l |
Table 3c: Changes in b* values in commercial apple and tomato juices enriched with free and encapsulated probiotics during refrigerated storage.
Total Phenolic Content (TPC)
Changes in the total phenolic contents (TPC) in all treatments during the refrigerated storage are presented in Table 4. These results showed that the initial TPC in the control apple juice (481.39 ± 10.6 ug/ml) was significantly larger than in the control tomato sample (165.6 ± 35.4 ug/ml). The positive impact of added encapsulated and free probiotics on releasing more phenolic compounds during refrigerated storage in all juice treatments was very clear compared to the control. The increases in TPC in both apple and tomato juices were significant (P < 0.05) and obvious on day 1 of storage. The TPC increased in apple juice by 34.84% and 45.58% in the presence of encapsulated and free L. plantarum, respectively. Similar results were also reported using L. casei in apple juice. Data also showed a significant (P < 0.05) decline in the TPC in apple juices after 14 days of refrigerated storage, followed by significant increases on day 28 (Table 4). Such significant reduction (p < 0.05) in TPC in apple juices within 14 days in the presence of free and encapsulated probiotics can be explained by possible oxidation and degradation of major phenolic compounds. Previous studies by [36-38] mentioned that phenolic compounds could be degraded by the microbial enzymes released from the damaged or lysed bacteria over time. However, the increases in TPC on day 28 of refrigerated storage might be caused by slow fermentation under these conditions and an increase in TPC. A similar conclusion was noted. [39]. Who reported that fermentation of cereals by lactic acid bacteria increased the level of phenolic contents.
|
|
|
|
Storage Time (Days) |
|
|
Samples |
|
|
||
|
|
|
Day 1 |
Day 14 |
Day 28 |
|
|
AjC |
481.39 ± 10.6e |
239.16±7.5g |
754.44±2.4b |
|
|
AjELp |
649.2 ± 41.2d |
296.11±5.5f |
980 ± 5.5a |
|
APPLE JUICE |
AjELc |
663.34 ± 3.2d |
258.61±0.4g |
966.67±12.6a |
|
|
AjFLp |
700.84 ± 8.3c |
253.33±1.6g |
732.78±0.8b |
|
|
AjFLc |
755.6 ± 20.4b |
287.77±13.4f |
743.06±0.4b |
|
|
TjC |
165.6 ± 35.4i |
521.11±7.1g |
933.62±11.4c |
|
|
TjELp |
437.5 ± 5.9h |
1052.5±18.5a |
917.22±3.1c |
|
TOMATO JUICE |
TjELc |
555.56 ± 7.1fg |
723.6±18.5e |
855.8±14.5d |
|
|
TjFLp |
123.06 ± 4.3j |
1064.7±40.5a |
984.44±5.5b |
|
|
TjFLc |
169.72 ± 12.2i |
587.5±9.8f |
951.4±15.3bc |
Table 4: Changes in Total Phenolic Content (ug/ml juice) in apple and tomato juices enriched with free and encapsulated probiotics during refrigerated storage.
The impacts of free and encapsulated probiotics on tomato juices differed from those detected in apple juices. Results in Table 4 revealed that both species of encapsulated probiotics (L. plantarum and L. casei) increased the TPC on day 1 of storage by 165% and 235%, respectively. However, adding free probiotics didn’t cause any significant changes (P>0.05) on day 1. The significant increment in TPC in the presence of encapsulated probiotics could be related to their slow fermentation, as explained before, with apple juice sample. However, the lack of such effect on day 1 in the presence of the same species of free probiotic might be due to the damage of free probiotics under such acidic conditions (pH 3.76) in tomato juice. The same data also showed that TPC in all tomato juice treatments, including the control, increased significantly (P < 0.05) on day 14 and continued with that pattern toward the end of refrigerated storage. Such sudden significant increases starting day 14 could be attributed to the breakdown and oxidation of lycopene in tomato juice [40]. Lycopene is a red carotenoid pigment found abundantly in tomatoes that gets degraded during processing and prolonged storage of both probiotics-enriched tomato juice and control samples [41]. The oxidative cleavage of lycopene leads to the generation of various derivative compounds, such as apo-lycopenals, apo-lycopenones, and epoxy-lycopenals [42]. Many of these lycopene oxidation products have phenolic groups in their structures. Furthermore, adapting the free probiotic to that acid environment in tomato juice by day 14 might have contributed to the increment in TPC via fermentation. Fermentation can break down or metabolize certain components in the tomato juice, potentially leading to the release of phenolic compounds that were previously bound or inactivated. This can also be linked to the hydrolytic enzymes potentially liberating phenolic compounds that were originally part of larger molecules observed in the same timeline in the tomato juice samples, which may have contributed to the increase in the estimated total phenols [43].
Viability of free and encapsulated probiotics in apple and tomato juices during refrigerated (4oC) storage
Assessment of the viable counts of activated probiotic species before they were added to fruit juices revealed counts of 9.24 log CFU/ml and 9.74 log CFU/ml of L. plantarum and L. casei, respectively, in free culture (before freeze drying). However, encapsulation using freeze drying decreased these counts to 7.02 log CFU/ml (L. plantarum) and 6.9 log CFU/ml (L. Casei). As the fruit juices were enriched with 1% of a designated culture, the initial count of each added encapsulated probiotic was the same (6.9-7.02 log CFU/ml) within each added species in all juice samples. Likewise, the number of added free probiotics species was also the same (9.24- 9.74 CFU/ml). Changes in the probiotic counts (log CFU/ml) in all treatments during the refrigerated storage are presented in Table 5. As expected, both apple and tomato controls (no added probiotics) showed L.plantarum and L. casei before adding them to the fruit juices were 7.02 and 6.9 log CFU/ml, respectively. Those counts decreased to 6.91±0.01 to 6.73±0.1 CFU/ml on day 1 of storage in apple juice enriched with encapsulated probiotics, which represented an insignificant decline by only 0.11 and 0.17 log CFU/ml, respectively. However, those counts of encapsulated probiotics in apple juices decreased further by >2 logs CFU/ml on day 14 of storage. The remaining recorded counts on day 14 were 4.09±0.04 and 4.57±0.06 log CFU/ml in AjELp and AjELc, respectively. Those counts continued to decrease further toward the end of the storage period and showed a viability (L. plantarum and L. casei decreased by 3.28 and 3.89 logs by day 14 of storage, the remaining counts in apple juices were very close to 6 logs. This could be attributed to the significantly larger counts in the initial free probiotics (>9 logs) as compared with the encapsulated (~ 7 logs). These findings confirmed the positive relationship between initial counts and the final viable counts after treatment and storage. In the case of tomato juice samples, a similar trend was observed during refrigerated storage with viable counts of L. plantarum and L. casei, respectively. However, enriching tomato juices with free probiotics depicted larger viable counts (7.17± 0.05 and 6.89± 0.12 log CFU/ml) on day 1. Such results could be attributed to the significantly larger initial counts (9.24 log CFU/ml and 9.74 log CFU/ml) of the free cultures used in the enrichment. Changes in probiotic survival after 14 days of refrigerated storage showed a further decline in the probiotic counts in all treatments. However, like apple juices, tomato juices enriched with free probiotics maintained significantly (P < 0.05) larger viable counts than in the sample fortified with encapsulated probiotics due to the same reasons explained with apple juices. Consequently, it was concluded that enriching fruit juice with encapsulated probiotics requires increasing the initial encapsulated counts to >9 logs before adding them to the fruit juice.
|
|
|
|
Storage Time (Days) |
|
|
Samples |
|
|
||
|
|
|
Day 1 |
Day 14 |
Day 28 |
|
|
AjC |
< 1f |
< 1f |
< 1f |
|
|
AjELp |
6.91 ± 0.01a |
4.09 ± 0.04e |
< 1f |
|
APPLE JUICE |
AjELc |
6.73 ± 0.17b |
4.57 ± 0.06d |
< 1f |
|
|
AjFLp |
6.98 ± 0.03a |
5.96 ± 0.04c |
< 1f |
|
|
AjFLc |
6.96 ± 0.03a |
5.95 ± 0.06c |
< 1f |
|
|
TjC |
< 1h |
< 1h |
< 1h |
|
|
TjELp |
5.84 ± 0.11e |
4.97 ± 0.04f |
< 1h |
|
TOMATO JUICE |
TjELc |
5.82 ± 0.06e |
3.95 ± 0.01g |
< 1h |
|
TjFLp |
7.17 ± 0.05a |
6.26 ± 0.02d |
< 1h |
|
|
|
TjFLc |
6.89 ± 0.12b |
6.39 ± 0.02c |
< 1h |
Table 5: Changes in lactic acid bacteria count (log cfu/ml) in commercial apple and tomato juices enriched with free and encapsulated probiotics during refrigerated storage.
Viability of free and encapsulated probiotics in apple and tomato juices stored refrigerated and subjected to in-vitro gastrointestinal digestion after days 1 and 21
The gastric and intestinal digestion and colonic fermentation of treated apple and tomato juices were conducted on days 1 and 21 of refrigerated storage. Significant (P < 0.05) reduction to in vitro gastric digestion (GD) of apple and tomato juices (data not included in this manuscript). That significant decline in probiotic counts after GD could be attributed to the stress caused by exposure to extremely low pH (2.8) in the simulated gastric environment in addition to the pepsin activity in the gastric fluid. Studies by [44,45] reported that pepsin damages the probiotic cell wall and the peptide bonds between the amino acids of their cell membrane, causing cell wall lysis and a significant reduction in their viable counts under such conditions.
LAB counts in treated apple and tomato juices subjected to in-vitro gastrointestinal digestion after 1 day of refrigerated storage
Following the sharp decline in LAB counts during the Gastric Digestion (GD), significant (P<0.05) recoveries in the viable LAB counts in juices enriched with encapsulated probiotics were detected after 2 h of Intestinal Digestion (ID) (Figure 1 A&B). It is anticipated that favourable conditions during the ID, including neutral acidity (pH 7) and nutrient availability coupled with the shielding effect of whey protein in the encapsulated probiotics, contributed to the significant recovery of the encapsulated L. plantarum and L. casei in both apple and tomato juices (Figure 1A&B). The recorded viable counts of L. plantarum and L. casei after 2 h of ID reached 3.44± 0.03 and 4.0± 0.04 in apple juice and 3.75± 0.00 and 4.55± 0.03 in tomato juice, respectively. However, the viable LAB counts in the control treatments and apple and tomato juices enriched with free probiotics continued to show very low counts (in vitro Colonic Fermentation (CF) revealed excellent recovery with significant (P < 0.05) increases in the LAB log CFU/ml in all treatments, including the controls (Figure. 1 A&B). The detected log CFU/ml after 48 h of CF ranged from 4.45±0.02 (AjC) to 4.94±0.01 (TjFLc). The LAB counts detected in the control samples might have been produced from the added faecal inoculum during the CF. The recovery reported after 48 h of CF could be attributed to the better recovery of both free and encapsulated probiotics during the CF and the availability of polyphenols in apple and lycopene in tomato juices that were utilized by L. plantarum and L. casei as prebiotics.
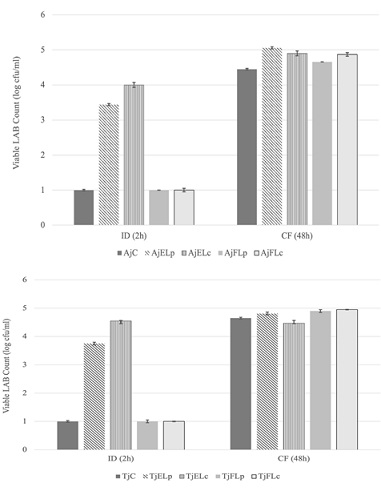
Figures 1A&1B: Changes in the LAB counts (log CFU/ml) during the in vitro gastrointestinal digestion of apple (A) and tomato (B) juices enriched with free and encapsulated probiotics and stored refrigerated for 1 day.
LAB counts in treated apple and tomato juices subjected to in-vitro gastrointestinal digestion after 21 days of refrigerated storage
The LAB viable counts in fruit juices stored for 21 days before the in vitro gastrointestinal digestion were significantly (P < 0.05) larger than those detected in samples stored for 1 day only. The log CFU /ml in all treatments, including the control, reached > 6 logs after 2 h ID and > 7 logs after 48 h of CF (Figure 1 A&B). The 48 h of in vitro colonic fermentation of fruit juices already refrigerated for 21 days led to a vigorous proliferation in the probiotic counts to exceed the recommended therapeutic minimum of 106-107 CFU/ml in all samples. These results may suggest that storing fruit juices enriched with probiotics for 21 days will provide the LAB with the chance to fully adjust to the high acidity in apple and tomato and become more readily available for the ID and CF. Furthermore, the optimal growth conditions during CF (pH 7) and the availability of undigested carbohydrates and dietary fibers served as sources of nutrients (prebiotics) for probiotic bacteria. It should be mentioned that the reported large viable counts (> 7 log CFU/ml) detected in the control samples (AjC and TjC) after CF were unexpected. The possible source of such large viable counts in the controls could be from the added faecal slurry before the start of the CF.
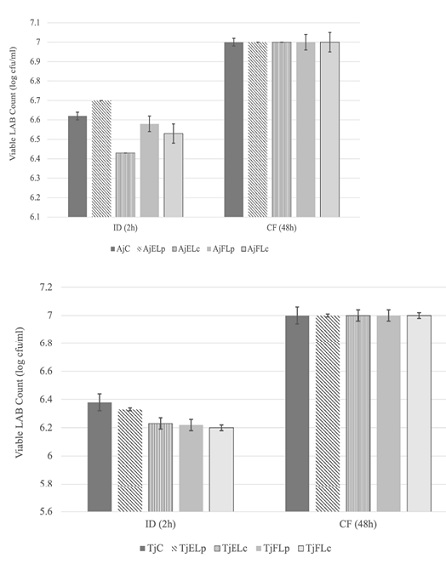
Figures 2A&2B: Changes in the LAB counts (log CFU/ml) during the in vitro gastrointestinal digestion of apple (A) and tomato (B) juices enriched with free and encapsulated probiotics and stored refrigerated for 21 days.
Conclusion
This study offers valuable insight into the viability of free and encapsulated probiotics in acidic fruit juices with pH ranges from 3.32 (apple) to 3.65 (tomato). The encapsulation of Lactobacillus plantarum and Lactobacillus casei via freeze-drying using whey protein concentrate enabled the maintenance of adequate probiotic populations (~ 7 log CFU/ml) after drying. Furthermore, the encapsulated probiotics demonstrated enhanced survival during prolonged refrigerated storage up to 28 days in commercial apple and tomato juices. Notable differences were observed between the two probiotic species regarding their acid and bile tolerance. L. plantarum exhibited greater robustness and was better equipped to endure the harsh conditions posed by the fruit juices. In contrast, L. casei experienced substantial losses in viability during refrigerated storage. These outcomes highlight the importance of selecting species intrinsically resilient to acidic and bile exposures when developing fruit juice-based probiotic carriers. The physicochemical properties (pH, titratable acidity, colour, and total phenols) of fruit juices enriched with probiotics showed some changes but remained within acceptable conditions. Results from the in-vitro gastrointestinal digestion revealed encapsulation using whey protein coating seemed to protect the probiotics during gastric transit. However, further optimization is required to ensure stability and viability during the intestinal phase and subsequent colonic fermentation. Overall, this research demonstrates the promising potential of using fruit juices as novel probiotic carriers, offering a healthful, non-dairy alternative. However, the results showed that the initial viable counts of encapsulated probiotics must be > 9 logs to secure the recommended doses of 106-107 CFU/ml after 14 days of refrigerated storage. This can be achieved by increasing the inoculum volume from 1% (used in this study) to 2%. Furthermore, results revealed significant drops to < 1 log CFU/m in the viable counts of free and encapsulated probiotics in fruit juices after 28 days of refrigerated storage. Consequently, further investigation is recommended to determine the maximum storage period of fruit juices enriched with probiotics.
References
- Ozen M, Dinleyici EC (2015) The history of probiotics: The untold story. Beneficial Microbes, 6: 159-165.
- FAO/WHO (2006) Probiotics in food: Health and nutritional properties and guidelines for evaluation. Food and Agriculture Organization of the United Nations, Italy.
- Precedence Research (2022) Probiotics Market Size to Hit Around US$133.92 Billion by 2030. Precedence Research, Canada.
- Gbassi GK, Vandamme T (2012) Probiotic Encapsulation Technology: From Microencapsulation to Release into the Gut. Pharmaceutics 4: 149-163.
- Aschenbrenne M, Först P, Kulozik U (2015) Freeze-drying of Journal of Food Science 213-241.
- Bolla P, Serradell M, Urraza DP, Antoni DG (2011) Effect of freeze-drying on viability and in vitro probiotic properties of a mixture of lactic acid bacteria and yeasts isolated from kefir. The Journal of Dairy Research 78: 15-22.
- Celik OF, O’Sullivan DJ (2013) Factors influencing the stability of freeze-dried stress-resilient and stress-sensitive strains of bifidobacteria. Journal of Dairy Science 96: 3506-3516.
- Jalali M, Abedi D, Varshosaz J, Najjarzade M, Mirlohi M, et al. (2012) Stability evaluation of freeze-dried Lactobacillus paracasei subsp. Tolerance and Lactobacillus delbrueckii subsp. Bulgaricus in oral capsules. Research in Pharmaceutical Sciences 7: 31-36.
- Halim M, Mustafa MNA, Othman M, Wasoh H, Kapri MR, et al. (2017) Effect of encapsulant and cryoprotectant on the viability of probiotic Pediococcus acidilactici ATCC 8042 during freeze-drying and exposure to high acidity, bile salts and heat. LWT - Food Science and Technology 81: 210-216.
- Oberoi K, Tolun A, Sharma K, Sharma S (2019) Microencapsulation: An Overview For The Survival Of Probiotic Bacteria. Journal of Microbiology, Biotechnology and Food Sciences 9: 280-287.
- Ranadheera CS, Vidanarachchi JK, Rocha RS, Cruz AG, Ajlouni S (2017) Probiotic Delivery through Fermentation: Dairy vs. Non-Dairy Beverages. Fermentation 3: 67.
- Vijaya Kumar B, Vijayendra SVN, Reddy OVS (2015) Trends in dairy and non- dairy probiotic products-A review. Journal of Food Science and Technology 52: 6112-6124.
- Afzaal M, Saeed F, Saeed M, Azam M, Hussain S, et al. (2020) Survival and stability of free and encapsulated probiotic bacteria under simulated gastrointestinal and thermal conditions. International Journal of Food Properties 23: 1899-1912.
- Galvão AMMT, Rodrigues S, Fernandes FAN (2020) Probiotic dried apple snacks: Development of probiotic coating and shelf-life studies. Journal of Food Processing and Preservation 44: 14974.
- Hernández-Barrueta T, Martínez-Bustos F, Castaño-Tostado E, Lee Y, Miller MJ, et al. (2020) Encapsulation of probiotics in whey protein isolate and modified huauzontle’s starch: An approach to avoid fermentation and stabilize polyphenol compounds in a ready-to-drink probiotic green tea. LWT 124: 109131.
- Min M, Bunt CR, Mason SL, Hussain MA (2019) Non-dairy probiotic food products: An emerging group of functional foods. Critical Reviews in Food Science and Nutrition 59: 2626-2641.
- Srisuk N, Nopharatana M, Jirasatid S (2021) Co-encapsulation of Dictyophora indusiata to improve Lactobacillus acidophilus survival and its effect on quality of sweet fermented rice (Khoa-Mak) sap beverage. Journal of Food Science and Technology 58: 3598-3610.
- Wong CH, Mak IEK, Li D (2021) Bilayer edible coating with stabilized Lactobacillus plantarum 299v improved the shelf life and safety quality of fresh-cut apple slices. Food Packaging and Shelf Life 30: 100746.
- Adebayo TB, Akpeji S (2016) Probiotic Viability, Physicochemical and Sensory Properties of Probiotic Pineapple Juice. Fermentation 2: 20.
- Alves NN, Oliveira DSS, Silva DARA, Desobry S, Costa DJMC, et al. (2017) Spouted bed as an efficient processing for probiotic orange juice drying. Food Research International 101: 54-60.
- Costa MGM, Fonteles TV, Jesus DALT, Rodrigues S (2013) Sonicated pineapple juice as substrate for L. casei cultivation for probiotic beverage development: Process optimisation and product stability. Food Chemistry 139: 261-266.
- Pereira ALF, Almeida FDL, Lima MA, Costa DJMC, Rodrigues S (2014) Spray-Drying of Probiotic Cashew Apple Juice. Food and Bioprocess Technology 7: 2492-2499.
- Pathogen Modeling Program (PMP) Online (2023) pH of Selected Foods. United States Department of Agriculture Agricultural Research Service, USA.
- Ajlouni S (2022) FOOD90023 Food Microbiology Practical School of Agriculture, Food and Ecosystem Science. The University of Melbourne, Australia.
- Al-Dairi M, Pathare PB, Al-Yahyai R (2021) Chemical and nutritional quality changes of tomato during postharvest transportation and Journal of the Saudi Society of Agricultural Sciences 20: 401-408.
- Mihaylova D, Desseva I, Stoyanova M, Petkova N, Terzyiska M, et al. (2021) Impact of In Vitro Gastrointestinal Digestion on the Bioaccessibility of Phytochemical Compounds from Eight Fruit Juices. Molecules 26: 1187.
- Minekus M, Alminger M, Alvito P, Ballance S, Bohn T, et al. (2014) A standardised static in vitro digestion method suitable for food -an international consensus. Food & Function 5: 1113-1124.
- Starek-Wójcicka A, Sagan A, Terebun P, Kwiatkowski M, Osmólska E, et al. (2023) Quality of Tomato Juice as Influenced by Non-Thermal Air Plasma Treatment. Applied Sciences 13: 587.
- Kim M, Oh S, Imm JY (2018) Buffering Capacity of Dairy Powders and Their Effect on Yoghurt Quality. Korean Journal for Food Science of Animal Resources 38: 273-281.
- Marcillo-Parra V, Tupuna-Yerovi DS, González Z, Ruales J (2021) Encapsulation of bioactive compounds from fruit and vegetable by-products for food application – A review. Trends in Food Science & Technology 116: 11-23.
- Ying D, Schwander S, Weerakkody R, Sanguansri L, Gantenbein DC, et al. (2013) Microencapsulated Lactobacillus rhamnosus GG in whey protein and resistant starch matrices: Probiotic survival in fruit juice. Journal of Functional Foods 5: 98-105.
- Doherty SB, Auty MA, Stanton C, Ross RP, Fitzgerald GF, et al. (2012) Application of whey protein micro-bead coatings for enhanced strength and probiotic protection during fruit juice storage and gastric incubation. Journal of Microencapsulation 29: 713-728.
- Ly B, Dyer E, Feig J, Chien A, Bino S (2020) Research Techniques Made Simple: Cutaneous Colorimetry: A Reliable Technique for Objective Skin Color Measurement. The Journal of Investigative Dermatology 140: 3-12.
- Garcia EF, Oliveira DAA, Luciano WA, Albuquerque DTMR, Oliveira DANM, et al. (2018) The performance of five fruit-derived and freeze-dried potentially probiotic Lactobacillus strains in apple, orange, and grape juices. Journal of the Science of Food and Agriculture 98: 5000-5010.
- Choudhury AKR (2014) 6-Colour measurement instruments. Principles of Colour and Appearance Measurement 221-269.
- Li Z, Teng J, Lyu Y, Hu X, Zhao Y, et al. (2018) Enhanced Antioxidant Activity for Apple Juice Fermented with Lactobacillus plantarum ATCC14917. Molecules 24: 51.
- Melini F, Melini V (2021) Impact of Fermentation on Phenolic Compounds and Antioxidant Capacity of Quinoa. Fermentation 7:20.
- Palencia-Argel M, Rodríguez-Villamil H, Bernal-Castro C, Díaz-Moreno C, Fuenmayor CA (2022) Probiotics in anthocyanin-rich fruit beverages: Research and development for novel synbiotic products. Critical Reviews in Food Science and Nutrition 64: 110-126.
- Shori AB, Baba AS, Muniandy P (2019) 5-Potential Health-Promoting Effects of Probiotics in Dairy Beverages. Value- Added Ingredients and Enrichments of Beverages 14: 173-204.
- Gahler S, Otto K, Böhm V (2003) Alterations of vitamin C, total phenolics, and antioxidant capacity as affected by processing tomatoes to different products. Journal of Agricultural and Food Chemistry 51: 7962-7968.
- Shi J, Maguer LM (2000) Lycopene in tomatoes: Chemical and physical properties affected by food processing. Critical Reviews in Food Science and Nutrition 40: 1-42.
- Maiani G, Castón MJP, Catasta G, Toti E, Cambrodón IG, et al. (2009) Carotenoids: Actual knowledge on food sources, intakes, stability and bioavailability and their protective role in humans. Molecular Nutrition & Food Research 53: 194-218.
- Ricci A, Cirlini M, Maolon A, Del RD, Calani L, et al. (2019) Use of Dairy and Plant-Derived Lactobacilli as Starters for Cherry Juice Fermentation. Nutrients 11: 213.
- Soares MB, Martinez RCR, Pereira EPR, Balthazar CF, Cruz AG, et al. (2019) The resistance of Bacillus, Bifidobacterium, and Lactobacillus strains with claimed probiotic properties in different food matrices exposed to simulated gastrointestinal tract conditions. Food Research International 125: 108542.
- Zhu W, Lyu F, Naumovski N, Ajlouni S, Ranadheera CS (2020) Functional Efficacy of Probiotic Lactobacillus sanfranciscensis in Apple, Orange and Tomato Juices with Special Reference to Storage Stability and In Vitro Gastrointestinal Survival. Beverages 6: 13.
Citation: Said Ajlouni, Yashmayi Bhoi (2024) Survival of Encapsulated Vs. Free Probiotics in Fruit Juices During Refrigerated Storage and In Vitro Gastrointestinal Digestion. . J Dairy Res Tech 06: 028.
Copyright: © 2024 Said Ajlouni, et al. This is an open-access article distributed under the terms of the Creative Commons Attribution License, which permits unrestricted use, distribution, and reproduction in any medium, provided the original author and source are credited.