The Effectiveness of a Natural Aqueous Extract of Chios Mastic in the Management of Irritable Bowel Syndrome: The MASTIQUA Randomized Controlled Clinical Trial
*Corresponding Author(s):
Labros S SidossisDepartment Of Kinesiology And Health, Division Of Life Sciences, School Of Arts And Sciences, Rutgers University, 08901 New Jersey, United States
Email:lsidossis@kines.rutgers.edu
Abstract
Chios mastic is a natural product with pleiotropic health properties. We aimed to explore the potential benefits of Chios mastic natural aqueous extract in Irritable Bowel Syndrome (IBS) management. We hypothesized that Chios mastic could improve IBS-related symptoms and quality of life. In this 3-month randomized controlled clinical trial, 55 IBS patients (44 ± 12 years, 74.5% female) were blindly allocated to a low-dose-mastic (LDMG, n=13), a low-dose-control (LDCG, n=13), a high-dose-mastic (HDMG, n=15) and a high-dose-control-group (HDCG, n=14). The LDMG and HDMG consumed 600 mL/d of water or lemon juice containing 0.06% and 0.55% of Chios mastic water, respectively. The LDCG and HDCG received identical placebo drinks. IBS severity and quality of life were evaluated through the IBS-Symptom-Severity-Scale (IBS-SSS, range: 0-500) and IBS-Quality-of-Life (IBS-QOL, range: 34-170). Fasting blood samples were also collected for laboratory analyses. At the end of the study, intervention groups exhibited a significant decline in median (1st, 3rd quartile) IBS-SSS [LDMG: from 195 (154, 285) to 145 (108, 186), p-value=0.005; HDMG: from 205 (170, 270) to 130 (95, 175), p-value=0.001] and IBS-QOL [LDMG: from 65 (50, 98) to 57 (46, 65), p-value=0.045; HDMG: from 68 (57, 89) to 50 (40, 69), p-value=0.009]. No significant effect on cardiometabolic indices was evident, however plasma interleukin-6 and total serum antioxidant capacity tended to improve in the LDMG (p-value=0.128 and 0.017, respectively) and HDMG (p-value=0.056 and 0.045, respectively). A natural aqueous extract of Chios mastic can ameliorate the severity of symptoms and quality of life of patients with IBS.
Keywords
Abdominal pain/bloating; Chios mastic; Gastrointestinal symptoms; Irritable bowel syndrome; Mastiha water; Pistacia Lentiscus var Chia
List of Abbreviations
ALT: Alanine transferase
AST: Aspartate transferase
BMI: Body mass index
DBP: Diastolic blood pressure
EMA: European Medicines Agency
FODMAP: Fermentable oligosaccharides, disaccharides, monosaccharides and polyols
GGT: Gamma-glutamyl transpeptidase
HDCG: High-dose control group
HDLC: High-density lipoprotein cholesterol
HDMG: High-dose mastic group
HOMA-IR: Homeostasis model of assessment of insulin resistance
hsCRP: High-sensitivity C reactive protein
IBS-C: Irritable bowel syndrome with constipation
IBS-D: Irritable bowel syndrome with diarrhea
IBS-M: Irritable bowel syndrome mixed type
IBS-QOL: Irritable bowel syndrome quality of life questionnaire
IBS-SSS: Irritable bowel syndrome symptom severity scale
IBS-U: Irritable bowel syndrome unspecified
IIBS: Irritable bowel syndrome
IL-6: Interleukin 6
LDCG: Low-dose control group
LDLC: Low-density lipoprotein cholesterol
LDMG: Low-dose mastic group
MDA: Malondialdehyde
PAL: Physical activity level
SBP: Pystolic bool pressure
TAC: Total antioxidant capacity
TC: Total cholesterol
TG: Triglycerides
WC: Waist circumference
WHTR: Waist circumference to height ratio
Introduction
Irritable bowel syndrome (IBS) is a chronic functional disorder of the gastrointestinal tract characterized by abdominal pain and detrimental changes in bowel function (stool composition and/or frequency of bowel movements) in the absence of organic gastrointestinal disease [1]. It represents a significant public health problem, with a worldwide prevalence of approximately 10% [2]. The clinical presentation of IBS typically includes symptoms of postprandial pain and discomfort in the upper abdomen, flatulence, bloating and symptoms of diarrhea and constipation that may coexist and alternate, while unpredictable bowel pattern, excessive straining during defecation, urgency, feeling of incomplete evacuation, feeling of fullness, nausea and vomiting are also reported by patients but are non-specific [3]. Due to its intestinal manifestations and their impact on daily occupational and social activities, IBS leads to impaired functionality and productivity and a significant deterioration in quality of life, often leading to or perpetuating psychological comorbidity (e.g., anxiety and depression) [3].
Pharmacological treatment for IBS aims at alleviating patient-specific predominant symptoms and includes antidiarrheal medication, laxatives for constipation antispasmodics or anticonvulsants for abdominal pain [4]. Dietary modifications for IBS management have also received significant scientific and research attention and include general healthy nutritional approaches, such as a prudent alcohol consumption pattern, avoidance of spicy foods that may aggravate symptoms, dietary fiber modification with possible benefits from soluble fiber supplementation, adequate hydration with emphasis on non-caffeinated drinks, restricting milk and dairy products in case of lactose intolerance and a balanced meal pattern (regular meals and proper meal conditions), although evidence of their effectiveness remains scarce and inconclusive [5,6]. As a second-line dietary approach, a low fermentable oligosaccharides, disaccharides, monosaccharides and polyols (FODMAP) diet is recommended, especially for patients with symptoms of diarrhea or excessive bloating/flatulence, however the low-FODMAP diet requires a strict dietitian-led elimination, reintroduction and long-term self-management protocol that might be difficult to implement in many patients [7,8].
A wide range of natural plant products have emerged as potential therapeutic agents, due to their high content in bioactive compounds which can hamper pathophysiological disease manifestations [9,10]. Chios mastic is the aromatic resin of Pistacia Lentiscus var. Chia (mastic tree), produced exclusively in the southern part of the Greek island of Chios. Chios mastic has been used by the Greek population as a medical remedy for the treatment of gastrointestinal disorders since ancient times, and still remains the object of intense scientific interest in light of research data supporting its strong anti-inflammatory, anti-oxidant, anti-microbial and anti-atherogenic properties [11,12]. In 2015, the European Medicines Agency (EMA) recognized Chios mastic as an herbal medicinal product with therapeutic indications for skin inflammation / healing of minor wounds and mild dyspeptic disorders (EMA/HMPC/46758/2015). Based on data highlighting its role as a phytotherapeutic product, Chios mastic is nowadays increasingly used in medicinal products and food supplements, and its pleiotropic effects on health are currently investigated, however research on its effects on IBS severity is currently lacking.
Taking into account the beneficial effects of Chios mastic on gastrointestinal health and the paucity of research data specific to functional bowel disorders, we hypothesized that Chios mastic could be a valuable natural product for the management of IBS in combination with established dietary recommendations and symptom-related pharmacological treatments. Thus, the aim of the present randomized controlled clinical trial was to explore the effects of a natural aqueous extract of Chios mastic on the severity of gastrointestinal symptoms, quality of life, as well as cardiometabolic, inflammatory and oxidative markers, of adult patients with a diagnosis of IBS.
Methods And Materials
The MASTIQUA study was designed as a 3-month, double-blind, parallel-group (allocation ratio 1:1), randomized controlled clinical trial to with a primary aim to explore the effectiveness of a natural aqueous extract of Chios mastic in the management of IBS. The study was approved by the Bioethics Committee of Harokopio University of Athens, Greece (protocol code: Γ-1038/12-03-2021, date of approval: March 12, 2021), is registered in the National Institutes of Health database (ClinicalTrials.gov, identifier: NCT04893499) and was conducted in accordance with the ethical principles of the Declaration of Helsinki [13].
Participants
Eligible candidates for the study were adults (18-65 years old) with a body mass index (BMI) of 18.5-35.0 kg/m2 and a ROME IV criteria based diagnosis of IBS [4]. Participants were recruited from the gastroenterology outpatient clinic of Laiko General Hospital of Athens and through print and social media advertisements in the Attica region (the metropolitan area of Athens). For those who responded to study advertisements and were willing to participate, the study physician thoroughly reviewed medical files to confirm IBS diagnosis. IBS was classified into the following subtypes according to the predominant disorder in bowel habits: constipation (IBS-C), diarrhea (IBS-D), mixed (IBS-M) and unclassified (IBS-U) [4].
Candidates were excluded from the study on the basis of the following: i) presence of other chronic gastrointestinal disorders that could explain gastrointestinal symptoms, including celiac disease, inflammatory bowel disease, peptic ulcer, gastritis and functional dyspepsia; ii) presence of other serious clinical conditions, such as cardiovascular disease, diabetes mellitus, active cancer or liver, pulmonary, kidney, chronic inflammatory, neurological, autoimmune and psychiatric diseases; iii) recent (within 6 months) surgery or hospitalization; iv) habitual excessive alcohol consumption, i.e., >30 gr of alcohol per day for males and >20 gr of alcohol per day for females; v) regular intake of Chios mastic products or supplements; vi) currently being on a weight-loss diet, a restricted diet (e.g., vegan, low FODMAP or gluten-free), or recent significant change (within 6 months) in lifestyle habits; and vii) pregnancy or breastfeeding for women. All IBS medications, including probiotics, prebiotics and symbiotics, and dietary supplements (e.g., multivitamins) were allowed, provided that their use was regular and on a stable dose for at least one month prior to enrolment and that it would remain stable throughout the 3-month intervention period. Participants were given detailed verbal and written information about the aims and procedures of the study before willingly providing their signed written consent to participate.
Interventions
After enrollment, participants were randomized to one of the four study groups: i) a low-dose mastic group (ldmg); ii) a low-dose control group (LDCG); iii) a high-dose mastic group (HDMG); or iv) a high-dose control group (HDCG). Randomization was performed by an investigator with no clinical involvement using a computer-generated web-based randomization algorithm, while all patients and study team members were blinded to patient allocation in study groups. Intervention arms (LDMG and HDMG) were provided with experimental drinks enriched with Chios mastic water, i.e., a natural aqueous extract produced during Chios mastic distillation, obtained from the Chios Mastiha Growers Association (Chios Island, Greece). The chemical analysis of the organic fraction of Chios mastic water is presented in Table 1. In specific, participants allocated in the LDMG and the HDMG were provided with 600 mL of water containing 0.06% of Chios mastic water (brand name: Mastiqua, Greek Mastiha Water) or 600 mL of lemon juice containing 0.55% of Chios mastic water (brand name: Mastiqua, Greek Lemonada with Sparkling Mastiha Water), respectively, to be consumed daily (3 bottles of 200 mL each) for three months. A detailed description of the nutritional content and ingredients of the two experimental drinks is provided in Table 2. Control arms (LDCG and HDCG) received the same amount of standard placebo drinks (placebo water and placebo lemon juice, respectively) in which the natural Chios mastic aqueous extract was substituted with water. For each type of drink (water and lemon juice), the experimental and placebo drinks were identical in appearance and organoleptic characteristics. All study drinks were manufactured and provided to participants upon enrollment by DS CONCEPTS LTD.
|
Ingredient |
% of the organic fraction |
|
I-Verbenone |
17.46 |
|
a-Terpineol |
16.75 |
|
Menthenediol |
7.72 |
|
Linalool |
7.65 |
|
Trans-Pinocarveol |
6.91 |
|
Menth-3-en-8-ol |
6.42 |
|
Menthene-diol isomer |
6.31 |
|
Borneol |
3.98 |
|
p-Cymen-8-ol |
2.59 |
|
Myrtenol/Myrtenal |
2.58 |
|
Trans-Carveol |
2.21 |
|
Trans-Linalool oxide |
2.11 |
|
Trans-geraniol |
1.05 |
|
Fenchyl alcohol |
1.81 |
|
Trans-Carenol |
1.72 |
|
a-Campholene aldehyde |
1.72 |
|
cis-Linalool oxide |
1.68 |
|
n.id. |
9.33 |
Table 1: Chemical analysis of the organic fraction of Chios mastic aqueous extract, evaluated by gas chromatography-mass spectrometry.
n.id., not identified.
|
Drink |
Ingredients |
Nutritional value (per 100 mL) |
|
Mastiqua, Greek Mastiha Water |
Water, Chios mastic water, carbon dioxide, mastiha flavouring, natural mint flavouring. |
Energy: 0 kcal Protein: 0 g Total carbohydrates: 0 g Sugars: 0 g Added sugars: 0 g Total fal: 0 g Saturated fat: 0 g Trans fat: 0 g Cholesterol: 0 g Sodium: 0 mg Natural aqueous extract of Chios mastic: 0.062% |
|
Mastiqua, Greek Lemonada with Sparkling Mastiha Water |
Water, fructose, lemon juice (7%) from concentrate, Chios mastic water, carbon dioxide, acid: citric acid, antioxidant: ascorbic acid, preservatives: sodium benzoate, potassium sorbate, natural flavourings, flavouring, stabilizer: gum arabic, glycerol esters of wood rosins. |
Energy: 41.27 kcal Protein: 0 g Total carbohydrates: 9.87 g Sugars: 9.87 g Added sugars: 9.87 g * Total fal: 0 g Saturated fat: 0 g Trans fat: 0 g Cholesterol: 0 g Sodium: 0 mg Natural aqueous extract of Chios mastic: 0.55% |
Table 2: Description of the nutritional content and ingredients of the two experimental drinks.
* 9.56 g from fructose and 0.31 g from natural lemon juice sugars.
Participants were asked to consume the three bottles of study drinks at separate eating episodes [e.g., one bottle (200 mL) of study drink before, with or after each main meal (breakfast, lunch and dinner)] instead of other beverages on a daily basis (participants in the HDMG and HDCG were instructed to consume study drinks as a substitute for fruit juice, soft drinks or other sugar-sweetened beverages). To evaluate compliance to the intervention, participants were asked to self-monitor the intake of study drinks in print forms provided by investigators on a daily basis throughout the study. All patients were also instructed to maintain their typical medication, use of supplements, dietary intake and physical activity level, and to refrain from any weight loss effort throughout the study. The study physician systematically recorded potential side-effects and was in charge of terminating the intervention if needed.
Assessments
Participants were evaluated in terms of sociodemographic characteristics, anthropometric indices, lifestyle habits, the severity of gastrointestinal symptoms, quality of life, biochemical and clinical parameters both pre- and post-intervention. All assessments were performed at the Laboratory of Nutrition and Dietetics of Harokopio University of Athens. A detailed medical history was taken from all participants with information about the presence and family history of various diseases, and the use of medications and dietary supplements. Participants’ sociodemographic characteristics, i.e., age, sex, income, years of education and type of occupation, were assessed, and financial status was categorized as poor, low, high, and very high if mean annual income was < 10,000 €, 10,000-20,000 € and >20,000 €, respectively. With regard to smoking habits, subjects who smoked ≥ 1 cigarette/day were considered as current smokers, those who had ceased smoking for ≥ 1 year prior to enrollment as former smokers, while those with no history of tobacco product use as never smokers.
Height (m) and body weight (kg) were measured following a standardized protocol, based on which the BMI was calculated and participants were categorized as underweight if BMI< 18.5 kg/m2, normal-weight if 18.5 ≤ BMI< 25 kg/m2, overweight if 25 ≤ BMI2 or obese if BMI ≥ 30 kg/m2 [14]. waist circumference (WC) was measured in cm using a non-elastic measuring tape (the tape was positioned parallel to the floor between the lowest rib and the superior border of the iliac crest, and the measurement was performed with the subject standing at the end of normal expiration); WC values ≥ 102 cm for males and ≥88 cm for females were categorized as increased according to international criteria [15]. The waist-to-height ratio (WHtR) was also calculated and values >0.5 were considered indicative of the presence of central obesity [16-18]. moreover, bioelectrical impedance analysis (BIA) was performed with the use of an 8-electrode automated analyzer (TANITA body composition analyzer BC-418MA, Tokyo, Japan) after an 8-h fasting period [19], and total fat mass, fat-free mass and body water (kg and % of total body mass) were measured for each participant.
Participants’ dietary habits were assessed through a 76-item semi-quantitative food frequency questionnaire (FFQ) validated for the Greek population [20], based on which, food group (e.g., grains, dairy products, fruits, vegetables) and individual food (e.g., potatoes, olive oil) and beverage (e.g., coffee, tea) consumption was extracted. The Mediterranean Diet Score (MedDietScore) was then utilized to evaluate participants’ level of adherence to the Mediterranean diet; the total score ranges from 0 to 55, with higher values indicating greater adherence [21]. The athens physical activity questionnaire (APAQ) [22] was used to evaluate participants’ physical activity level. The APAQ collects data on any kind of physical activity perfumed during the past week at work, at home and for recreation, as well as time spent in sedentary activities (e.g., sitting, TV) and sleep. Each activity was assigned a value of metabolic equivalent of tasks (MET) based on the 2011 Compendium of Physical Activities [23], and the energy expenditure associated with each activity was calculated in kcal/min based on the subject’s body weight (kg) divided by 60. For each participant, total daily energy expenditure was then calculated by summing the energy expenditure of each activity performed and expressed as kcal/day, while physical activity level (PAL) was calculated as the ratio of total daily energy expenditure to basal metabolic rate (BMR) defined as 1 kcal/kg/hour.
The severity of IBS symptoms and patients’ quality of life were also evaluated both pre- and post-intervention. IBS symptomatology was assessed through the IBS Symptom Severity Scale (IBS-SSS) [24], a 5-item questionnaire that evaluates typical IBS clinical manifestations, i.e., the severity of abdominal pain, frequency of abdominal pain, severity of abdominal distention, dissatisfaction with bowel habits, and interference with quality of life, over the past 10 days. Each individual item is rated on a 100-point visual analogue scale, and the total IBS-SSS score ranges from 0 to 500, with higher values corresponding to more severe symptoms. Based on IBS-SSS score, participants were further categorized as having mild (< 175), moderate (175-300) or severe (>300) IBS. Quality of life was assessed through the IBS Quality of Life (IBS-QOL) [25-27], a 34-item questionnaire that assesses the level of interference between IBS and quality of life over the past month. Each individual item is rated on a Likert response scale to assess how much the statement applies to the respondent, i.e., 1=not at all, 2=slightly, 3=moderately, 4=quite a bit, and 5=extremely or a great deal. Scores of individual items are summed to comprise eight subscales, i.e., dysphoria, interference with activity, body image, health worry, food avoidance, social reaction, sexual, and relationship, and all subscales are finally summed to form a total score ranging from 34 to 170, with higher values corresponding to a more impaired quality of life. In addition, participants were evaluated in terms of IBS Adequate Relief (IBS-AR) [28] weekly, through a simple (yes/no) question: “In the last 7 days, have you had adequate relief of your IBS pain and discomfort?”. Adequate relief was defined as a positive answer for at least half of the intervention period (≥6 of 12 weeks).
Fasting blood samples (12-h) were collected and serum/plasma aliquots were immediately frozen at -80oC until analysis. Lipidemic profile indices, namely total cholesterol (TC) (mg/dL), high-density lipoprotein cholesterol (HDLC) (mg/dL) and triglycerides (TG) (mg/dL) were measured in plasma by an enzymatic colorimetric assay (COBAS® 8000 analyzer; F. Hoffmann-La Roche Ltd, Basel, Switzerland). low-density lipoprotein cholesterol (LDLC) (mg/dL) was calculated using the Friedewald formula [29]. Fasting glucose (mg/dL) was measured in plasma by an enzymatic colorimetric assay (COBAS® 8000 analyzer; F. Hoffmann-La Roche Ltd, Basel, Switzerland), insulin (μU/mL) was measured in plasma by chemiluminescence (E170 modular analyzer; F. Hoffmann-La Roche Ltd, Basel, Switzerland) and insulin resistance was assessed through the Homoeostasis Model Assessment (HOMA-IR) based on the formula of Matthews et al. [30]. Liver enzymes, i.e., gamma-glutamyl transpeptidase (GGT) (U/L), alanine transferase (ALT) (U/L) and aspartate transferase (AST) (U/L), were measured in plasma by an enzymatic colorimetric method (COBAS® 8000 analyzer; F. Hoffmann-La Roche Ltd, Basel, Switzerland). High sensitivity CRP (hsCRP) (mg/L) levels were measured in plasma by nephelometry (nephelometric analyzer BN II System, Siemens Healthineers AG, Erlangen, Germany). Plasma interleukin-6 (IL-6) was measured by an electrochemiluminescence immunoassay (Elecsys IL-6, Cobas E801, Roche Diagnostics GmbH, and Mannheim, Germany). Plasma malondialdehyde (MDA) was measured by high-performance liquid chromatography (Chromsystems Instruments & Chemicals GmbH, Gräfelfing, Germany), while total antioxidant capacity (TAC) was determined through a photometric assay (ImAnOx® TAC Kit, Immundiagnostik AG, Bensheim, Germany) based on the reaction of antioxidants in patients’ serum samples with a defined amount of exogenously provided hydrogen peroxide. Participants’ systolic blood pressure (SBP) and diastolic blood pressure (DBP) were also measured in the left arm with an automatic blood pressure monitor operating on the oscillometric principle (OMRON HEM-7130, Kyoto, Japan) according to a standardized protocol (measurements were performed with the subject sitting at rest, after a 12-h fasting period and at least 30 min without engaging in any kind of physical activity or smoking) [31]. Two blood pressure measurements were taken from each participant separated by a 2-min interval, and their average was used for analyses. Metabolic syndrome was defined as the co-presence of at least 3 of the following [32]: (i) WC >102 cm for males and >88 cm for females; (ii) plasma HDLC < 40 mg/dL for males and < 50 mg/dL for females, or use of relevant medication; (iii) plasma TG levels ≥ 150 mg/dL or use of hypotriglyceridemic drugs; (iv) fasting plasma glucose levels ≥ 100 mg/dL or use of antidiabetic drugs; and (v) SBP ≥ 130 mm Hg and/or DBP ≥ 85 mm Hg, or use of antihypertensive drugs.
At the end of the 3-month intervention, participants were also asked to evaluate the study drinks through a questionnaire. The questionnaire included seven questions: 1) “how would you rate the smell/aroma of the study drinks?” (very bad, bad, mediocre, good, very good); 2) “how would you rate the taste of the study drinks?” (very bad, bad, mediocre, good, very good); 3) “how would you rate the aftertaste of the study drinks?” (very bad, bad, mediocre, good, very good); 4) “how would you rate the texture of the study drinks?” (very bad, bad, mediocre, good, very good); 5) “how likely is it that you would continue consuming the study drinks after the end of the study?” (not at all, a little, moderately, very, definitely); 6) “how likely is it that you would recommend the study drinks to your social environment (e.g., family and friends)?” (not at all, a little, moderately, very, definitely); and 7) “how satisfied are you with the study drinks on a scale of 1 (not at all) to 10 (very much)?”. Participants were also given a blank space to freely report any comments, suggestions or concerns.
Statistical analyses
The primary endpoint of the MASTIQUA study was the severity of IBS symptoms, assessed through the IBS-SSS. Assuming a moderate severity of IBS at baseline (IBS-SSS score of ~250), taking into account the expected effectiveness of the intervention applied on IBS symptoms based on previously published data [12], and considering a 30% decrease in IBS-SSS as clinically significant, it was estimated that ~12 patients per group (48 patients plus 15-20% dropout rate) would be sufficient to obtain ≥ 80% power to detect a significant difference in IBS-SSS values between intervention arms (LDMG and HDMG) and control arms (LDCG and HDCG) at the end of the 3-month study, allowing for a type-I error rate of 0.05. Secondary endpoints induced patients’ quality of life (IBS-QOL) and cardiometabolic, inflammatory and oxidative stress indices.
Statistical analysis was performed using SPSS version 25 (IBM Corp. 2017, Armonk, NY, USA). The statistical significance threshold was set at 0.05. The normality of continuous variables was evaluated through the Shapiro-Wilk test. Categorical variables are presented as relative (absolute) frequencies, normally distributed continuous variables as mean ± standard deviation, and skewed continuous variables as median (1st, 3rd quartile). Changes within groups were tested using the McNemar test for categorical variables, the paired-samples t-test for normally distributed continuous variables or the Wilcoxon signed rank test for skewed continuous variables. Differences between groups were tested using the Chi-square test for categorical variables, the one-way analysis of variance for normally distributed continuous variables and the Kruskal-Wallis test for skewed continuous variables; when differences between groups were statistically significant, post hoc pairwise comparisons were performed and the Bonferroni correction was applied to adjust for multiplicity. Analyses were performed according to the intention to treat principle and missing values were predicted by fitting a statistical model to the observed data with the use of missing-at-random method [33]. In specific, for every endpoint, a statistical equation linking baseline and post-intervention data was created for each of the four study groups based on the actual data of study completers. The equations were then used to predict missing data for dropouts at the 3-month follow-up.
Results
Recruitment and randomization
The detailed trial flowchart is presented in Figure 1. A total of 82 patients with an IBS diagnosis based on the ROME IV criteria were prospectively screened for eligibility by the research dietitian. Of the 82 candidates, 15 were non-eligible (e.g., underweight or morbidly obese, diagnosis of other diseases, currently on a weight-loss diet, recent significant changes in lifestyle habits or current use of Chios mastic supplements), and another 12 declined to undergo evaluation and commit to the study due to various reasons (lack of time, increased burden of family or work responsibilities, living in a different city, seeking dietary advice for weight loss, etc.). The remaining 55 patients were informed in detail about the aims and procedures of the study, provided a signed written consent form, and were blindly randomized in one of the four study groups, i.e., 13 in the LDMG, 13 in the LDCG, 15 in the HDMG and 14 in the HDCG.
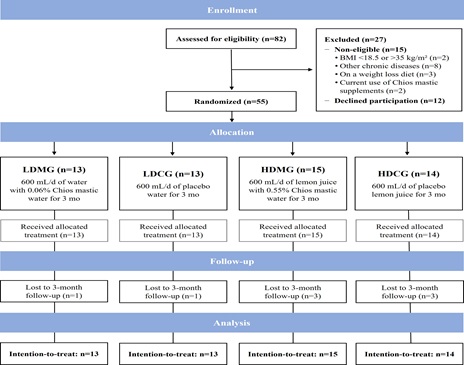 Figure 1: Trial flow diagram.
From September 2021 to January 2022, 82 patients were prospectively screened on the basis of an IBS diagnosis based on the ROME IV criteria (20 were referred from the gastroenterology outpatient clinic of Laiko General Hospital of Athens and the rest 62 responded to print and social media advertisements of the study in the region of Attica). Of the 82 patients, 15 were excluded and another 12 declined to participate in the study, while the remaining 55 patients were enrolled and randomly allocated to one of the four study groups. A total of 8 patients dropped out, while 47 patients successfully completed the study and participated in the follow-up. The study officially ended in April 2022 when all randomized participants were re-evaluated at 3 months after study initiation.
BMI, body mass index; HDCG, high-dose control group; HDMG, high-dose mastic group; IBS: irritable bowel syndrome; LDCG, low-dose control group; LDMG, low-dose mastic group.
Baseline characteristics of the study population
The baseline sociodemographic, anthropometric, lifestyle and clinical characteristics of the study population are presented in Table 3. Participants’ mean age was 43.5 ± 12.2 years and the majority were women (74.5%), non-smokers (65.5%), employed (80.0%), had a low-to-medium financial status (76.3%) and a moderate-to-high educational status (mean years of education: 16.8 ± 3.5). Median (1st, 3rd quartile) IBS duration was 12 (7, 17) years, and the most common disease phenotype was IBS-M (36.4%), followed by IBS-C (30.9%) and IBS-D (25.5%). Patients’ median (1st, 3rd quartile) IBS-SSS score was 219 (157, 270) indicating a mild-to-moderate severity of IBS symptoms, while median (1st, 3rd quartile) IBS-QOL score was 66 (55, 92) indicating a mild impairment of quality of life. Most enrolled patients did not receive medication for IBS (9.1% received antispasmodics and 3.6% received laxatives), while more than half (56.4%) were regular users of dietary supplements (54.5% used vitamins, minerals or various combinations of micronutrients, and 10.9% used probiotics). Besides IBS, 23.6% of participants had dyslipidemia, 5.5% had hypertension and only 3.6% fulfilled the criteria for the presence of metabolic syndrome. Participants’ mean BMI was 25.1±4.4 kg/m2 (52.7% were normal-weight, while 47.3% were overweight/obese), mean fat mass was 29.6 ± 8.9%, 21.8% had increased WC and 47.3% had increased WHtR indicative of abdominal fat accumulation. Regarding dietary and lifestyle parameters, participants’ total energy intake based on the FFQ was 2362 ± 582 kcal/day and total energy expenditure extracted from APAQ was 2051 ± 342 kcal/day. Moreover, adherence to Mediterranean dietary pattern was moderate according to mean MedDietScore values (32.7 ± 5.1), while median (1st, 3rd quartile) PAL was 1.38 (1.31, 1.52) indicative of a mild-to-moderate physical activity level. Comparisons between the four study groups did not reveal statistically significant differences in participants’ baseline sociodemographic, medical, anthropometric, lifestyle and clinical characteristics, except from baseline total daily energy intake which was higher in patients of the LDCG compared to the HDMG (p-value=0.032) (Table 3).
|
|
Total (n=55) |
LDMG (n=13) |
LDCG (n=13) |
HDMG (n=15) |
HDCG (n=14) |
p-value* |
|
Sex, n (%) |
|
|
|
|
|
0.948 |
|
Males |
14 (25.5) |
3 (23.1) |
4 (30.8) |
4 (26.7) |
3 (21.4) |
|
|
Females |
41 (74.5) |
10 (76.9) |
9 (69.2) |
11 (73.3) |
11 (78.6) |
|
|
Age, years |
43.5 ± 12.2 |
43 ± 10 |
45 ± 12 |
43 ± 14 |
43 ± 13 |
0.981 |
|
Type of occupation, n (%) |
|
|
|
|
|
0.793 |
|
State employee |
13 (23.6) |
3 (23.1) |
3 (23.1) |
3 (20.0) |
4 (28.6) |
|
|
Private employee |
20 (36.4) |
5 (38.5) |
4 (30.8) |
5 (33.3) |
6 (42.9) |
|
|
Self-employed |
11 (20.0) |
4 (30.8) |
3 (23.1) |
3 (20.0) |
1 (7.1) |
|
|
Retired |
5 (9.1) |
0 (0.0) |
2 (15.4) |
1 (6.7) |
2 (14.3) |
|
|
Housekeeper |
2 (3.6) |
1 (7.7) |
0 (0.0) |
1 (6.7) |
0 (0.0) |
|
|
Student |
3 (5.5) |
0 (0.0) |
1 (7.7) |
2 (13.3) |
0 (0.0) |
|
|
Unemployed |
1 (1.8) |
0 (0.0) |
0 (0.0) |
0 (0.0) |
1 (7.1) |
|
|
Education, years |
16.8 ± 3.5 |
16.2 ± 3.5 |
18.9 ± 4.1 |
15.7 ± 3.2 |
16.5 ± 2.4 |
0.066 |
|
Financial status, n (%) |
|
|
|
|
|
0.527 |
|
Low |
19 (34.5) |
6 (46.1) |
4 (30.8) |
6 (40.0) |
3 (21.4) |
|
|
Medium |
23 (41.8) |
4 (30.8) |
5 (38.4) |
7 (46.7) |
7 (50.0) |
|
|
High |
13 (23.7) |
3 (23.1) |
4 (30.8) |
2 (13.3) |
4 (28.6) |
|
|
Smoking status, n (%) |
|
|
|
|
|
0.487 |
|
Smokers |
13 (23.6) |
1 (7.7) |
4 (30.8) |
4 (26.7) |
4 (28.6) |
|
|
Non-smokers |
36 (65.5) |
9 (69.2) |
9 (69.1) |
9 (60.0) |
9 (64.3) |
|
|
Former smokers |
6 (10.9) |
3 (23.1) |
0 (0.0) |
2 (13.3) |
1 (7.1) |
|
|
MedDietScore (0-55) |
32.7 ± 5.1 |
33.9 ±5.9 |
32.0 ± 4.1 |
32.7 ± 5.4 |
32.3 ± 5.2 |
0.791 |
|
Energy intake, kcal/d |
2362 ± 582 |
2496 ± 582 |
2676 ± 673a |
2086 ± 493b |
2241 ± 440 |
0.032 |
|
Energy expenditure, kcal/d |
2051 ± 342 |
1976 ± 279 |
2096 ± 383 |
2011 ± 300 |
2122 ± 410 |
0.656 |
|
PAL |
1.38 (1.31, 1.52) |
1.38 (1.31, 1.45) |
1.41 (1.31, 1.47) |
1.35 (1.21, 1.53) |
1.39 (1.34, 1.55) |
0.714 |
|
Disease duration, years |
12 (7, 17) |
12 (12, 16) |
10 (5, 13) |
10 (7, 22) |
12 (6, 17) |
0.267 |
|
Type of IBS, n (%) |
|
|
|
|
|
0.955 |
|
IBS-D |
14 (25.5) |
3 (23.1) |
3 (23.1) |
5 (33.3) |
3 (21.4) |
|
|
IBS-C |
17 (30.9) |
5 (38.5) |
4 (30.8) |
3 (20.0) |
5 (35.7) |
|
|
IBS-M |
20 (36.4) |
5 (38.5) |
5 (38.5) |
5 (33.3) |
5 (35.7) |
|
|
IBS-U |
4 (7.3) |
0 (0.0) |
1 (7.7) |
2 (13.3) |
1 (7.1) |
|
|
IBS-SSS score (0-500) |
219 (157, 270) |
195 (154, 285) |
219 (148, 260) |
205 (170, 270) |
234 (145, 331) |
0.781 |
|
IBS-SSS categories, n (%) |
|
|
|
|
|
0.644 |
|
Mild (<175) |
20 (36.4) |
6 (46.2) |
4 (30.8) |
5 (33.3) |
5 (35.7) |
|
|
Moderate (175-300) |
27 (49.1) |
6 (46.2) |
8 (61.5) |
8 (53.3) |
5 (35.7) |
|
|
Severe (>300) |
8 (14.5) |
1 (7.7) |
1 (7.7) |
2 (13.3) |
4 (28.6) |
|
|
IBS-QOL score (34-170) |
66 (55, 92) |
65 (50, 98) |
68 (57, 87) |
61 (57, 89) |
78 (65, 107) |
0.540 |
|
Use of antispasmodics, n (%) |
5 (9.1) |
0 (0.0) |
2 (15.4) |
1 (6.7) |
2 (14.3) |
0.562 |
|
Use of antidiarrheals, n (%) |
0 (0.0) |
0 (0.0) |
0 (0.0) |
0 (0.0) |
0 (0.0) |
>0.999 |
|
Use of laxatives, n (%) |
2 (3.6) |
2 (15.4) |
0 (0.0) |
0 (0.0) |
0 (0.0) |
0.082 |
|
Use of supplements, n (%) |
31 (56.4) |
8 (61.5) |
9 (69.2) |
7 (46.7) |
7 (50.0) |
0.800 |
|
Vitamins and minerals |
30 (54.5) |
6 (46.2) |
9 (69.2) |
6 (40.0) |
9 (64.3) |
0.345 |
|
Probiotics |
6 (10.9) |
2 (15.4) |
2 (15.4) |
1 (6.7) |
1 (7.1) |
0.844 |
|
BMI, kg/m2 |
25.1 ± 4.4 |
23.7 ± 2.9 |
25.9 ± 5.1 |
25.2 ± 3.8 |
25.8 ± 5.4 |
0.565 |
|
BMI categories, n (%) |
|
|
|
|
|
0.401 |
|
Normal-weight |
29 (52.7) |
10 (76.9) |
6 (46.2) |
7 (46.7) |
6 (42.9) |
|
|
Overweight |
20 (36.4) |
3 (23.1) |
6 (46.2) |
5 (33.3) |
6 (42.9) |
|
|
Obese |
6 (10.9) |
0 (0.0) |
1 (7.7) |
3 (20.0) |
2 (14.2) |
|
|
WC, cm |
83.2 ± 12.4 |
81.2 ± 11.1 |
85.3 ± 14.6 |
81.7 ± 10.3 |
84.8 ± 14.1 |
0.773 |
|
Increased WC, n (%) |
12 (21.8) |
2 (15.4) |
3 (23.1) |
4 (26.7) |
3 (21.4) |
0.911 |
|
WHtR |
0.50 ± 0.07 |
0.49 ± 0.06 |
0.51 ± 0.08 |
0.50 ± 0.07 |
0.52 ± 0.09 |
0.831 |
|
Increased WHtR, n (%) |
26 (47.3) |
6 (46.2) |
5 (38.5) |
8 (53.3) |
7 (50.0) |
0.879 |
|
Fat mass, % |
29.6 ± 8.9 |
26.2 ± 6.4 |
29.7 ± 10.5 |
30.2 ± 9.2 |
32.1 ± 8.9 |
0.383 |
|
Fat-free mass, kg |
48.3 ± 9.8 |
48.1 ± 8.7 |
52.3 ± 14.1 |
46.8 ± 8.6 |
46.6 ± 7.0 |
0.745 |
|
Visceral fat rating |
6.0 (3.0, 9.0) |
6.0 (3.0, 6.0) |
7.0 (4.0, 9.8) |
8.0 (3.0, 9.0) |
6.5 (2.8, 11) |
0.428 |
|
SBP, mmHg |
121 ± 12 |
118 ± 12 |
121 ± 12 |
127 ± 12 |
116 ± 12 |
0.105 |
|
DBP, mmHg |
71 ± 7 |
69 ± 10 |
72 ± 5 |
74 ± 5 |
70 ± 7 |
0.195 |
|
Hypertension, n (%) |
3 (5.5) |
0 (0.0) |
1 (7.7) |
1 (6.7) |
1 (7.1) |
0.802 |
|
Dyslipidemia, n (%) |
13 (23.6) |
4 (30.8) |
4 (30.8) |
3 (20.0) |
2 (14.3) |
0.677 |
|
Metabolic syndrome, n (%) |
2 (3.6) |
0 (0.0) |
1 (7.7) |
1 (6.7) |
0 (0.0) |
0.588 |
Table 3: Descriptive characteristics of the study population.
Data are presented as absolute (relative) frequencies for categorical variables, mean ± standard deviation for normally distributed continuous variables, and median (1st, 3rd quartile) for skewed continuous variables.
* p-value for differences between study groups at baseline, as derived from the chi-square test (for categorical variables), the one-way ANOVA (for normally distributed continuous variables) or the Kruskal-Wallis test (for skewed continuous variables). a,bDifferent superscripts indicate statistically significant differences between groups according to post-hoc pairwise comparisons. The Bonferroni correction was applied to adjust for multiplicity.
BMI, body mass index; DBP, diastolic blood pressure; HDCG, high-dose control group; HDMG, high-dose mastic group; IBS: irritable bowel syndrome; IBS-C, irritable bowel syndrome with constipation; IBS-D, irritable bowel syndrome with diarrhea; IBS-M, irritable bowel syndrome mixed type (diarrhea and constipation); IBS-U, irritable bowel syndrome unspecified; IBS-QOL, irritable bowel syndrome quality of life questionnaire; IBS-SSS, irritable bowel syndrome symptom severity scale; LDCG, low-dose control group; LDMG, low-dose mastic group; PAL, physical activity level; SBP, systolic bool pressure; WC, waist waist circumference; WHtR, waist circumference to height ratio.
Study flow, adherence to intervention goals and side-effects
During the 3-month study, 8 patients (14.5%) dropped out (1 from the LDMG, 1 from the LDCG, 3 from the HDMG and 3 from the HDCG). Of those, 3 were unable to commit to the intervention and 5 did not participate in the 3-month follow-up (could not be reached to schedule an appointment or refused to be re-evaluated). Adherence to the intervention was high for all study groups, based on the mean number of drinks consumed during the 3-month period out of the total 270 drinks provided to each participant (LDMG: 246 ± 23; LDCG: 243 ± 7, HDMG: 252 ± 13; HDCG: 251 ± 18, p-value=0.468). Moreover, during the 3-month study, no significant changes were observed in participants’ body weight [LDMG: from 64.9 ± 9.5 kg to 65.9 ± 9.3 kg, p-value=0.121; LDCG: from 72.5 ± 18.1 kg to 73.7 ± 18.2 kg, p-value=0.094; HDMG: from 67.4 ± 11.2 kg to 67.8 ± 11.2 kg, p-value=0.424; HDCG: from 69.6 ± 13.4 kg to 70.3 ± 14.2 kg, p-value=0.332], BMI [LDMG: from 23.7 ± 2.9 kg/m2 to 24.0 ± 2.6 kg/m2, p-value=0.142; LDCG: from 25.9 ± 5.1 kg/m2 to 26.3 ± 5.2 kg/m2, p-value=0.109; HDMG: from 25.2 ± 3.8 kg/m2 to 25.4 ± 4.0 kg/m2, p-value=0.368; HDCG: from 25.8 ± 5.4 kg/m2 to 26.0 ± 5.5 kg/m2, p-value=0.345], or life style habits (data not shown).
No significant side-effects related to study drinks were reported by participants, except from a mild feeling of postprandial fullness during the first weeks of the study reported by 3 patients (1 in the LDMG, 1 in the HDMG and 1 in the HDCG) who consumed the study drinks with main meals (lunch and dinner). In addition, 6 female participants (1 in the LDMG, 2 in the LDCG, 2 in the HDMG and 1 in the HDCG) reported abdominal cramping and bloating on specific days of the study period, but these symptoms were also accompanied by food cravings, mood swings, irritability, headaches and fatigue, and were attributed to menstruation.
Symptoms and quality of life related to irritable bowel syndrome
Changes (baseline vs. 3 months) within each study group in the severity of gastrointestinal symptoms and quality of life related to IBS are presented in Table 4. Control arms (LDCG and HDCG) did not present any significant changes throughout the study (all p-values > 0.050). On the contrary, intervention arms exhibited significant improvements in most individual items of the IBS-SSS, i.e., severity of abdominal pain, dissatisfaction with bowel habits and interference with quality of life (all p-values< 0.050), and a significant decline in the median (1st, 3rd quartile) total IBS-SSS score [LDMG: from 195 (154, 285) to 145 (108, 186), p-value=0.005, HDMG: from 205 (170, 270) to 130 (95, 175), p-value=0.001]. With regard to quality of life, a significant improvement or a trend for improvement was observed in most individual items of the IBS-QOL questionnaire, except from the sexual and relationship domains, both in the LDMG and the HDMG. Moreover, intervention groups presented an improvement in total median (1st, 3rd quartile) IBS-QOL score at the end of the study [LDMG: from 65 (50, 98) to 57 (46, 65), p-value=0.045, HDMG: from 68 (57, 89) to 50 (40, 69), p-value=0.009].
|
|
LDMG (n=13) |
LDCG (n=13) |
HDMG (n=15) |
HDCG (n=14) |
p-value** |
||||||||
|
|
Baseline |
3 months |
p-value* |
Baseline |
3 months |
p-value* |
Baseline |
3 months |
p-value* |
Baseline |
3 months |
p-value* |
|
|
Symptom severity (IBS-SSS) |
|
|
|
|
|
|
|
|
|
|
|
|
|
|
I1. Severity of abdominal pain (0-100) |
44 (20, 63) |
22 (5.0, 35) a |
0.035 |
45 (25, 50) |
40 (25, 55) b |
0.481 |
36 (25, 50) |
|
0.013 |
50 (19, 56) |
45 (38, 50) b |
0.799 |
<0.001 |
|
I2. Frequency of abdominal pain (0-100) |
36 (15, 50) |
24 (7.5, 36) a |
0.268 |
30 (15, 35) |
30 (23, 48) b |
0.243 |
30 (20, 40) a |
20 (10, 25) |
0.017 |
25 (7.5, 43) |
45 (30, 50) b |
0.067 |
<0.001 |
|
I3. Severity of abdominal distention (0-100) |
50 (25, 75) |
32 (15, 45) a |
0.037 |
38 (25, 50) |
50 (28, 67) b |
0.161 |
39 (25, 50) |
25 (10, 55) a |
0.053 |
50 (25, 75) |
57 (25, 75) b |
0.432 |
0.001 |
|
I4. Dissatisfaction with bowel habits (0-100) |
33 (33, 76) |
30 (18, 34) a |
0.025 |
50 (33, 67) |
42 (33, 50) b |
0.261 |
50 (33, 67) |
22 (10, 33) a |
0.039 |
67 (33, 93) |
42 (31, 64) b |
0.328 |
0.004 |
|
I5. Interference with quality of life (0-100) |
50 (32, 67) |
25 (15, 33) a |
0.015 |
60 (37, 67) |
50 (39, 67) b |
0.562 |
58 (50, 67) |
25 (20, 33) a |
0.001 |
52 (33, 75) |
59 (50, 70) b |
0.752 |
<0.001 |
|
Total IBS-SSS (0-500) |
195 (154, 285) |
145 (108, 186)a |
0.005 |
219 (148, 260) |
211 (187, 246)b |
0.780 |
205 (170, 270) |
130 (95, 175) a |
0.001 |
234 (145, 331) |
228 (200, 293) b |
0.778 |
<0.001 |
|
IBS-SSS categories, n (%) Mild (<175) |
6 (46.2) 6 |
11 (84.6) a 2 |
<0.001 |
4 (30.8) 8 |
5 (38.5) b 8 |
0.872 |
5 (33.3) 8 |
12 (80.0) a 3 |
<0.001 |
5 (35.7) 5 |
5 (35.7) b 7 |
0.729 |
<0.001 |
|
Moderate (175-300) |
(46.2) 1 |
(15.4) a 0 |
|
(61.5) 1 |
(61.5) b 0 |
|
(53.4) 2 |
(20.0) a 0 |
|
(35.7) 4 |
(50.0) b 2 |
|
|
|
Severe (>300) |
(7.6) |
(0.0) |
|
(7.7) |
(0.0) |
|
(13.3) |
(0.0) |
|
(28.6) |
(14.3) |
|
|
|
Quality of life (IBS-QOL) |
|
|
|
|
|
|
|
|
|
|
|
|
|
|
I1. Dysphoria (8-40) |
11 (9.5, 21) |
10 (8.5, 15) a |
0.033 |
14 (12, 18) |
14 (12, 19) a,b |
0.419 |
13 (11, 21) |
11 (10, 16) a |
0.008 |
18 (12, 25) |
18 (15, 20) b |
0.888 |
0.005 |
|
I2. Interference with activity (7-35) |
13 (10, 20) |
12 (9.5, 14) a |
0.067 |
15 (13, 17) |
15 (13, 20) b |
0.721 |
14 (12, 17) |
12 (10, 15) a |
0.081 |
17 (13, 26) |
18 (15, 24) b |
0.562 |
<0.001 |
|
I3. Body image (4-20) |
7.0 (6.0, 9.5) |
6.0 (5.0, 6.5) a |
0.036 |
8.0 (4.5, 12) |
8.0 (6.5, 10.0) b,c |
0.403 |
7.0 (5.0, 9.0) |
6.0 (5.0, 7.0) a,b |
0.024 |
9.5 (5.8, 12) |
10 (7.8, 12) c |
0.553 |
0.001 |
|
I4. Health worry (3-15) |
5.0 (4.0, 9.0) |
4.0 (3.5, 6.0) |
0.056 |
6.0 (4.5, 8.0) |
6.0 (4.5, 7.5) |
0.165 |
6.0 (5.0, 9.0) |
5.0 (4.0, 6.0) |
0.044 |
6.0 (4.5, 10) |
7.0 (4.8, 9.3) |
>0.999 |
0.527 |
|
I5. Food avoidance (3-15) |
6.0 (5.5, 12) |
6.0 (4.0, 7.0) a |
0.083 |
10 (7.0, 12) |
10 (8.0, 11) b,c |
0.634 |
9.0 (7.0, 11) |
7.0 (6.0, 10) a,b |
0.054 |
11 (7.8, 11) |
11 (8.0, 12) c |
0.734 |
0.001 |
|
I6. Social reaction (4-20) |
7.0 (5.5, 11) |
6.0 (4.5, 8.0) |
0.074 |
7.0 (4.0, 10) |
8.0 (5.5, 11) |
0.634 |
8.0 (6.0, 10) |
6.0 (5.0, 8.0) |
0.034 |
8.5 (5.8, 12) |
7.5 (5.8, 11) |
0.307 |
0.303 |
|
I7. Sexual (2-10) |
4.0 (2.0, 7.0) |
3.0 (2.5, 4.0) a,b |
0.192 |
5.0 (2.5, 6.0) |
5.0 (2.5, 6.0) a |
0.660 |
3.0 (2.0, 4.0) |
3.0 (2.0, 4.0) b |
0.739 |
5.0 (2.0, 6.0) |
5.0 (2.8, 6.0) a |
0.943 |
0.041 |
|
I8. Relationship (3-15) |
6.0 (3.5, 8.5) |
5.0 (4.0, 6.5) |
0.242 |
4.0 (3.0, 6.5) |
6.0 (3.0, 7.5) |
0.438 |
4.0 (3.0, 5.0) |
4.0 (3.0, 5.0) |
0.903 |
6.5 (3.0, 8.0) |
6.0 (4.0, 8.0) |
0.757 |
0.415 |
|
Total IBS-QOL (34-170) |
65 (50, 98) |
57 (46, 65) a |
0.045 |
68 (57, 97) |
73 (60, 81) b |
0.889 |
61 (57, 89) |
50 (40, 69) a |
0.009 |
78 (65, 107) |
76 (70, 95) b |
0.959 |
<0.001 |
Table 4: Within group changes and between group differences in the severity of symptoms and quality of life related to irritable bowel syndrome according to intention to treat analysis (n=55).
Data are presented as absolute (relative) frequencies for categorical variables or median (1st, 3rd quartile) for continuous variables.
* p-value for changes within groups (baseline vs. 3-month follow-up), as derived from the McNemar test for categorical variables and Wilcoxon signed ranked test for continuous variables. ** p-value for differences between study groups at the 3-month follow-up, as derived from the chi-square test for categorical variables or Kruskal-Wallis test for continuous variables. a,b,c Different superscripts indicate statistically significant differences between groups according to post-hoc pairwise comparisons. The Bonferroni correction was applied to adjust for multiplicity.
HDCG, high-dose control group; HDMG, high-dose mastic group; IBS-QOL, irritable bowel syndrome quality of life questionnaire; IBS-SSS, irritable bowel syndrome symptom severity scale; LDCG, low-dose control group; LDMG, low-dose mastic group.
Differences between study groups in the severity of gastrointestinal symptoms and quality of life related to IBS at the end of the study are also presented in Table 4. In specific, significant between-group differences were observed in the total IBS-SSS score and all its individual items, as well as IBS-SSS categories (all p-values <0.001); patients of both the LDMG and the HDMG presented lower total IBS-SSS score and higher rates of mild symptom severity according to IBS-SSS categorization (IBS-SSS <175) compared to those in the LDCG and the HDCG (all p-values<0.010). In addition, out of the total 12 weeks of intervention, the mean number of weeks with adequate relief of IBS pain and discomfort were 7.50 ± 1.62 for the LDMG, 5.75 ± 2.01 for the LDCG, 8.08 ± 1.78 for the HDMG and 4.64 ± 1.75 for the HDCG (p-value=0.022); the corresponding percentage of patients with adequate relief (≥ 6 weeks) were 83.3%, 50.0%, 75.0% and 36.4%, respectively (p-value<0.001). With regard to quality of life, significant differences between groups were observed in the total IBS-QOL score and most of its individual domains (except from health worry, social reaction and relationship), with intervention arms presenting lower values (indicative of improved quality of life) compared to control arms at the 3-month follow-up (all p-values < 0.01). Pairwise post-hoc comparisons between intervention arms revealed a similar symptom severity and quality of life profile (all p-values>0.050 for comparisons between the LDMG and the HDMG).
Cardiometabolic profile, inflammatory and oxidative stress indices
Within-group changes and between-group differences in blood pressure, biochemical, and inflammatory and oxidative stress indices are presented in Table 5. No statistically significant changes within groups or differences between groups were observed in SBP, DBP, fasting glucose, insulin, HOMA-IR, ALT, AST and GGT (all p-values>0.050). Similarly, changes within groups and differences between groups in lipidemic profile indices were non-significant, except from an increase in mean HDLC levels observed in the LDMG (from 59 ± 17 mg/dL to 64 ± 18 mg/dL, p=0.043). With regard to inflammatory and oxidative stress markers, median (1st, 3rd quartile) IL-6 and mean TAC levels improved in the HDMG [from 2.2 (1.5, 3.0) to 1.5 (1.3, 1.9) pg/mL, p=0.017, and from 286 ± 22 to 315 ± 27 μmol/L, p=0.045, respectively] and a trend for an increase in mean TAC was also observed in the LDMG (from 290 ± 36 to 310 ± 34 μmol/L, p-value=0.056). Between groups, a significant difference at 3 months was observed only in hsCRP levels (p-value=0.022), with the LDMG presenting lower values compared to the LDCG (p-value=0.013), and IL-6 levels (p-value=0.036), with the HDMG presenting lower values compared to both the LDCG (p-value=0.005) and the HDCG (p-value=0.042).
|
|
LDMG (n=13) |
LDCG (n=13) |
HDMG (n=15) |
HDCG (n=14) |
p-value** |
||||||||
|
|
Baseline |
3 months |
p-value* |
Baseline |
3 months |
p-value* |
Baseline |
3 months |
p-value* |
Baseline |
3 months |
p-value* |
|
|
Blood pressure |
|
|
|
|
|
|
|
|
|
|
|
|
|
|
SBP, mmHg |
118 ± 12 |
119 ± 12 |
0.695 |
121 ± 2 |
127 ± 11 |
0.213 |
127 ± 12 |
122 ± 13 |
0.666 |
116 ± 12 |
117 ± 14 |
0.444 |
0.226 |
|
DBP, mmHg |
69 ± 10 |
72 ± 11 |
0.346 |
72 ± 5 |
74 ± 8 |
0.878 |
74 ± 6 |
74 ± 9 |
0.695 |
70 ± 7 |
71 ± 9 |
0.799 |
0.810 |
|
Glucose metabolism |
|
|
|
|
|
|
|
|
|
|
|
|
|
|
Glucose, mg/dL |
78 ± 7 |
80 ± 11 |
0.456 |
80 ± 8 |
86 ± 5 |
0.054 |
81 ± 8 |
83 ± 8 |
0.294 |
82 ± 9 |
85± 9 |
0.108 |
0.181 |
|
Insulin, μU/mL |
7.1 (5.0, 8.3) |
6.8 (4.9, 8.4) |
0.530 |
6.3 (5.0, 10) |
8.3 (6.9, 13) |
0.209 |
6.9 (4.2, 13) |
8.0 (6.2, 8.3) |
0.950 |
6.4 (5.3, 9.6) |
7.0 (5.6, 8.8) |
0.286 |
0.170 |
|
HOMA-IR |
1.3 (1.0, 1.7) |
1.2 (0.8, 1.8) |
0.507 |
1.2 (0.9, 1.9) |
1.9 (1.5, 2.7) |
0.084 |
1.3 (0.8, 2.6) |
1.5 (1.4, 1.7) |
0.975 |
1.2 (1.0, 2.0) |
1.4 (1.1, 1.9) |
0.790 |
0.087 |
|
Lipidemic profile |
|
|
|
|
|
|
|
|
|
|
|
|
|
|
TC, mg/dL |
180 ± 31 |
186 ± 40 |
0.422 |
180 ± 29 |
178 ± 30 |
0.755 |
176 ± 26 |
176 ± 23 |
0.916 |
174 ± 35 |
178 ± 38 |
0.953 |
0.950 |
|
LDLC, mg/dL |
107 ± 30 |
111 ± 35 |
0.463 |
102 ± 25 |
101 ± 25 |
>0.999 |
104 ± 22 |
95 ± 34 |
0.778 |
103 ± 33 |
100 ± 2 |
0.790 |
0.774 |
|
TG, mg/dL |
69 (47, 99) |
64 (42, 79) |
0.100 |
77 (67, 102) |
74 (56, 107) |
0.367 |
75 (47, 81) |
77 (55, 103) |
0.330 |
72 (60, 85) |
73 (56, 97) |
0.505 |
0.574 |
|
Liver enzymes |
|
|
|
|
|
|
|
|
|
|
|
|
|
|
ALT, U/L |
17 (16, 20) |
20 (17, 22) |
0.344 |
18 (14, 22) |
19 (16, 24) |
0.497 |
19 (14, 21) |
18 (14, 19) |
0.474 |
15 (13, 21) |
16 (14, 20) |
0.837 |
0.126 |
|
AST, U/L |
16 (13, 20) |
18 (14, 19) |
0.665 |
19 (12, 31) |
18 (14, 33) |
0.721 |
17 (15, 21) |
17 (12, 20) |
0.801 |
14 (9.8, 19) |
13 (10, 18) |
0.592 |
0.233 |
|
GGT, U/L |
13 (12, 19) |
13 (12, 16) |
0.367 |
17 (13, 24) |
17 (13, 36) |
0.929 |
14 (12, 20) |
14 (12, 22) |
>0.999 |
13 (11, 16) |
13 (11, 16) |
0.596 |
0.214 |
|
Inflammation |
|
|
|
|
|
|
|
|
|
|
|
|
|
|
hsCRP, mg/dL |
0.55 (0.17, 0.81) |
0.21 (0.17, 0.94) a |
0.178 |
1.47 (1.00, 3.87) |
1.21 (0.75, 3.84) b |
0.790 |
0.64 (0.21, 1.95) |
0.60 (0.50, 1.95) a,b |
0.861 |
0.70 (0.38, 1.44) |
0.66 (0.37, 1.03) a,b |
0.721 |
0.022 |
|
IL-6, pg/mL |
1.9 (1.5, 2.4) |
1.6 (1.5, 1.9) a,b |
0.128 |
1.8 (1.5, 3.7) |
1.7 (1.5, 3.8) a |
0.400 |
2.2 (1.5, 3.0) |
1.5 (1.3, 1.9) b |
0.017 |
1.7 (1.5, 2.1) |
1.9 (1.5, 2.8) a |
0.684 |
0.036 |
|
Oxidative stress |
|
|
|
|
|
|
|
|
|
|
|
|
|
|
MDA, μg/L |
10 (8.4, 12) |
11 (8.5, 12) |
0.311 |
11 (9.0, 12) |
11 (10, 12) |
0.433 |
9.8 (7.7, 11) |
10 (6.0, 12) |
0.414 |
8.7 (7.1, 13) |
11 (8.2, 13) |
0.091 |
0.893 |
|
TAC, μmol/L |
290 ± 36 |
310 ± 34 |
0.056 |
296 ± 35 |
289 ± 30 |
0.727 |
286 ± 22 |
315 ± 27 |
0.045 |
283 ± 25 |
291 ± 31 |
0.638 |
0.322 |
Table 5: Within group changes and between group differences in participants’ blood pressure, and biochemical, inflammatory and oxidative stress indices according to intention to treat analysis (n=55).
Data are presented as mean ± standard deviation for normally distributed continuous variables or median (1st, 3rd quartile) for skewed continuous variables.
* p-value for changes within groups (baseline vs. 3-month follow-up), as derived from the paired samples t-test for normally distributed continuous variables or the Wilcoxon signed ranked test for skewed continuous variables. ** p-value for differences between study groups at the 3-month follow-up, as derived from the one-way ANOVA for normally distributed continuous variables or the Kruskal-Wallis test for skewed continuous variables. a,b Different superscripts indicate statistically significant differences between groups according to post-hoc pairwise comparisons. The Bonferroni correction was applied to adjust for multiplicity.
ALT, alanine transferase; AST, aspartate transferase; DBP, diastolic blood pressure; GGT, gamma-glutamyl transpeptidase; HDLC, high-density lipoprotein cholesterol; HDCG, high-dose control group; HDMG, high-dose mastic group; HOMA-IR, homeostasis model of assessment of insulin resistance; hsCRP, high-sensitivity C reactive protein; IL-6, interleukin 6; LDCG, low-dose control group; LDMG, low-dose mastic group; LDLC, low-density lipoprotein cholesterol; MDA, malondialdehyde; SBP, systolic blood pressure; TAC, total antioxidant capacity; TC, total cholesterol; TG, triglycerides.
Evaluation of study drinks
The evaluation of study drinks by participants at the end of the study is illustrated in Figure 2. The majority of patients of all study groups rated the organoleptic characteristics of study drinks as good or very good; (smell/aroma: LDMG: 92%, LDCG: 100%, HDMG: 82%, HDCG: 100%; taste: LDMG: 83%, LDCG: 92%, HDMG: 100%, HDCG: 91%; aftertaste: LDMG: 83%, LDCG: 83%, HDMG: 75%, HDCG: 91%; texture: LDMG: 100%, LDCG: 100%, HDMG: 92%, HDCG: 91%). Moreover, most patients declared that they would be very or definitely likely to continue consuming the study drinks after the end of the study (LDMG: 75%, LDCG: 75%, HDMG: 80%, HDCG: 90%) and to recommend them to others (LDMG: 92%, LDCG: 75%, HDMG: 87%, HDCG: 91%). The total rating of study drinks, on a scale from 1 (very bad) to 10 (very good), was 9.00±0.95 for the LDMG, 8.33±1.37 for the LDCG, 8.68±1.78 for the HDMG and 9.27±1.27 for the HDMG (p-value=0.339).
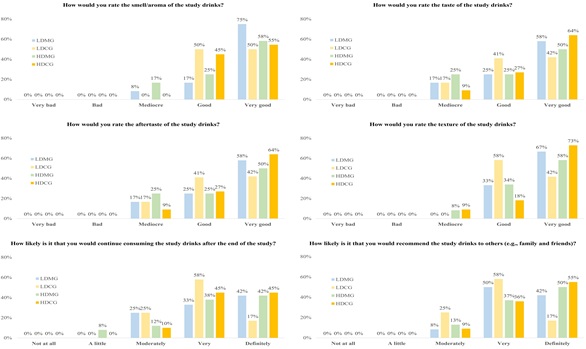 Figure 2: Evaluation of the study drinks by participants at the end of the 3-month study. The evaluation questionnaire was filled only by participants who successfully completed the intervention and were re-evaluated at 3 months (n=47). HDCC, high-dose control group; HDMG, high-dose mastic group; LDCC, low-dose control group; LDMG, low-dose mastic group.
Discussion
This randomized controlled clinical trial aimed to explore the effects of a natural aqueous extract of Chios mastic (Chios mastic water) on gastrointestinal symptoms, quality of life and various cardiometabolic indices among patients with IBS. Intervention groups receiving 600 mL of experimental drinks enriched with Chios mastic water on a daily basis for three months experienced a significant decrease in IBS-SSS and IBS-QOL scores and exhibited lower values of IBS-SSS and IBS-QOL at the end of the study compared to control arms receiving the same quantity of placebo drinks. The present findings support our research hypothesis that Chios mastic can contribute to an efficient management of IBS. Moreover, although the two intervention arms received experimental drinks with a different concentration of Chios mastic water (LDMG: 0.06%; HDMG: 0.55%), a similar clinical improvement of IBS was observed in both groups and a dose-response pattern was not evident. Regarding cardiometabolic endpoints, no significant within-group changes or between-group differences were observed in blood pressure and biochemical indices (glucose metabolism, lipidemic profile and liver enzymes), however a trend for improvement was observed in selected markers of inflammation (plasma IL-6) and oxidative stress (serum TAC) only in the intervention arms, which is in line with the strong anti-inflammatory and anti-oxidant properties of Chios mastic.
Only a few studies have so far explored the effectiveness of Chios mastic supplementation in patients with gastrointestinal diseases, mainly Inflammatory Bowel Diseases (IBD). In the pilot study of Kaliora et al. [34, 35] published in 2007, 10 patients with mild to moderate active Crohn’s disease received 6 capsules of 0.37 g of Chios mastic per day for 4 weeks and experienced a reduction in Crohn’s Disease Activity Index (CDAI), a significant improvement in plasma CRP, IL-6 and total antioxidant potential, and a remarkable reduction in TNF-a secretion by mononuclear cells, highlighting the anti-inflammatory properties of Chios mastic and its role as an immune system regulator. A subsequent 3-month randomized controlled clinical trial from the same research team conducted in a sample of 60 patients with IBD randomly allocated to either Chios mastic (2.8 g/day) or placebo, reported a significant decrease in fecal lysozyme (indicative of lower disease activity), a significant improvement in patients’ quality of life, and a significant decrease in oxidized LDL levels only in the Chios mastic arm [36,37]. Besides IBD, only a few studies have explored the effects of Chios mastic on other gastrointestinal diseases. The MAST4HEALTH study included 98 patients with Non-Alcoholic Fatty Liver Disease (NAFLD) from three countries, i.e., Greece, Italy and Serbia, who were randomly allocated to a Chios mastic group (2.1 g of Chios mastic per day) or a placebo group (2.1 g of corn starch per day) for 6 months; the researchers concluded that Chios mastic supplementation improved microbiota dysbiosis in the whole study population, and additionally reduced liver inflammation and increased total antioxidant status in severely obese NAFLD patients [38,39]. Last but not least, in 2010, Dabos et al. [40] reported that Chios mastic supplementation (350 mg, 3 times daily), significantly improved symptoms of pain and heartburn after only 3 weeks of treatment in 148 subjects with functional dyspepsia.
Although behavioral change toward a balanced diet and optimal meal patterns are important for the management of IBS, evidence of their efficacy for the whole IBS population remains controversial and complimentary approaches to treat IBS have some place in the therapeutic armamentarium of health professionals [5,6]. A few studies have proposed some efficacy for natural compounds, such as peppermint oil, aloe vera, turmeric, and traditional Chinese herbs, for the treatment of IBS; however, the value of these natural products is still debatable due to the low methodological impact of studies reporting on their efficacy in IBS and the high placebo response rate that is characteristic of IBS [41,42]. Despite the fact that Chios mastic has well-established anti-inflammatory, anti-microbial anti-atherogenic and anti-oxidant properties and has shown promising beneficial effects on gastrointestinal diseases which share common symptoms and a similar pathophysiological background with IBS [43], research on its use as a non-pharmacological therapeutic agent for the management of IBS remains scarce. The available studies, mentioned previously, have utilized high doses of Chios mastic supplements in patients with various gastrointestinal diseases and thus cannot be directly compared to the present clinical trial. However, our results point towards the benefits of Chios mastic in the form of a natural aqueous extract in alleviating IBS severity and improving patients’ quality of life. Part of this favorable effect can be attributed to the benefits of Chios mastic on two major pathophysiological mechanisms for IBS, namely intestinal low-grade inflammation and intestinal microbiota dysbiosis [44]. In this context, Chios mastic could act as a complementary therapy for IBS in parallel with conventional therapies due to its beneficial effect on intestinal epithelial cells, secondary to its anti-inflammatory and anti-oxidant properties which are also supported by the present findings, as well as its ability to act as a natural probiotic factor and promote the recovery of microbiota diversity [12].
Besides its beneficial effects on the gastrointestinal system, Chios mastic can also contribute to optimal cardiometabolic health, due to its anti-atherogenic, anti-ischemic and lipid-lowering properties, which have been extensively explored in in vitro and animal studies [12]. Results from studies in humans also support this cardioprotective action. In the study of Triantafyllou et al. [45], 133 middle-aged subjects were randomly assigned to either high-dose (5 g of Chios mastic powder daily) or low-dose (mastic solution) Chios mastic treatment for 18 months; the high-dose group exhibited a significant reduction in TC, LDLC, TC/HDC, lipoprotein a, apolipoprotein A-1, ALT, AST and GGT. In 2016, Kartalis et al. [46] administrated three different formulations of Chios mastic for 8 weeks to 156 subjects with hypercholesterolemia (TC ≥ 200 mg/dL) and observed a significant reduction in TC and fasting glucose levels in the group receiving the highest dose (1 g/day). A few years later, Kontogiannis et al. [47] explored the acute antihypertensive effects of Chios mastic in a sample of 27 subjects (of which 13 were hypertensive) randomized to receive either a sole dose of Chios mastic (2.8 g) or placebo; blood pressure measurements were taken at baseline, 2 and 3 hours after administration and revealed an acute decrease in peripheral and aortic SBP in patients with hypertension but not in normotensive ones. Significant changes in cardiometabolic indices, namely SBP, DBP, TC, LDLC, HDLC, TG, fasting glucose, insulin, HOMA-IR, ALT, AST and GGT were not observed in the present study in intervention groups supplemented with drinks enriched with Chios mastic water. This lack of significant effect can be attributed to our study population, consisting of IBS patients with a relatively healthy baseline weight and cardiometabolic status. It is also possible that a greater duration of intervention or a higher dose of Chios mastic would be required to achieve significant improvements in cardiometabolic profile indices, similar to those observed in previously published clinical trials.
The present study has both strengths and limitations. This is the first clinical trial to examine the effect of Chios mastic in patients with IBS, showing improvements in IBS symptoms and quality of life, and some evidence of anti-inflammatory and anti-oxidant properties which have been consistently demonstrated in other populations. Additional strengths of the present work include: the double-blind, randomized, controlled study design which adds to the methodological rigor of the study and overcomes, at least in part, the potential placebo effect which is common in IBS; the use of drinks enriched with a natural aqueous extract of Chios mastic (rather than supplements) which can be used as part of a healthy diet and were well-accepted and highly-evaluated by patients; the fact that two different concentrations of the natural aqueous extract of Chios mastic were tested (0.06% vs. 0.55%) to explore a potential dose-response pattern, although this was not evident probably due to the small number of patients in each study group which was not sufficient to identify statistically significant differences between intervention arms; and the comprehensive evaluation of participants’ characteristics, which included data both on IBS symptoms and severity but also on a wide range of biochemical, inflammatory and oxidative stress indices. An important limitation is the relatively small sample size (55, of which 8 were lost to follow-up), although we implemented intention to treat analysis to preserve optimal statistical power. The small trial duration, the fact that the small study sample did not allow for additional sensitivity analyses according to IBS type, the self-reported data on IBS severity and quality of life, and the study population consisting of patients with IBS of mild/moderate severity which does not permit the generalization of findings to the whole IBS population, are additional limitations.
Conclusion
In conclusion, this randomized controlled clinical trial revealed that the consumption of drinks enriched with an aqueous extract of Chios mastic can improve gastrointestinal symptoms and impairments in quality of life of patients with IBS. The present findings need to be confirmed in larger samples of IBS populations of different sociocultural, medical and lifestyle background and in subjects with a wider range of IBS severity. Future clinical trials should also explore the differential effectiveness of Chios mastic on different IBS subtypes, as well as the dose-response relationship between Chios mastic and IBS severity improvement.
Acknowledgment
The authors are grateful to Mrs. Marianna Bissia (DS CONCEPTS LTD) for logistic support, and Mrs. Antigoni Tsiafitsa (Department of Nutrition and Dietetics, Harokopio University of Athens) for assisting with blood sampling.
Sources of Support
This work was supported by DS CONCEPTS LTD. The funder had no role in the design of the study, the collection, analyses, or interpretation of data, in the writing of the manuscript, or in the decision to submit the manuscript for publication.
Author Contributions
Michael Georgoulis: methodology, formal analysis, investigation, writing – original draft, project administration. Alexandra Karachaliou: methodology, investigation, writing – original draft. Vasileios Lekakis: methodology, investigation, writing – review & editing. Labros S. Sidossis: conceptualization, methodology, writing – review & editing, supervision, funding acquisition.
Author’s Declaration
None
References
- Ford AC, Sperber AD, Corsetti M, Camilleri M (2020) Irritable bowel syndrome. The Lancet 396: 1675-1688.
- Oka P, Parr H, Barberio B, Black CJ, Savarino EV, et al. (2020) Global prevalence of irritable bowel syndrome according to Rome III or IV criteria: A systematic review and meta-analysis. Lancet Gastroenterol Hepatol 5: 908-917.
- Enck P, Aziz Q, Barbara G, Farmer AD, Fukudo S, et al. (2016) Irritable bowel syndrome. Nat Rev Dis Primers 2: 16014.
- Mearin F, Lacy BE, Chang L, Chey WD, Lembo AJ, et al. (2016) Bowel Disorders. Gastroenterology 16: 222-225.
- McKenzie YA, Bowyer RK, Leach H, Gulia P, Horobin J, et al. (2016) British Dietetic Association systematic review and evidence-based practice guidelines for the dietary management of irritable bowel syndrome in adults (2016 update). J Hum Nutr Diet 29: 549-575.
- Hookway C, Buckner S, Crosland P, Longson D (2015) Irritable bowel syndrome in adults in primary care: Summary of updated NICE guidance. BMJ 350: h701.
- Chey WD, Hashash JG, Manning L, Chang L (2022) AGA Clinical Practice Update on the Role of Diet in Irritable Bowel Syndrome: Expert Review. Gastroenterology 162: 1737-1745.
- Barrett JS (2017) How to institute the low-FODMAP diet. J Gastroenterol Hepatol 1: 8-10.
- Guglielmi P, Pontecorvi V, Rotondi G (2020) Natural compounds and extracts as novel antimicrobial agents. Expert Opinion on Therapeutic Patents 30: 949-962.
- Proestos C (2020) The Benefits of Plant Extracts for Human Health. Foods 9.
- Paraschos S, Mitakou S, Skaltsounis AL (2012) Chios gum mastic: A review of its biological activities. Curr Med Chem 19: 2292-2302.
- Soulaidopoulos S, Tsiogka A, Chrysohoou C, Lazarou E, Aznaouridis K, et al. (2022) Overview of Chios Mastic Gum (Pistacia lentiscus) Effects on Human Health. Nutrients 14: 590.
- World Medical Association (2013) World Medical Association Declaration of Helsinki: Ethical principles for medical research involving human subjects. JAMA 310: 2191-2194.
- Kushner RF (2012) Clinical assessment and management of adult obesity. Circulation 126: 2870-2877.
- Alberti KG, Eckel RH, Grundy SM, Zimmet PZ, Cleeman JI, et al. (2009) Harmonizing the metabolic syndrome: A joint interim statement of the International Diabetes Federation Task Force on Epidemiology and Prevention; National Heart, Lung, and Blood Institute; American Heart Association; World Heart Federation; International Atherosclerosis Society; and International Association for the Study of Obesity. Circulation 120: 1640-1645.
- Ashwell M, Gibson S (2014) A proposal for a primary screening tool: 'Keep your waist circumference to less than half your height'. BMC Med 12: 207.
- Ashwell M, Gunn P, Gibson S (2012) Waist-to-height ratio is a better screening tool than waist circumference and BMI for adult cardiometabolic risk factors: Systematic review and meta-analysis. Obes Rev 13: 275-286.
- Ashwell M, Cole TJ, Dixon AK (1996) Ratio of waist circumference to height is strong predictor of intra-abdominal fat. BMJ 313: 559-560.
- Kushner RF (1992) Bioelectrical impedance analysis: a review of principles and applications. J Am Coll Nutr 11: 199-209.
- Bountziouka V, Bathrellou E, Giotopoulou A, Katsagoni C, Bonou M, et al. (2012) Development, repeatability and validity regarding energy and macronutrient intake of a semi-quantitative food frequency questionnaire: methodological considerations. Nutr Metab Cardiovasc Dis 22: 659-667.
- Panagiotakos DB, Pitsavos C, Arvaniti F, Stefanadis C (2007) Adherence to the Mediterranean food pattern predicts the prevalence of hypertension, hypercholesterolemia, diabetes and obesity, among healthy adults; the accuracy of the MedDietScore. Prev Med 44: 335-340.
- Kavouras SA, Maraki MI, Kollia M, Gioxari A, Jansen LT, et al. (2016) Development, reliability and validity of a physical activity questionnaire for estimating energy expenditure in Greek adults. Science & Sports 31: e47-e53.
- Ainsworth BE, Haskell WL, Herrmann SD, Meckes N, Bassett DR, et al. (2011) 2011 Compendium of Physical Activities: A second update of codes and MET values. Med Sci Sports Exerc 43: 1575-1581.
- Francis CY, Morris J, Whorwell PJ (1997) The irritable bowel severity scoring system: A simple method of monitoring irritable bowel syndrome and its progress. Aliment Pharmacol Ther 11: 395-402.
- Patrick DL, Drossman DA, Frederick IO, DiCesare J, Puder KL (1998) Quality of life in persons with irritable bowel syndrome: Development and validation of a new measure. Dig Dis Sci 43: 400-411.
- Drossman DA, Patrick DL, Whitehead WE, Toner BB, Diamant NE, et al. (2000) Further validation of the IBS-QOL: A disease-specific quality-of-life questionnaire. Am J Gastroenterol 95: 999-1007.
- Drossman D, Morris CB, Hu Y, Toner BB, Diamant N, et al. (2007) Characterization of health related quality of life (HRQOL) for patients with functional bowel disorder (FBD) and its response to treatment. Am J Gastroenterol 102: 1442-1453.
- Mangel AW, Hahn BA, Heath AT, Northcutt AR, Kong S, et al. (1998) Adequate relief as an endpoint in clinical trials in irritable bowel syndrome. J Int Med Res 26: 76-81.
- Friedewald WT, Levy RI, Fredrickson DS (1972) Estimation of the concentration of low-density lipoprotein cholesterol in plasma, without use of the preparative ultracentrifuge. Clin Chem 18: 499-502.
- Matthews DR, Hosker JP, Rudenski AS, Naylor BA, Treacher DF, et al. (1985) Homeostasis model assessment: Insulin resistance and beta-cell function from fasting plasma glucose and insulin concentrations in man. Diabetologia 28: 412-419.
- Muntner P, Shimbo D, Carey RM, Charleston JB, Gaillard T, et al. (2019) Measurement of Blood Pressure in Humans: A Scientific Statement from the American Heart Association. Hypertension 73: e35-e66.
- Alberti KG, Eckel RH, Grundy SM, Zimmet PZ, Cleeman JI, et al. (2009) Harmonizing the metabolic syndrome: A joint interim statement of the International Diabetes Federation Task Force on Epidemiology and Prevention; National Heart, Lung, and Blood Institute; American Heart Association; World Heart Federation; International Atherosclerosis Society; and International Association for the Study of Obesity. Circulation 120: 1640-1645.
- Little RJ, D'Agostino R, Cohen ML, Dickersin K, Emerson SS, et al. (2012) The prevention and treatment of missing data in clinical trials. N Engl J Med 367: 1355-1360.
- Kaliora AC, Stathopoulou MG, Triantafillidis JK, Dedoussis GV, Andrikopoulos NK (2007) Chios mastic treatment of patients with active Crohn's disease. World J Gastroenterol 13: 748-753.
- Kaliora AC, Stathopoulou MG, Triantafillidis JK, Dedoussis GV, Andrikopoulos NK (2007) Alterations in the function of circulating mononuclear cells derived from patients with Crohn's disease treated with mastic. World J Gastroenterol 13: 6031-6036.
- Papada E, Gioxari A, Amerikanou C, Forbes A, Tzavara C, et al. (2019) Regulation of faecal biomarkers in inflammatory bowel disease patients treated with oral mastiha (Pistacia lentiscus) supplement: A double-blind and placebo-controlled randomised trial. Phytother Res 33: 360-369.
- Papada E, Forbes A, Amerikanou C, Torovic L, Kalogeropoulos N, et al. (2018) Antioxidative Efficacy of a Pistacia Lentiscus Supplement and Its Effect on the Plasma Amino Acid Profile in Inflammatory Bowel Disease: A Randomised, Double-Blind, Placebo-Controlled Trial. Nutrients 10: 1779.
- Amerikanou C, Kanoni S, Kaliora AC, Barone A, Bjelan M, et al. (2021) Effect of Mastiha supplementation on NAFLD: The Mast4health Randomised, Controlled Trial. Mol Nutr Food Res 65: 2001178.
- Kanoni S, Kumar S, Amerikanou C, Kurth MJ, Stathopoulou MG, et al. (2021) Nutrigenetic Interactions Might Modulate the Antioxidant and Anti-Inflammatory Status in Mastiha-Supplemented Patients With NAFLD. Front Immunol 12: 683028.
- Dabos KJ, Sfika E, Vlatta LJ, Frantzi D, Amygdalos GI (2010) Is Chios mastic gum effective in the treatment of functional dyspepsia? A prospective randomised double-blind placebo controlled trial. J Ethnopharmacol 127: 205-209.
- Billings W, Mathur K, Craven HJ, Xu H, Shin A (2021) Potential Benefit With Complementary and Alternative Medicine in Irritable Bowel Syndrome: A Systematic Review and Meta-analysis. Clin Gastroenterol Hepatol 19: 1538-1553.
- Hussain Z, Quigley EM (2006) Systematic review: Complementary and alternative medicine in the irritable bowel syndrome. Aliment Pharmacol Ther 23: 465-471.
- Pachi VK, Mikropoulou EV, Gkiouvetidis P, Siafakas K, Argyropoulou A, et al. (2020) Traditional uses, phytochemistry and pharmacology of Chios mastic gum (Pistacia lentiscus var. Chia, Anacardiaceae): A review. J Ethnopharmacol 254: 112485.
- El-Salhy M (2015) Recent developments in the pathophysiology of irritable bowel syndrome. World J Gastroenterol 21: 7621-7636.
- Triantafyllou A, Chaviaras N, Sergentanis TN, Protopapa E, Tsaknis J (2007) Chios mastic gum modulates serum biochemical parameters in a human population. J Ethnopharmacol 111: 43-49.
- Kartalis A, Didagelos M, Georgiadis I, Benetos G, Smyrnioudis N, et al. (2016) Effects of Chios mastic gum on cholesterol and glucose levels of healthy volunteers: A prospective, randomized, placebo-controlled, pilot study (CHIOS-MASTIHA). Eur J Prev Cardiol 23: 722-729.
- Kontogiannis C, Georgiopoulos G, Loukas K, Papanagnou ED, Pachi VK, et al. (2019) Chios mastic improves blood pressure haemodynamics in patients with arterial hypertension: Implications for regulation of proteostatic pathways. Eur J Prev Cardiol 26: 328-331.
Citation: Georgoulis M, Karachaliou A, Lekakis V, Sidossis LS (2023) The Effectiveness of a Natural Aqueous Extract of Chios Mastic in the Management of Irritable Bowel Syndrome: The MASTIQUA Randomized Controlled Clinical Trial. J Food Sci Nutr 9: 154.
Copyright: © 2023 Michael Georgoulis, et al. This is an open-access article distributed under the terms of the Creative Commons Attribution License, which permits unrestricted use, distribution, and reproduction in any medium, provided the original author and source are credited.