The Trend in Fish Species Diversity and abundance at Asejire Reservoir South Western Nigeria
*Corresponding Author(s):
Augustine OmoikeDepartment Of Biological Sciences, Bells University Of Technology, Ota, Nigeria
Tel:+234 8062099220,
Email:dromoike@yahoo.com
Abstract
The upsurge of population and industries around Asejire area necessitated a study into the fish species diversity and abundance for managerial purposes to determine the trend in the availability of fresh water fisheries resources in Asejire Reservoir within boundary of Oyo and Osun States in Nigerian. This consequently necessitated the study of the trend in fish stock composition, comparing it with the fisheries scientists’ previous research findings.
Four sampling zones namely back of reservoir wall, littoral area, middle of reservoir and industrial effluent discharge site were identified. Grated fisher folks gillnet of 50.8 mm, 63.0 mm, 76.2 mm, 114.0 mm and 127.0 mm mesh sizes were used for fish sampling, carried out during the wet and dry seasons. The catches collected were identified using morphometric and meristic features. The water was assessed, for physico-chemical parameters as described by American Public Health Association, compared with previous findings. The data collected were subjected to Analysis of Variance (ANOVA). It showed changes in physico-chemical parameters with significant difference in relation to fish availability in zones (p>0.05). A total of 620 fish specimens were caught Chrysichthys nigrodigitatus was the most abundant single species totalling 30.5 %, while the Family of Cichlidae was most divergent with 3 genera and 4 species. The fish weight and mesh sizes of gillnet used showed significant difference while the seasonal fish catch were not significant (p<0.05). The fish catches of gillnet with mesh size of 50.8mm were most effective with 23 % catches of the total catch. The wet season fish catches were 70.0 % against 30.0 % of dry season. Eighteen fish species from 12 families identified, showed that the catch per unit effort on zonal sampling was 1.9 kg/ha using 375 m2 gillnet mesh effort while few species such as Synodontis clarias, Hemichromis bimaculatus and Alestes baremose were not encountered at Asejire Reservoir during this research while, Labeo senegalensis and Mormyrus hasselquisti are newly introduced into the Asejire reservoir. The Maximum Sustainable Yield (MSY) was 1.8 kg. The study shows that the state of Asejire Reservoir reflected a depletion of fish species, mostly juvenile sizes were caught as a result of increased human activities of over-fishing.and probably caused by increase in the physico-chemical parameters data obtained.
Keywords
Asejire reservoir; Biodiversity; Fish diversity; Fisheries; Gillnets; Maximum sustainable yield; Mophometric features; Species abundance; Sustainability
Introduction
Inland waters constitute important sources of food, employment and income to the population of riparian community meanwhile, it thus serve as recreation and educational research purposes across the continents in the entire world and fish represent one of the best and main sources of dietary animal protein in Nigeria and Africa. This research tend to look into the richness of Asejire reservoir biodiversity trend over period of yeras, Adadu et al. [1], stated that species richness and relative abundance are a key element of biodiversity. Because of the geomorphic processes governing river form, river systems in all climatic zones tend to resemble one another and in fact, many features are common. The diversity of natural populations is partially dependent on the environmental variables which always affect the competing populations [2]. Human activities have modified rivers worldwide [3]. According to Suter [4], species richness and relative abundance studies have been recommended as ecological risk assessment in the aquatic system Similar trends are occurring in tropical, sub-tropical and arid-zone systems [5]. Fish species distribution varies strongly with depth, niche of the fish and the ecosystem. The physical and chemical characteristics of any aquatic system, acting together, determine the nature of the aquatic organizations inhabiting it and that change in water quality from the loading of water with a range of organic and in-organic substances [6].
Nigeria lies between Longitudes 2°49’E and 14°37’E and Latitudes 4°16’N and 13°52’ North of the Equator and Nigeria is blessed with a vast expanse of inland freshwater and brackish ecosystem [7]. River Oshun is one of a series of West African Rivers that do not drain into the Niger System but discharge into coastal lagoons and creeks bordering the Atlantic Ocean. Sustainable management of reservoir necessitate regular or periodical stock composition checklist. Lawson and Olusanya [8], also noted that for the sustainability of fish resources, an adequate knowledge of species composition, diversity and relative abundance of the water bodies must be understood and vigorously pursued. Thus, the avoidable decline of fisheries resources in an area due to overexploitation and inadequate management of inland waters could be checked through the availability of relevant information of various parameters of species in the river. These researches tend to look into the trend of fish abundance and diversity of Asejire reservoir since 1986.
Materials And Methods
Study area
Asejire Reservoir is a man-made reservoir constructed on River Oshun at about 30 km East of Ibadan within the boundary of Oyo and Osun States, Nigeria, The reservoir is Y-shaped with many fishing villages around it (Figure 1). These areas are surrounded by villages mostly farmers and fisher folks. It has both wet and dry seasons, April to October and November to March, respectively. Water discharges from River Oba at the stream ganging stations of Iwo, which is about 40 km North of Asejire, having higher monthly discharge during late wet season [9,10].
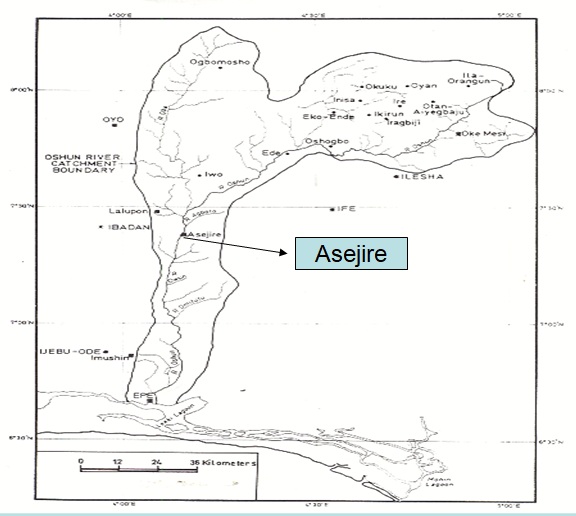 Figure 1: River Oshun and tributaries.
Sampling techniques
Fish sampling was based on stratification with time and space. Dry season: (December-May). Wet season: (June-November) (Department of Geography, University of Ibadan).
Space stratification
The study area was divided into four sampling Zones: (a) Back of the dam (b) Along the littoral zone of the dam (c) Middle of the dam site (d) Site of waste discharge.
Experimental fishing equipment
A grated fisherman gillnets with stretched mesh sizes of 50.8 mm (2”), 63 mm (2.5”), 76.2 mm (3”), 114 mm (4.5”) and 127 mm (5”), each measuring 25 m long by 3 m deep. The nets were set overnight at 16.00 hrs and catches was collected by 07.00 hrs on the following day from year 2001 to year 2003 and reviewed 2016 to 2018.
Fish Identification
Fish sample caught was identified at the landing site using taxonomic keys prepared by Lowe McConnel and Holden and Reed [11,12].
Gill Net Selectivity
Gill net selectivity and efficiency for dominant fish sample caught was determined based on the methods of Holt [13], cited by Sparre et. al. [14].
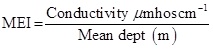
Potential Fish Yield /Maximum Sustainable Yield/Annual Catch: Calculations was based on Mopho-Edaphic Index (MEI) as described by Ryder [15], Henderson and Welcome [16] and Welcomme [6]. The maximum sustainable yield was calculated using Schaefer and Fox model [14]; ME1 = TDS/d
Yield (Y) = 23.281 x MEI
Log 10 MSY = 0.050 TEMP. + 0.280 Log 10 ME1 + 0.236
Y=14.3136MEI0.4681
Where: Y = yield in kg/ha
Water Quality Assessment
The water physical parameters such as water level, transparency and temperature were taken on site using the water level gauge, Secchi disc, Mercury in glass thermometer, were calculated respectively based on Reish and Oshida [17]. Data collection was carried out at the last week of every month from August 2001 to July 2003 and 2016 to 2018 in all zones sampled, as used by Enell et. al. [18] in the water sampling carried out in Sweden.
Statistical Analysis
Catches were analyzed using Analysis of Variance (ANOVA) to determine sizes of meshes seasonal catch and catch/ fishing effort according to Montgomery [19]. The physic-chemical data and fish sampled were subjected to correlation test and regression analysis for testing of their dependency and goodness of fit [20].
Results
Fish stock assessment
Fish species abundance and diversity is as presented in tables 1 & 2, the catches across the zones shown in figures 2 & 3. This study revealed that 18 species were caught with the family Cichlidae accounting for 58.5 % as in occurrence by number followed by the family Mormyridae, represent 3%. The family Characidae (Tiger fish) was next by classification based on species diversity. The other Family was Bagridae having the highest single species of 30.5%, by number, among others.
|
Family Season |
|||||||
|
|
DRY No. |
% |
WET No. |
% |
Total % Composition |
Minimum WT (gm) |
Maximum WT (gm) |
|
Bagridae Chrysichthys nigrodigitatus Sub Total |
39 39 |
20.6 20.6 |
150 150 |
35 35 |
30.5 - |
45 - |
1475 - |
|
Centropomidae Lates niloticus Sub Total |
0 0 |
0 0 |
4 4 |
0.9 0.9 |
0.6 - |
50 - |
140 |
|
Characidae Alestes macrolepidotus Hydrocynus forskalii Sub Total |
0 2 2 |
0 1.1 1.1 |
3 2 5 |
0.7 0.5
1.2 |
0.5 0.6 1.1 |
50 40 - |
70 175 - |
|
Cichilidae Tilapia zillii Sarotherodon galilaeus Oreochromis niloticus Oreochromis aureus Sub Total |
7 9 61 57 134 |
3.7 4.8 32.3 30.2 71.0 |
47 24 68 90 229 |
11 5.6 16 21 10.4 |
8.7 5.3 20.8 23.7 58.5 |
75 125 100 75 - |
1500 1500 1500 2050 - |
|
Clariidae Clarias gariepinus Sub Total |
1 1 |
0.5 0.5 |
3 3 |
0.7 0.7 |
0.6 0.6 |
600 - |
600 - |
|
Cyprinidae Labeo senegalensis Sub Total |
0 0 |
0 0 |
3 3 |
0.7 0.7 |
0.5 0.5 |
150 - |
400 - |
|
Hepsetidae Hepsetus odoe Sub Total |
0 0 |
0 0 |
1 1 |
0.2 0.2 |
0.2 0.2 |
120 - |
120 - |
|
Mochokidae Synodontis batensoda Sub Total |
4 4 |
2.1 2.1 |
3 3 |
0.7 0.7 |
1.1 1.1 |
50 - |
300 - |
|
Mormyridae Mormyrus rume Mormyrus hasselquisti Gnahonemus tamandua Sub Total |
2 5 2 9 |
1.1 2.6 1.1 4.8 |
5 1 6 12 |
1.2 0.2 1.4 2.8 |
1.1 1.3 0.6 3.0 |
200 500 500 - |
450 725 750 - |
|
Osteoglossidae Heterotis niloticus Sub Total |
0 0 |
0 0 |
2 2 |
0.5 0.5 |
0.3 0.3 |
125 - |
200 - |
|
Polypteridae Polypterus endlicheri Sub Total |
0 0 |
0 0 |
2 2 |
0.5 0.5 |
0.3 0.3 |
200 - |
200 - |
|
Schilbeidae Schilbe mystus Sub Total Grand Total |
0 0 189 |
0 0 100 |
17 17 431 |
3.9 3.9 100 |
2.7 2.7 100 |
25 - |
80 - |
Table 1: The Summary of Fish catches by Number in the study area.
|
|
Wet season |
Dry season |
||||||||
|
Fish species/Mesh size |
2 |
2.5 |
3 |
4.5 |
5 |
2 |
2.5 |
3 |
4.5 |
5 |
|
Labeo senegalensis |
3 |
- |
- |
- |
- |
- |
- |
- |
- |
- |
|
Heterotis niloticus |
2 |
- |
- |
- |
- |
- |
- |
- |
- |
- |
|
Synodontis batensoda |
- |
1 |
1 |
1 |
- |
3 |
1 |
- |
- |
- |
|
Oreochromis niloticus |
15 |
16 |
19 |
13 |
5 |
5 |
7 |
39 |
2 |
8 |
|
Tilapia zillii |
9 |
9 |
18 |
6 |
5 |
1 |
- |
4 |
- |
2 |
|
Mormyrus hasselquisti |
- |
- |
- |
1 |
- |
- |
1 |
- |
4 |
- |
|
Sarotherodon galilaeus |
1 |
4 |
3 |
12 |
4 |
1 |
1 |
5 |
- |
2 |
|
Oreochromis aureus |
4 |
13 |
27 |
27 |
19 |
12 |
6 |
19 |
13 |
7 |
|
Gnahonemus tamandua |
1 |
1 |
1 |
3 |
- |
- |
1 |
- |
- |
- |
|
Hydrocynus forskalii |
- |
2 |
- |
- |
- |
- |
2 |
- |
- |
- |
|
Hepsetus odoe |
- |
- |
1 |
- |
- |
- |
- |
- |
- |
- |
|
Schilbe mystus |
16 |
- |
1 |
- |
- |
- |
- |
- |
- |
- |
|
Polypterus endlicheri |
- |
1 |
1 |
- |
- |
- |
- |
- |
- |
- |
|
Clarias gariepinus |
- |
- |
- |
2 |
1 |
- |
- |
1 |
- |
- |
|
Lates nilonticus |
- |
2 |
2 |
- |
- |
- |
- |
- |
- |
- |
|
Mormyrus rume |
- |
1 |
1 |
3 |
- |
1 |
- |
- |
1 |
- |
|
Alestes macrolepidotus |
3 |
- |
- |
- |
- |
- |
- |
- |
- |
- |
|
Chrysichthys nigrodigitatus |
90 |
44 |
8 |
1 |
7 |
22 |
13 |
4 |
- |
- |
|
Total Percentage (%) |
142 23 |
96 15.4 |
83 13.4 |
69 11.1 |
41 6.6 |
45 7.3 |
32 5.2 |
72 12 |
21 3.4 |
19 3.1 |
Table 2: Fish catches in seasons by mesh sizes in the study area.
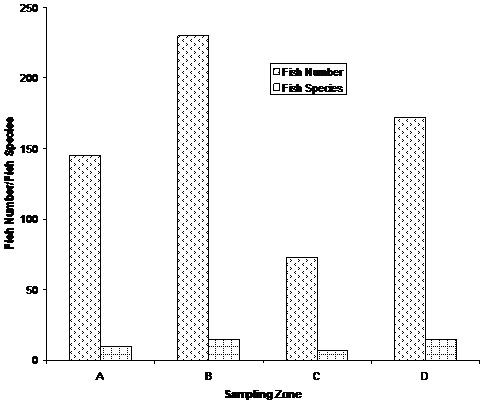 Figure 2: Fish catch by Number and species across the sampling zones.
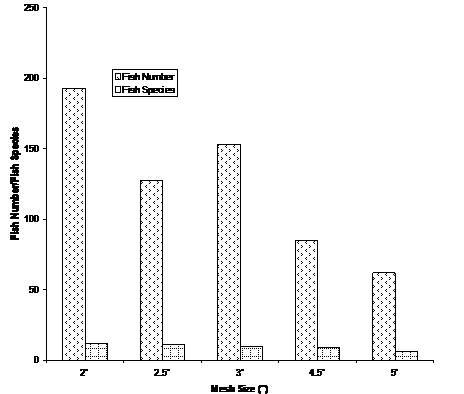 Figure 3: Fish catch by Number and species by mesh across the sampling zones.
Catch - effort relationship
Monthly catches calculated from the fishermen gill nets used in all the strata of catchment’s area is presented in table 3. Showing the average catch per season to be 10 and 18 fishes of 3 and 5 kg, respectively for dry and wet seasons. While the Catch per Unit Effort (CPUE) is presented in tables 4 & 5 using the 375 m2 gillnets area set. The fish catch (gm) against effort (Gillnet m2) was 8.3 kg/ha for 2001/2002 and 3 kg/ha for year 2002/2003/2018. The comparison of the catches by different mesh sizes were examined using the length distribution and log ratio of catches of pairs of gill nets (2", 2.5", 3", 4.5") as presented in tables 4 & 5. The catches of 3’’ mesh size net showed highest of 60 fishes within the length range of 16 - 1 8 cm of Family Cichlidae, while, the smallest 2’’ mesh size net caught 8 fishes in the same length range. The yield estimate is found in table 6. As calculated from conductivity and mean depth (Figures 4 & 5). The statistical analysis of variance of the water chemical test parameters is as shown in tables 7 & 8.
|
Season |
Wet |
Dry |
||
|
Sampling Month |
Fish No Wt (gm) |
Fish No Wt (gm) |
||
|
1 |
16 |
510 |
4 |
3270 |
|
2 |
24 |
3455 |
7 |
2275 |
|
3 |
24 |
2415 |
11 |
1437 |
|
4 |
21 |
9515 |
11 |
5320 |
|
5 |
50 |
12490 |
10 |
4565 |
|
6 |
44 |
28635 |
34 |
6025 |
|
7 |
37 |
6170 |
34 |
11070 |
|
8 |
25 |
5685 |
18 |
4800 |
|
9 |
16 |
5835 |
25 |
10950 |
|
10 |
91 |
26535 |
35 |
11495 |
|
11 |
83 |
20325 |
X |
X |
|
Total |
431 |
121570 |
189 |
61207 |
|
Average catch (2 seasons) |
39 |
11.1 kg |
19 |
6.1 kg |
|
Average catch/month |
15 Fish specimens to |
4.3 kg |
||
Table 3: Mean Monthly catch in the study area from the Fishermen gillnet sampling data in seasons during study period. X=No Catch
|
2'' |
2.5'' |
3'' |
4.5'' |
5'' |
|
|
Aug |
1000 |
1505 |
1005 |
5025 |
20,100 |
|
Sep |
1095 |
1055 |
2000 |
- |
2020 |
|
Oct |
1010 |
425 |
2850 |
1400 |
- |
|
Nov |
200 |
1050 |
1050 |
325 |
3210 |
|
Dec |
910 |
980 |
2085 |
1150 |
900 |
|
Jan |
- |
- |
- |
- |
- |
|
Feb |
1000 |
525 |
2125 |
2010 |
5410 |
|
Mar |
375 |
1575 |
1450 |
1400 |
- |
|
April |
- |
1375 |
2425 |
4100 |
3050 |
|
May |
1895 |
- |
8340 |
1260 |
- |
|
June |
1605 |
4350 |
3420 |
15160 |
2000 |
|
Jul-02 |
4900 |
3900 |
2775 |
4850 |
3900 |
Table 4: Fish catch (gm) and fishing effort (gillnet m2) assessment in the study area during sampling period.
Grand total: 137.525 kg, Zone daily catch: 2.83 kg, Average daily catch: 12.6 kg, No of night sampled: 11, Zone sampled: 4, Surface area of net fleet set/zone/night: 375 m2, Zone area of net set-month: 1500 m2, Total area of net sampled / year: 16500 m2, Number of fisherman per sampling: 1, Catch /1000 m2 of fleet: 8.3 kg/ha
|
2" |
2.5" |
3" |
4.5" |
5" |
|
|
Aug |
75 |
125 |
65 |
100 |
145 |
|
Sep |
90 |
280 |
60 |
2000 |
1025 |
|
Oct |
25 |
70 |
420 |
1550 |
350 |
|
Nov |
- |
- |
- |
- |
- |
|
Dec |
1000 |
1010 |
810 |
50 |
400 |
|
Jan |
1000 |
75 |
1050 |
150 |
- |
|
Feb |
47 |
- |
300 |
100 |
990 |
|
Mar |
1000 |
2120 |
400 |
1000 |
800 |
|
April |
515 |
200 |
100 |
740 |
3010 |
|
May |
- |
- |
- |
- |
- |
|
June |
300 |
1100 |
1460 |
3000 |
3655 |
|
July |
5900 |
2000 |
3000 |
90 |
1500 |
Table 5: Fish catch (gm) and fishing effort (gillnet m2) assessment in the study area during sampling period.
Grand total: 45252 gm, Average daily catch: 4.5 kg, Zone daily catch: 0.943 kg, No of night sampled: 10, Zone sampled: 4, Surface area of net fleet set / zone/night: 375m2, Total surface area of net set/month: 1500m2, Total area of net sampled /year 45000m2, Number of fisherman per sampling: 1, Catch /1000m2 of fleet: 3 kg/ha.
|
Months |
Conductivity (µmhos/cm) |
Mean depth (m) |
Morpho-Edaphic Index |
Potential Fish Yield kg/ha |
|
Aug 2001 Jan 2002 June 2002 Dec 2002 July 2003 |
240.0 215.6 225.0 140.4 210.0 |
11m 11m 11m 11m 11m |
21.8 9.6 23.2 12.8 19.1 |
60.6 57.6 62.4 47.2 56.9 |
Table 6: The potential yield estimate as calculated from conductivity and mean depth.
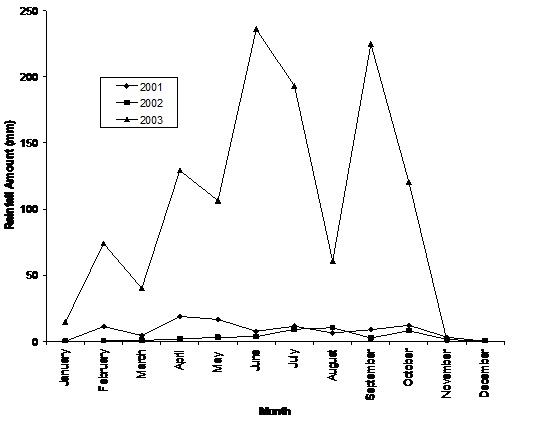 Figure 4: Monthly rainfall trend during the research study.
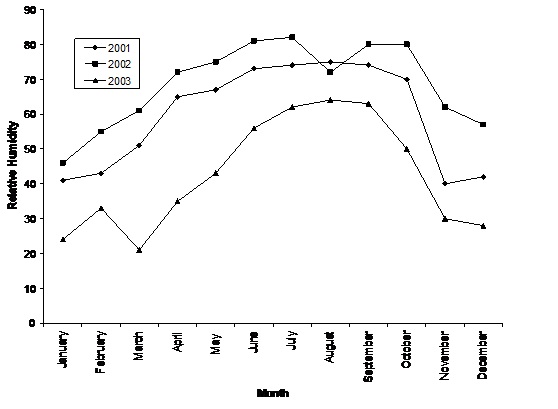 Figure 5: Monthly rainfall trend during the research study.
|
Parameter |
Df |
MS |
F |
Remark |
|
(a) NH3 (mg/l) |
3 |
44.8441 |
25.29 |
* |
|
(b) PO4 (mg/l) |
3 |
0.0546 |
2.51 |
|
|
(c) Conductivity (cm-1) |
3 |
8.645 |
1.36 |
|
|
(d) BOD (mg/l) |
3 |
101.929 |
7.36 |
* |
|
(e) NO3 (mg/l) |
3 |
21.1933 |
4.9 |
* |
|
(f) DO (mg/l) |
3 |
0.3968 |
2.75 |
|
|
(g) Ph |
3 |
0.09 |
7.89 |
* |
Table 7: Result of analysis of variance for water chemical test parameters for the Zones.*=Significant (p>0.05).
|
Means |
||||
|
Zone |
pH |
BOD |
NO3 |
NH3 |
|
A |
5.8000 a |
18.9000 a |
16.9750 a |
17.1300 a |
|
B |
5.7875 a |
19.8000 a |
18.3250 a |
18.6750 a |
|
C |
5.8400 a |
30.0250 b |
22.1750 b |
24.5500 b |
|
D |
5.5125 b |
22.6000 a |
17.8250 a |
18.1250 a |
Table 8: Result of follow up (Post Hoc) LSD Tests.
Means with the same letter (within each column) are not significantly different from each other at p< 0.05.
Discussion
Fish trend assessment
The water chemical parameters during this study showed that pH, NO3 (Mg/l), BOD (Mg/l) and NH3 (Mg/l) were significantly (P>0.05) different, which means that the fish that could tolerate this change in the critical condition of water will survive these areas at this particular period, this also influences biodiversity. The Catch Per Unit Effort (CPUE) of 3 kg/ha and 8.3 kg/ha during this period of study indicates low catches. The conductivity observed at Asejire Reservoir in the zones was moderate, with higher values in the wet periods; having sparsely high nutrient and more fish species abundance and diversity; but low conductivity value and low fish species during the dry season, but higher than Aransiola [21] observation was that conductivity ranged from 111 mmhoscm-1 in June to 140 mmhoscm-1 in July with an average of 127.04 mmhoscm-1.
The study shows that 18 fish species belonging to 12 families were identified and classified according to Holden and Reed [12] and Lowe - McConnel [11] as against 23 fish species from 13 families identified in Lake Asejire [9] while Akinyemi [22] identified 14 families comprising a total of 41 fish species.
The family Cichlidae was the most divergent family with 3 genera and 4 species, which supports the observation of Elliott [9] that Cichlidae was most encountered but identified 4 genera with eight species. Supported by Akinyemi [22] who observed the same Cichlidae family of 4 genera with 8 species. Daddy et. al. [23] also found Cichlidae to be the dominant family in Tatabu Lake in Niger State of Nigeria. Olaniran [24] also observed Cichlidae as the dominant family in International Institute of Tropical Agriculture Lake, Nigeria.
The littoral area and the middle of the reservoir had greater number of fish species against other sampled zones of Asejire Reservoir, as a result of food abundance along with the escaping possibilities areas against pollutant and blockage caused by the dam wall. Welcomme [25], stated that in African lakes, the littoral zone which fishermen exploit was almost entirely colonized by Cichlids because of their specific tolerance of the elevated temperature found there.
Akinyemi [22] suggested that the increase in fish species caught was probably due to the inclusion of smaller mesh sizes (38 mm - 178 mm) to ensure that all species were caught while Elliott [9] sampled with mesh sizes ranging from (64 mm - 115 mm). However, this study used mesh sizes ranging between 51 mm – 127 mm, with gillnet mesh sizes that could encounter more number than that of Elliott [9], still the catch was lesser than Elliott’s catch. The change in number could only be different naturally as reported by Welcomme [25] and supported by Payne cited by Akinyemi [22] that considerable difference in the number of species inhabiting the various river systems in Zaire, Nigeria and Ghana are due to a difference in basin area or some correlation of it such as length of the main channel or stream order and that the larger the basin area, the greater the potential for habitat diversity and increasing number of species in African lakes and rivers.
It has been observed that amongst the fish species identified at Asejire lake by Elliott [9], Hydrocynus forskalii, Labeo senegalensis, Mormyrus hasselquisti, Gnathonemus tamandua and Heterotis niloticus were absent, though, fish species such as Xenomystus nigri, Alestes baremose, Labeo coubie, Chrysichthys auratus, Hemichromis fasciatus, Hemichromis bimaculatus, Chromidotilapia guentheri, Channa obscura and Ctenopoma kingsleyae had disappeared from the identified fish species in this study. Some fish species caught at Asejire Reservoir by Akinyemi [22] that were not encountered at the present study were Tilapia dagetti, Hemichromis fasciatus, Pelmatochromis guentheri, Alestes leuciscus, Alestes nurse, Alestes imberi and Alestes lineatus others were Clarias anguillaris, Bagrus bayad, Auchenoglanis, Occidentalis, Gnathonemus abadii, Gnathonemus pictus, Petrocephalus bane, Marcusenius psittacus, Mormyrus deliciosus, Eutropius niloticus, Siluranodon auratus, Phargo locicatus, Synodontis clarias, Synodontis gambiensis, Synodontis nigrita and Synodontis sorex; so also were Channa obscura, Ctenopoma kingsleyae, Distichodus brevipinus, Distichodus nostrastus, Macrobachium sp and Barbus occidentalis. However, Polypterus endlicheri, Labeo senegalensis, Mormyrus hasselguisti and synodontis batensoda were not observed in the study of Akinyemi [22].
Akinyemi [22] acknowledged the absence of Labeo spp and Alestes spp but attributed it to the limited upstream habitat and absence of a fish pass in the barrier across this lake, which may account for the disappearance of Alestes spp in the Lake Asejire in 1987. The reason for the less number of encountered fish may be due to ageing of the reservoir as reported by Welcomme [25], that rivers tend to decrease in number of fish species as it increases in age.
This could be similar to the cause of disappearance of fish species from 41 species earlier identified by Akinyemi [22] to the present 18 species as identified in this research. Though, this reservoir is not that aged, but the activity of man around Asejire Reservoir of late could have activated this fact.
It could be that the unidentified species in this study may have undergone an annual downstream migration during this period. Mass movements of fish from one place to another is common, on a regular basis, this could be in seasonal or daily occurrence. The daily migrations are typically for feeding and/or predator avoidance; while most species migration is for spawning and often do not feed this period [26].
Faturoti [27] stated that the fish catches at Ogunpa River in Ibadan are relatively non-significant because it is heavily polluted due to in-flow of pollutants from streams and rivers. Supported by Stirn cited by Oben [28] that environmental stress frequently reduces community diversity. This is an implication of unimplemented enacted edict of inland Fisheries laws and regulations as in the case of Edo, Delta and Ondo States in Nigeria [29].
This study revealed that the effectiveness and efficiency of mesh size of 51mm (2″) was dominant. It is therefore deduced that the mesh sizes between 51mm (2″) - 76 mm (3″) were effective and this goes on to say that the present state of the fish species at Asejire Reservoir is dominated by juvenile species and that the larger ones are gradually disappearing. The fish species caught also decreases as mesh size net increases, as 2″ mesh size had 12 fish species as against 6 fish species caught by 5″ mesh size, this is an indication of fish size availability during this study period. The highest single fish species of Chrysicthys nigrodigitatus caught was with 51 mm (2″) followed by 64 mm (2.5″). However, this research had revealed that the catches by 2" gillnets was highest, and that it was more effective at the middle of the lake. The gillnet size correlates to the length group of fish caught and vice versa. The highest frequency occurred in the length group of 16-18 cm. The Family Cichlidae and Chrysichthys nigrodigitatus fishes showed effectiveness of 3″ and 2″ mesh sizes, respectively.
The Fishes caught during wet seasons were more, both in species, number and weight than the fishes caught during the dry periods. Fish species composition and numerical abundance statistical analysis had revealed no significant difference of catches at the zones (p<0.05). This situation could be caused by over exploitation or by seasonal migration of these fishes. Moreover, this could be as a result of higher water level at the middle of the reservoir, revealing the abundance of food washed into this area, supported by Moyle and Cech [26] that water levels are extremely important clues to many tropical fishes, because reproduction and growth are often strongly related to rising water levels, as a result of the flushing of terrestrial nutrients into the rivers during flooding. This could also account for the fish species and their numerical abundance during the wet season than the dry seasons in this study. Though, the statistical analysis showed no significant difference (p< 0.05).
Contrary to the statement of Welcomme [25], Ita [30] cited by Akinyemi [22] that more catches were made during dry season, as a result of low water period, but agreed that the total weight of fish may be larger during the floods.
However, in the discussion on gear selectivity and seasonal catch of Akinyemi [22], he acknowledged that if periods of good catch are to be predicted on monthly basis from the flood patterns of the lakes investigated, Asejire and Eleyele, that it seems sporadic high catches are to be expected in Lake Asejire between July - September when there is increased drawdown in water level. Similarly, Balogun [31], cited Ita, that they observed the lowest catch during the low water level.
Jinadu [32-36] in the research study carried out on coastal artisanal fishing operation in Lagos State, Nigeria. Observed that the average monthly landing in the seasons confirm the wet season as more active of the two seasons with 60.72 percent as opposed to 39.28 per cent for the dry season. The wet season therefore summarises the abundance of the food, pollutant dilution, less activities by the fishermen thereby increasing the fish availability by number and species during this study.
References
- Adadu MO, Garba AA, Mshelia JP (2019) Diversity and abundance of fish species in river Okpokwu, Benue State, Nigeria. International Journal of Fisheries and Aquatic Studies 7: 55-60.
- Shahadat HM, Das NG, Sarker S, Ziaur RM (2012) Fish diversity and habitat relationship with environmental variables at Meghna river estuary, Bangladesh. Egyptian Journal of Aquatic Research 38: 213-226.
- Cowx IG (2002) Analysis of threats to freshwater fish conservation: Past and present challenges. In: Collares-Pereira MJ, Cowx IG, Coelho MM (eds). Conservation of Freshwater Fishes: Options of the future. Fishing News Books, Blackwell, Oxford, United Kingdom. Pg no: 201-220
- Suter GW (2007) Ecological Risk Assessment (2nd edn). CRC Press, Boca Raton, Florida.
- Revenga C, Kura Y (2003) Status and Trends of Biodiversity of Inland Water Ecosystems. Secretariat of the Convention on Biological Diversity, Montreal Technical Series. Pg no: 11.
- Welcomme RL (1983) River Basin. FAO Fisheries Technical, Rome. Pg no: 60.
- Ita EO (1993) Inland fishery Resources of Nigeria. CIFA Occasional paper, Rome. Pg no: 120.
- Lawson OE, Olusanya OM (2010) Fish Diversity in three tributaries of river ore, South West, Nigeria. World Journal of Fish and Marine Sciences 2: 524-531.
- Elliott OO (1986) Some aspects of the biology of the fishes of Asejire Lake. A PhD. Thesis in the Department of Zoology, University of Ibadan, Nigeria.
- Omoike A (2004) Sustainable Management of Fisheries of Asejire Reservoir and Its Environs in South Western Nigeria PhD Thesis Dept of Aquaculture and Fisheries Management, University of Ibadan, Ibadan, Nigeria.
- McConnel RHL (1972) Fresh water Fishes of the Volta and Kainji Lakes. Ghana University Areas, Accra. Pg no: 22.
- Holden M, Reed W (1978) West African fresh water fish. West African Nature Handbooks Longman. Pg no: 61.
- Holt SJ (1963) A method for determining gear selectivity and its application. ICNAF Pec Publ.
- Sparre P, Ursin E, Venema SC (1989) Introduction to tropical fish stock assessment - part 1: Manual (French version not published). Tech Pap, Rome.
- Ryder RA (1965) A method for estimating the potential fish production of North Temperate lakes. Trans. America Fish Soc 94: 214 - 218.
- Henderson HF, Welcomme RL (1974) The relationship of yield to MEI and number of fishermen in African Inland fisheries. CIFA Occassional Paper Pg no: 19.
- Reish LD, Oshida SP (1987) Manual of methods in aquatic Environment research part 10 - short term static bioassays FAO Fish Tech. Rome, Italy. Pg no: 247.
- Enell M, Kaj L, Wennberg L (1991) Distribution of Halogenated Organic Compounds (AOX) - Swedish Transport to Surrounding Sea Areas and Mass Balance Studies in Five Drainage Systems. Pg no: 19-27.
- Montgomery DC (1984) Design and analysis of experiment. John wiley and Sons, New York. Pg no: 225-228.
- Baker JM, Hactley JP, Dicks B (1987) Planning biological surveys: Biological surveys of estuaries and coast. Estuarines and brackish- water sciences asso. Handbook, London. Pg no: 1-26.
- Aransiola MO (1990) Some aspects of the biology, nutrition and reproductive physiology of the African catfish chrysichthys nigroditatus (lacepede) Ph.D Thesis Dept. of Zoology, University of Ibadan, Nigeria.
- Akinyemi O (1987) Management of Lake Eleyele and Lake Asejire fisheries: Application of Bionomic models Ph.D. Thesis in the Department of Wildlife and Fisheries Management, University of Ibadan.
- Daddy F, Abubakar A, Aina E (1991) Studies on talabu floodplain vegetation and its utilization NIFFR Annual Report. Pg no: 16-20.
- Olaniran TS (2000) Ecological evaluation and sustainable mgt. of fish Production in IITA PhD. Thesis, Dept of Wildlife and Fisheries Mgt. U. I. Ibadan, Nigeria.
- Welcomme RL (1985) River Fisheries. FAO Fish Tech Pap 262: 330.
- Moyle PB, Cech JJ (2000) Fishes: As introduction to ichthyology. Prentice - Hall Inc, New Jersey, USA.
- Faturoti EO (2000) Beneath the ripples and sustainable fish production. Inaugural Lecture. Odunprints and pack, Nigeria.
- Oben BO (2000) Limnological Assessment of the impact of Agric PhD Thesis Dept. of Zoology University of Ibadan, Nigeria.
- Omoike A (1999) Enforcement of Inland fisheries laws and regulations in Edo, Delta and Ondo States M.SC. Dissertation Dept of Wildlife and Fisheries Mgt. University of Ibadan, Ibadan, Nigeria.
- Ita EO (1984) Kainji Lake in status of African Reservoir. In: Kapetsky JM, Petr T (eds). CIFA Tech. Pap/Doc. Tech. CPLA. Pg no: 43-104.
- Balogun JK (1988) The bio- ecology of the Niger perch Lates niloticus (linne) In the Kainji Lake PhD Thesis, Dept of Zoology University of Ibadan, Nigeria.
- Jinadu OO (1998) Bio-economic analysis of coastal artisanal fishing Operations in Lagos State Nigeria PhD Thesis Dept. of Zoology, U.I Ibadan, Nigeria.
- Arthington AH, Pusey BJ (2003) Flow restoration and protection in Australian rivers. River Research and Applications 19: 377-395.
- Egborge ABM (1970) The Plankton of Asejire PhD Thesis Dept. of Zoology University of Ibadan, Nigeria.
- FAO (1981) Methods of collecting and analyzing size and age data for fish stock assessment. FAO fish circ. Pg no: 100.
- Ikenna OK, Didigwu NC, Ejikeme OG (2017) Benthic Fish Fauna and Physicochemical Parameters of Otamiri River, Imo State, Nigeria. Fisheries and Aquaculture Journal 8: 1-8.
Citation: Omoike A (2021) The Trend in Fish Species Diversity and abundance at Asejire Reservoir South Western Nigeria. J Aquac Fisheries 5: 040.
Copyright: © 2021 Augustine Omoike, et al. This is an open-access article distributed under the terms of the Creative Commons Attribution License, which permits unrestricted use, distribution, and reproduction in any medium, provided the original author and source are credited.