Utilization of Poultry By-Product Meal as an Alternative Animal Protein Source in the Diet of Nile Tilapia (Oreochromis Niloticus)
*Corresponding Author(s):
Ahmed EODepartment Of Marine Resources, AL Neelain University, School Of Fish Science, Khartoum, Sudan
Tel:+249 920790284,
Email:egbalosman1@gmail.com
Abstract
This study was conducted to determine the possibility of using Poultry by-Product Meal (PBM) as an animal protein source for feeding Nile tilapia fry and determining its optimum inclusion level. The study continued for 8 weeks in four 300-liter fiberglass tanks. Each tank was stocked with 40 fry of an average weight of 4.4 g. Fish in the first tank were fed a control diet without (PBM), whereas the fish in the second, third and fourth tanks were fed diets containing 5%, 10% and 15% PBM, respectively. Diets were formulated according to their protein contents, and each contained 35% protein. The diets were made in the form of pellets. Fish were fed in all treatments in the beginning of the experiment at 3% of their body weight per day, but later the rate was increased to 4%. Percent weight gains were 118±2.10%, 127±2.04%, 127±2.23% and 154% {±-%} for treatments “1”, “2”, “3” and “4” respectively. No significant differences (P≤0.05) occurred between weight gains in all fish groups. Final average fish weight showed a significant difference (P<0.05) between the control fish and the fish that received the diet with 15% PBM. Treatment ”4” was also superior to the other treatments in Food Conversion Ratio (FCR) which was 1.96±3.01 compared to 2.40±0.34, 2.29±2.8 and 2.35±2.8 for the control, the 5% PBM diet and the 10% PBM diet, respectively. The study showed that the prices of the four diets were close to each other, but the 15% PBM diet was superior to other diets in the cost of feeding to produce fish due to having the best food conversion ratio among the treatments.
Keywords
Fish nutrition; Nile tilapia fry and Growth performances; Poultry by-product meal
INTRODUCTION
The global population continues to grow and forecasts exceeding 8 billion by the year 2030. The seafood consumption is predicted to reach between 150-160 million tons per year in 2030 [1]. With the decline in wild fish catches due to overexploitation of our fisheries resources; aquaculture will be called upon to fill this gap. Aquaculture is the cultivation of aquatic organisms with the intervention of man in the breeding process with the aim of increasing production, in operations such as reproduction, stocking, feeding and protection against predators, among others [2]. Aquaculture production is mostly destined for human consumption and 45.7% of the world’s fish production was accounted for human consumption in 2008 [3]. Currently, aquaculture is the fastest growing food producing sector globally. One of the most important freshwater fish species for aquaculture is Tilapia. They are native to Africa, but were introduced into many different regions of the world during the second half of the 20th century [4]. It has high yield potentials of output and it can be cultured by using simple technology in earthen ponds, tanks, raceways, etc. These qualities make it a good candidate for subsistence and commercial aquaculture. Feed is the single largest expenditure in semi-intensive and intensive fish culture and feeding cost accounts for about 30-70% of the total operational cost in a fish farm [5]. In aquaculture systems, the increasing price of feed due to expensive feed ingredient is considered one of the most important factors that limit profitability [6]. Thus, studies and researches are essential to develop economically viable feeds to further attain desirable return of investment among fish culturist [7]. One of the animal protein sources is Poultry by-Product Meal (PBM). PBM is made of ground, rendered, or clean parts of the carcass of slaughtered poultry. PBM is similar to Fishmeal (FM) in composition except being slightly lower in some amino acids. FM and PBM are generally highly digestible in protein (88%) and energy (82%). These digestibility values suggest that PBM could be used in aqua-feeds to a level similar to FM [8]. Poultry by-product meal has been investigated in the diet of several fish species in aquaculture [9-18]. There is a lack of information on nutritional quality of PBM produced in Sudan for Nile tilapia diets. This study was planned to determine the optimum inclusion level of PBM that could be used as an alternative protein-source feed ingredient in promoting growth and survival rate of Nile tilapia fry.
MATERIALS AND METHODS
Experimental fish and set-up
The study was conducted at the fish farm of the Faculty of Agricultural Technology and Fish Sciences at Al-Neelain University. The experiment lasted for eight weeks, in four cylindrical fiberglass tanks of equal size, with a capacity of 300 liters and provided with continuous aeration using aquarium air pumps and air stones. The fry were obtained from the college farm hatchery. They were collected from the spawning pond, placed in fiberglass tanks and left for two weeks to acclimate to the tanks and artificial food. Fry with approximately similar sizes were selected, weighed and randomly distributed among the four experimental tanks, with 40 fry of an average weight of 4.4±0.65 g stocked in each tank. At the end of the experiment, all fish in each tank were counted and weighed.
Formulation of experimental diets
The diets were prepared using peanut meal, wheat bran and sorghum, in addition to the PBM as the source of animal protein. The diets were formulated as presented in table 1 according to NRC Tables of Nutrient Composition of Fish Feeds [19]. The first diet was designated as a reference feed (control) and did not contain PBM. The second diet contains 5% PBM, and the third one contains 10% PBM, while the fourth contains 15% PBM (Table 2). All diets contained 35% protein. The peanut and sorghum were ground before using them, then after that, the quantities prescribed for each diet were weighed with a digital balance of 5 g resolution and a capacity of 30 kg. The ingredients of each diet were mixed well while dry, then an appropriate amount of water was added and then the diets were pelleted using an electric grinder with a 2 mm diameter disc. The diets were dried and the pellets were broken into smaller particles that fit the size of the fry using a manual grinder.
Feeding of the fish
The fish were fed daily at a rate of 3% of their body weight per day during the first two weeks and at 4% of their weight per day in the following weeks until the end of the experiment. The daily food ratio prescribed for each treatment was given in two doses, the first at around nine o'clock in the morning and the second at about five o'clock in the afternoon. All fish in each tank were weighed weekly with a digital balance of 1 gram resolution, to monitor the fish growth and to re-estimate the amount of food needed for daily feeding during the following week. The water temperature was measured daily in every tank in the morning. The experiment tanks were cleaned daily before the first food dose by removing fecal waste and dirt using a small water cartridge.
Calculation of growth parameters
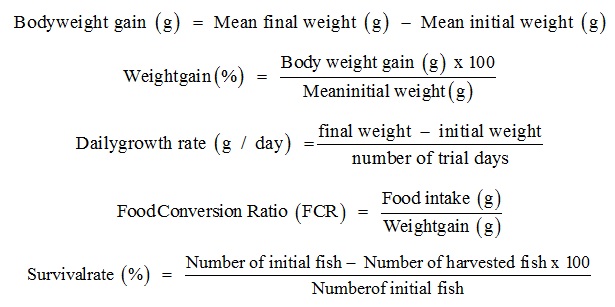
At the end of the experiment, all fish were weighed individually in each tank and the gained weight, the percentage increase in fish weight, the daily growth rate, the food conversion ratio, the survival rate and the food cost per treatment were calculated. Different performance criteria were calculated according to the following equations:
STATISTICAL ANALYSIS
The data obtained were analyzed using Statistical Package for Social Science (SPSS) Software (version 21), the means were tested for significance using (ANOVA, two way) and the post Hock test used the Least Significant Difference (LSD) test for the mean separation and the significance was defined at P<0.05.
|
Ingredient |
Moisture |
Crude protein |
Crude fat |
Ash |
Carbohydrate |
|
Peanut meal |
10.0 |
44.0 |
7.3 |
5.3 |
33.4 |
|
Wheat bran |
11.0 |
15.1 |
3.9 |
6.2 |
62.8 |
|
Sorghum |
10.0 |
11.3 |
2.8 |
1.7 |
74.2 |
|
PBM |
1.8 |
55.3 |
22.8 |
5.9 |
14.2 |
Table 1: Proximate chemical composition of feed ingredients (%).
|
Diet ingredients |
Diet 1 (Control) (35% protein) |
Diet 2 (PBM 5%) (35% protein) |
Diet 3 (PBM 10%) (35% protein) |
Diet 4 (PBM 15%) (35% protein) |
|
Peanut meal |
69.80 |
62.90 |
56.00 |
49.20 |
|
Wheat bran |
22.65 |
24.10 |
25.50 |
26.85 |
|
Sorghum |
7.55 |
8.00 |
8.50 |
8.95 |
|
PBM |
- |
5.00 |
10.00 |
15.00 |
|
Total |
100 |
100 |
100 |
100 |
Table 2: Formulation of the experimental diets (%).
RESULTS
The current study, showed that the average weight of the fish in the control treatment in which the fish were fed a diet without PBM increased from 4.4±0.65 g at the beginning of the experiment to 9.6±0.95 g at the end of the trial period, with an average gained weight of 5.2 g. The average weight of fishes that were fed on the diet containing 5% PBM increased from 4.4±0.65 g to 10.0±0.97 g at the end of the experiment, with an average gained weight of 5.6 g. The average weight of the fishes which were fed on the diet containing 10% PBM increased from 4.4±0.65 g to 10.0±0.97 g at the end of the experiment, with an average weight gain of 5.6 g, whereas the average weight of the fish that were fed on the diet containing 15% PBM increased from 4.4±0.65 g to 11.2±1.02 g at the end of the experiment, with an average weight gain of 6.8 g (Table 3, Figure 1). However, there were no significant differences (P≥0.05) of weight gain of the fishes fed on the different levels of PBM (Table 3). The percentage of weight gain was118±2.10% for the control diet, 127% for the 5% PBM diet, 127±2.04% for the 10% PBM diet and 154±1.98% for the 15% PBM diet (Figure 2).
The food conversion ratio was 2.40±0.34 for the control diet, 2.29±0.37 for the 5% PBM diet, 2.35±0.44 for the 10% PBM diet and 1.96±0.29 for the 15% PBM diet (Table 3).
The survival rate (%) of the fish fed on diets ”1”, “2” and “3” were 62.5±2.8%, while it was 50±3.01% for the fish fed on diet “4” (Table 3, Figure 3).
The temperatures recorded daily were the same in all tanks, and there was no significant variation in temperatures throughout the experiment period, with weekly average temperatures ranging between 31.2°C and 32.2°C.
|
Parameter |
Diet 1 Control |
Diet 2 5% PBM |
Diet 3 10% PBM |
Diet 4 15% PBM |
|
Initial weight (g) |
4.4±0.65a |
4.4±0.65a |
4.4±0.65a |
4.4±0.65a |
|
Final weight (g) |
9.6±0.95b |
10.0±0.97a |
10.0±0.97a |
11.2±1.02ab |
|
Weight gain (g) |
5.2±0.75b |
5.6±0.74a |
5.6±0.75a |
6.8±0.77ab |
|
Weight gain % |
118±2.10b |
127±2.04a |
127±2.23a |
154±1.98ab |
|
Daily gain (g) |
0.09±0.04b |
0.10±0.04a |
0.10±0.06a |
0.12±0.06ab |
|
Feed intake (g) |
12.47±1.23a |
12.83±1.20a |
13.17±1.28a |
13.34±1.28a |
|
FCR |
2.40±0.34a |
2.29±0.37a |
2.35±0.44a |
1.96±0.29b |
|
Survival % |
62.50±2.8a |
62.5±2.8a |
62.5±2.8a |
50.0±3.01b |
Table 3: Fish Performance in 8-weeks (means±SD).
Values in the same rows with different superscript letters are significantly different (P <0.05)
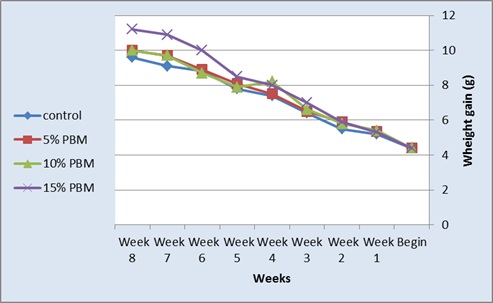 Figure 1: Fish growth rate (g) during the experiment.
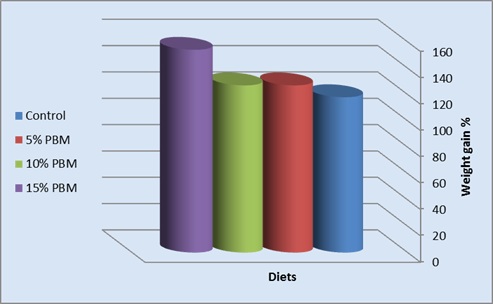 Figure 2: Weight gain (%) of fish at the end of the experiment.
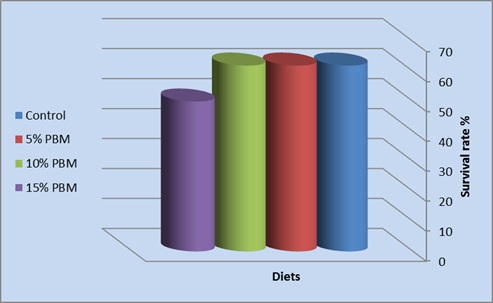 Figure 3: Survival rate (%) of fish at the end of the experiment.
DISCUSSION
High prices for animal protein sources such as fish meal led to the search for other alternatives to animal protein in fish food. One of the most promising alternatives is poultry by products meal. Studies have been conducted on the use of this source with many fish species such as Carp, Rainbow trout [20], Salmon [21], Tilapia [22], hybrid Strip bass [23], Nile Tilapia [24] and Red claw crayfish [25]. The use of poultry processing wastes as a substitute for dried fish meal resulted in a decrease in the growth rate in some of these studies but lead to a reduction in the cost of food.
In the current study, the increased weight of fish in each of the four treatments during the trial period indicates that the fish were accepting and consuming the diets used in the study.
The results obtained in this study indicate that the use of PBM in feeding of fry Tilapia has improved the performance of these fishes (Table 3). Growth was better in varying degrees in these treatments compared to the control diet that contained only plant protein sources. Animal protein ingredients (such as poultry by-product meal) have good content of amino acids, high protein content, dry matter and digestible protein and energy similar to fish meal [26,27]. In the present study, the PBM product used had an equally high protein content, a lower ash content and higher lipid content. This nutritional profile can make it as a dietary ingredient to meet the stringent requirements of the pet food industry, the main market for this ingredients [26,28]. This is consistent with what Wu and Jan [29] and others have mentioned that animal protein source is better than plant protein for feeding Tilapia. In the present study, fish fed on the 5% PBM, 10% PBM and 15% PBM diets had higher feed efficiency, the weight gain (%) increased by the end of the experiment to 118%, 127% and 154% respectively. Statistically, no significant difference (P≥0.05) occurred between weight gains of fish that were fed on the diets containing PBM. The results demonstrated that incorporated dietary PBM could positively improve the feed utilization for the fry of Tilapia. Final average weight of fish in treatment “4” (15% PBM) was significantly different (P<0.05) from that of the control fish (treatment “1”). As a result of the superiority of the treatment “4” fish, their daily growth rate was the best compared to the other treatments, as it reached 0.12 g /day compared to 0.09 g/day for the control treatment and 0.1 g/day for both treatments “2” and “3”. The diet containing 15% PBM also outperformed the rest of the treatments in the food conversion ratio of 1.96 compared to 2.4, 2.29 and 2.35 for treatment “1”, “2” and “3” respectively. Fish performance improved in all treatments whose fish received PBM in their diet, especially fish that received the highest percentage of PBM (15%) compared to the control diet due to the quality of the PBM protein. It was better balanced in the essential amino acids than plant sources that are usually deficient in methionine and lysine.
According to the current feed prices in the state of Khartoum, there were little differences in the costs of the four experimental diets, with diet “4” (15% PBM) having the lowest feed cost (3.4 pounds/kg) and the control feed (without PBM) with the highest feed cost (3.59 pounds/kg). However, when considering the Food Conversion Rate (FCR) to compare the cost of food required for fish production, it is clear that the diet containing 15% PBM was superior to the other diets as it showed the lowest food cost to produce 1 kg of fish. The cost was 6.66 pounds/kg of fish compared to 8.62 pounds/kg of fish for treatment “1” (control), 8.04 pounds/kg of fish for treatment “2” (5% PBM) and 8.11 pounds/kg of fish for treatment “3” (10% PBM).
The results of this study indicate that the use of poultry by products in the diet of Nile Tilapia fry leads to improving the rate of growth of these fishes and reducing the cost of food for the production of these fishes, which contributes to improving the economic feasibility of fish farming in the country.
CONCLUSION
The study showed that the use of poultry waste powder in fish feed diets increased the growth rate of Nile tilapia fry compared to the reference diet that did not contain poultry waste powder. The study also showed that 15% inclusion of the poultry waste powder in the diet is the best inclusion rate compared to the rest of the treatments in terms of growth rate and feed cost for tilapia fry.
REFERENCES
- http://www.fao.org/News/2000/000704-e.htm
- FAO (1990) The definition of aquaculture and collection of statistics. Aquaculture Minutes 7.
- FAO (2010) The state of world fisheries and aquaculture. Fisheries and Aquaculture Department, FAO, Rome. Pg no: 197.
- Pillay TVR (1990) Aquaculture principles and practices. Fishing News Books, Blackwell Science, Oxford, UK. Pg no: 575.
- El-Sayed AFM (2004) Protein nutrition of farmed Tilapia: Searching for unconventional sources. In: Bolivar RB, Mair GC, Fitzsimmons K (eds.). New dimensions on farmed tilapia,’ Proc. of the 6th international symposium on tilapia in aquaculture. ISTA Publications, Manila, Philippines. Pg no: 364-378.
- Tagwireyi T, Mupangwa JF, Jepsen J, Mwera P (2008) Effect of feeding Moringaoleifera leaf meal on the growth performance of Oreochromisniloticus fry. 3rd International Research and Practice in Appropriate Technology-Energy Solution in the Era of Climate Change, Kigali, Rwanda.
- Lunger AN, Craig SR, McLean E (2006) Replacement of fish meal in cobia (Rachycentron canadum) diets using an organically certified protein. Aquaculture 257: 393-399.
- Yang Y, Xie S, Cui Y, Lei W, Zhu X, et al. (2004) Effect of replacement of dietary fish meal by meat and bone meal and poultry by-product meal on growth and feed utilization of gibel carp, Carassius auratus gibelio. Aquaculture Nutrition 10: 289-294.
- Emre Y, Sevgili H, Diler I (2003) Replacing fish meal with poultry by-product meal in practical diets for mirror carp (Cyprinus carpio) Turkish Journal of Fisheries and Aquatic Sciences 3: 81-85.
- Sevgili H, Erturk M (2004) Effects of replacement of fish meal with poultry by-product meal on growth performance in practical diets for rainbow trout, Onchorynchus mykiss. Journal of the Faculty of Agriculture 17: 161-167.
- Rawles SD, Riche M, Gaylord TG, Webb J, Freeman DW, et al. (2006) Evaluation of poultry by-product meal in commercial diets for hybrid striped bass (Morone chrysops ? × M. saxatilis ?) in recirculated tank production. Aquaculture 259: 377-389.
- Cruz-Suárez LE, Nieto-Lopez MG, Guajardo-Barbosa C, Tapia-Salazar M, Scholz U, et al. (2007) Replacement of fish meal with poultry by-product meal in practical diets for Litopenaeus vannamei, and digestibility of the tested ingredients and diets. Aquaculture 272: 466-476.
- Guimarães IG (2008) Nutrient digestibility of cereal grain products and by-products in extruded diets for Nile tilapia. Journal of the World Aquaculture Society 39: 781-789.
- Booth MA, Allan GL, Anderson AJ (2012) Influence of poultry meal, meat meal or soybean meal inclusion on weight gain and production characteristics of Australian snapper Pagrus auratus. Aquaculture International 20: 99-115.
- Baboli MJ, Dawodi M, Gorjipor A (2013) Effect of replacement dish meal by poultry meal on growth, survival and body composition of rainbow trout. Int. Research journal of Applied and Basic Sciences 4: 4197-4201.
- Gunben EM, Senoo S, Yong A, Shapawi R (2014) High potential of poultry by-product meal as a Main Protein Source in the formulated feeds for a commonly cultured grouper in Malaysia (Epinephelus fuscoguttatus). Sains Malaysiana 43: 399-405.
- Mohamadsalehi A, Baboli MJ (2015) Replacement of fish meal with poultry by-product meal on body composition in practical diets for beluga sturgeon (Huso huso). AACL BIOFLUX l8: 2.
- Zou H, Bai X, Feng Y, Zhang Y, Wang Y, et al. (2016) Influence of long (16L:8D) and short (8L:16:D) photoperiods on blood metabolites and hepatic metabolism in Olive flounder, Paralichthys olivaceus. Springerplus 15: 924.
- NRC series (1977) Nutrient requirements of domestic animals: nutrient requirements of warmwater fishes. National Academy of Science, Washington D.C., USA. Pg no: 76.
- Gouveia AJR (1992) The use of poultry by-product and hydrolised feather meal as a feed for rainbow trout (Oncorynchu smykiss). Publicacoes do Instituto de Zoologia. Pg no: 24.
- Higgs DA, Markert JR, Macourarie DW, Mcbride JR, Dosanjh BS, et al. (1979) Development of practical dry diets for coho salmon, Oncorynchuskisutch, using poultry by-product meal, feather meal, soybean meal and and rapeseed meal as major protein sources. Tiews K, Halver JE (Eds.). Finfish Nutrition and Fish Feed Technology, Vol. II, HieennemannGmbh, Berlin: 191-218.
- Sadiku SOE, Jauncey K (1995) Soybean flour-poultry meat meal blend as dietary protein source in practical diets of Oreochromisniloticus and Clariasgariepinus. Asian Fisheries Science 8: 159-167.
- Gaylord TG, Rawles SD (2005) The modification of poultry by-product meal for use in hybrid striped bass morone chrysops ×m. saxatilis diets. J World Aquac Soc 36: 363-374.
- Soltan MA (2009) Effect of dietary fish meal replacement by poultry by-product meal with different grain source and Enzyme supplementation on performance, feces recovery, body composition and nutrient balance of Nile tilapia. Pakistan Journal of Nutrition 8: 395-407.
- Soaud IP, Rodgers LJ, Davis DA, Rouse DB (2008) Replacement of fish meal with poultry by-product meal in practical diets for redclaw crayfish (Cherax quadricarinatus). Aqua Cult Nutr 14: 139-142.
- Bureau DP, Harris AM, Cho CY (1999) Apparent digestibility of rendered animal protein ingredients for rainbow trout. Aquaculture 180: 345-358.
- Zhou QC, Zhao J, Li P, Wang HL, Wang LG (2011) Evaluation of poultry by-product meal in commercial diets for juvenile cobia (Rachycentron canadum). Aquaculture 322-323: 122-127.
- Yang Y, Xie SQ, Cui YB, Zhu XM, Lei W, et al. (2006) Partial and total replacement of fishmeal with poultry by-product meal in diets for gibel carp, Carassius auratus gibelio Bloch. Aquacult Res 37: 40-48.
- Wu J, Jan L (1977) Comparison of Nutritive Value of Dietary Protein in Tilapia aurea. J Fish S Taiwan 5: 55-60.
Citation: Ahmed EO, Ahmed ENB, Abadalla AAA, Musa MG (2020) Utilization of Poultry By-Product Meal as an Alternative Animal Protein Source in the Diet of Nile Tilapia (Oreochromis Niloticus). J Aquac Fisheries 4: 031.
Copyright: © 2020 Ahmed EO, et al. This is an open-access article distributed under the terms of the Creative Commons Attribution License, which permits unrestricted use, distribution, and reproduction in any medium, provided the original author and source are credited.