Cardiac Muscle Protein Catabolism in dbdb Obese Mice, a Type II Diabetes Mellitus Model
*Corresponding Author(s):
Xiaonan H WangDepartment Of Medicine, Renal Division, Emory University, Atlanta, Georgia, United States
Tel:+1 4047278654, +1 4047271798
Fax:+1 4047273425
Email:xwang03@emory.edu
Abstract
Muscle wasting (skeletal and cardiac) is associated with increasing morbidity and mortality. Muscle wasting is primarily the result of increased proteolysis within muscle that leads to excessive degradation of structural proteins such as actin. Accelerated muscle protein degradation is associated with insulin resistance. Muscle protein metabolism in cardiac muscle under conditions of insulin resistance has been understudied. In the current study, we measured protein degradation in cardiac muscle of db/db obese mice. Insulin resistance increased degradation of both soluble and the myofibrillar protein. Insulin/IGF-1 signaling pathways regulate cardiac muscle proteolysis. In the heart muscles from db/db mice, we found that Insulin Receptor Substrate-1 (IRS-1) tyrosine phosphorylation and Akt phosphorylation were decreased causing decreased insulin signaling, and transcription factors FoxO 1 and 3 are dephosphorylated (activated) leading to increased protein degradation. Expression of E3 ubiquitin mRNAs and chymotrypsin-like activity of the proteasome were increased, indicating that the ubiquitin-proteasome system was activated in obese mouse heart. Cardiac muscle protein catabolism was associated with increased serum free fatty acid and inflammatory cytokines in heart, as well as decreased plasma levels of adiponectin. In our previous study, we showed that a decrease in adiponectin and increase in free fatty acid could cause insulin resistance and muscle proteolysis. In this study, we conclude that insulin resistance (resulting from reduced IRS-1/Akt signaling), associated with activation of the ubiquitin-proteasome proteolytic pathway, results in accelerated proteolysis in obese cardiac muscle.
INTRODUCTION
Loss of protein stores and a decline in lean body mass are associated with increasing morbidity and mortality rates, which have become a major clinical problem [1]. It is becoming increasingly evident from patient and animal models that insulin- resistant states, such as type 2 diabetes mellitus [2] and obesity [3], stimulate protein catabolism. Loss of muscle protein is also observed in type 1 diabetes and other clinical conditions that are characterized by insulin resistance, including chronic renal failure, trauma, burn injuries, sepsis, cancer, and heart failure [4-6].
Insulin is a major hormone involved in the regulation of protein metabolism in muscle. Studies of mechanisms that cause muscle protein catabolism in diabetes have used a variety of experimental models, including cultured muscle cells, incubated muscles, perfused muscle preparations, and animal models, as well as been investigated directly in humans [2,4,5,7,8]. Generally, it has been concluded that insulin changes protein turnover in muscle in the following two ways: by stimulating protein synthesis and by inhibiting protein degradation. Surprisingly, in studies of humans, insulin induces little or no increase in muscle protein synthesis; however, insulin suppresses protein degradation [9]. In animals, insulin deficiency results in increased muscle protein degradation in vivo [5,7]. In addition, insulin also suppresses protein degradation in cultured muscle cells [10]. In studies in which insulin is administered to patients with type 1 diabetes, it has been shown that the principal effect of insulin on protein metabolism is to suppress protein degradation [11]. Insulin deprivation in diabetic patients stimulates whole body protein degradation and amino acid oxidation.
This problem is even more serious within the cardiac muscles of diabetics. There have been multiple reports that cardiac muscle proteins turnover at rates 1.5- to 3-fold higher than skeletal muscle [12]. Studies have proven that cardiac mass is significantly decreased in db/db mice and in Muscle specific Insulin Receptor Knockout mice (MIRKO) [13]. Moreover, providing insulin to type 1 diabetic patients has not been wholly successful in preventing or reversing muscle protein loss due to insulin resistance [14]. The pathogenic relationship among insulin resistance and its muscular protein loss, however, remains poorly understood. The consequences of increased cardiac muscle proteolysis include decreased heart function, such as decreased aortic pressure and velocity, which contribute to increasing morbidity and mortality [15].
In previous studies, we found that rats with acute diabetes produced by Streptozotocin (STZ) injection exhibit muscle atrophy that is due to acceleration of the Ubiquitin-Proteasome System (UPS) within the muscle, including increased transcription of genes encoding ubiquitin and subunits of the proteasome [5,7]. The initial ubiquitin conjugation process requires ATP and three enzymatic components, E1, E2, and E3. E1 (Ub-activating enzyme) and E2 (Ub-carrier or conjugating proteins) prepare Ub for its conjugation to the substrate protein. Specific E3 enzymes (Ub-protein ligases) recognize substrate proteins and with the E2 carrier protein, transfer the activated Ub to lysine residues in ubiquitin. Two muscle-specific ubiquitin E3 ligases, muscle-specific RING-finger 1 (TRIM63; also named MuRF1) and MAFBX (also named atrogin-1), are strikingly induced in almost all types of atrophy. The chain of ubiquitins is recognized by the 26S proteasome, which degrades the substrate protein. The UPS is activated in several catabolic conditions (e.g., diabetes) [6,16].
The UPS acts in coordination with caspase-3 to initiate the cleavage of the complex structure of muscle protein-forming substrates to be degraded by the ubiquitin-proteasome [17]; thus, attenuated caspase-3 activity in muscle reduces protein loss [18]. In addition, caspase-3 cleaves specific subunits of the 19S proteasome to stimulate proteolytic activity by the 26S proteasome. These actions result in highly coordinated processes that degrade muscle proteins [19].
In obesity, adiponectin, a cytokine produced by adipocytes, can have a critical impact on protein metabolism in muscle [3]. Adiponectin is also called ACRP30, AdipoQ, apM1, and GPB28 by the different laboratories that identified it independently in 1995 and 1996. Adiponectin is the most abundant gene product (2-10 µg/ml in humans) in adipose tissue and accounts for 0.01% of the total plasma protein [20] that is found in multimeric complexes in healthy human subjects [7]. Expression of adiponectin is activated during adipogenesis, but feedback inhibition of its production may occur in the development of obesity [21]. Plasma adiponectin levels have been repeatedly observed to be lower in insulin-resistant states, such as obesity and type 2 diabetes [22]. In addition, adiponectin has direct anti-inflammatory effects, including the reduction of TNFα secretion from macrophages [23] [23]. TNFα has been well recognized as a bioactive substance from adipose tissue that controls the functions of other organs [7]. TNFα impairs insulin signaling directly by increasing serine phosphorylation of IRS-1 [4], which in turn inhibits the insulin receptor and IRS-1, and indirectly by increasing serum Free Fatty Acids (FFAs), which induce insulin resistance in multiple tissues [2]. Previously, we studied the effect of adiponectin on protein metabolism in skeletal muscle [2,3], and in this study, we explored the impact of adiponectin on cardiac muscle.
The aim of this study was to investigate the changes in protein metabolism resulting from changes in adiponectin, free fatty acids, and inflammatory cytokines in the cardiac muscle of obese db/db mice. We assayed cardiac muscle protein degradation and insulin signaling in db/db mice, a type 2 diabetes model, to determine the impact of insulin resistant on cardiac muscle protein turnover. Our results provide evidence that insulin resistance is associated with an increase in total protein and myofibrillar protein degradation in cardiac muscle by modulating the activity of the UPS.
METHODS
Animals
Plasma insulin was measured using 1-2-3 ultra-sensitive mouse insulin Enzyme Immunoassay (EIA) kit (American Lab, Windham, NH). Blood glucose concentration was measured by the Accu-CHEK advantage blood glucose meter (Indianapolis, IN). Mouse plasma adiponectin concentration was measured using a mouse adiponectin ELISA kit (ALPCO, Windham, NH). Serum FFA concentrations were measured by the colorimetric determination of Nonesterified Fatty Acids (NEFA) using the NEFA kit (Wako Chemicals, Richmond, VA).
Protein degradation
To assay the degradation of cardiac muscle soluble protein, we used a modification of the proteolysis assay reported by Goldberg and colleagues [26]. In brief, heart was removed and freeze-clamped in liquid nitrogen. Muscle extracts were prepared by pulverizing cardiac muscle in liquid nitrogen, homogenizing the powder in ice-cold harvest buffer. Muscle extracts were then dialyzed against buffer to remove accumulated tyrosine. Aliquots of each extracts were incubated for 2 hours at 37oC in 0.5 ml of reaction buffer with an ATP-generation system (1 mM ATP; 100 µ/ml Creatine phosphokinase; 10 mM Creatine phosphate and 250 μg/ml ubiquitin). Reaction was stopped with Trichloroacetic Acid (TCA), precipitated proteins were removed by centrifugation, and free tyrosine was measured fluoremetrically to calculate the rate of protein degradation.
Myofibrillar protein degradation was measured by the level of the 14-kDa actin fragment. To measure this actin fragment, muscles were harvested and homogenized in hypotonic buffer (0.5 M HEPES-KOH - pH 7.5; 10 mM MgCl2; 1 mM EDTA; 1 mM EGTA and fresh added proteases inhibitors). The pellet fraction of the muscle homogenate was solubilized in 2X Laemmli sample buffer, boiled for 10 min. The levels of the 14-kD actin fragment were detected by standard western blotting. Proteins were separated by electrophoresis on a 15% SDS polyacrylamide gel. Actin cleavage was detected by an antibody against the C-terminal actin fragment (recognizes the c- terminal 11 amino acids of actin) (Sigma-Aldrich, St. Louis, MO).
Western blot and antibodies
Cardiac muscle histology
Proteasome activity
Reverse transcription and Polymerase Chain Reaction (PCR) for mRNA
For conventional PCR, Platinum PCR super mixture (Invitrogen) was used for PCR. Primers for specific genes were designed to cross intro-exon boundaries and used to generate amplicons in their linear ranges as: adiponectin (U37222; product: 532bp), F: 5’-GAT TCA ACT TGC GCC TCA TCT TAG GC-3’, R: 5’-CCG ACG TTA CTA CAA CTG AAG AGC-3’. TNFα (NM_11731; product: 212 bp), F: 5’-TCT CAT CAG TTC TAT GGC CC-3’, R: 5’-GGG AGT AGA CAA GGT ACA AC-3’. IL-6 (NM_031168; product: 343bp), F: 5’-GCC AGA GTC CTT CAG AGA GAT ACA G-3’, R: 5’-CCC AAC GAT TCA TAT TGT CAG-3’. For each sample, 18S rRNA was used as an internal control.
Quantitative real-time PCR (q-PCR) was performed on CFX ConnectTM Real- Time PCR Detection System (Bio-Rad, Hercules, CA) using SsoAdvUniver SYBR GRN SMX (Bio-Rad). The following cycle parameters were used: 94°C for 2 minutes and 40 cycles at 94°C for 15 seconds, 55°C for 30 seconds with final extension at 72°C for 10 minutes. The quantification Cycle (Cq) values were defined as the number of cycles required for the fluorescence signal to exceed the detection threshold. Individual mRNA expression was standardized to 18S gene and expression was calculated as the difference between the threshold values of the two genes (ΔΔcq). Melting curve analysis was routinely performed to verify the specificity of the reaction. Primers were designed to cross intron-exon boundaries. They were used to generate amplicon in their linear ranges. Primers used in this study were: mouse MAFBX/atrogin-1, F 5’-GCA GAG AGT CGG CA AGTC-3’, R 5’-CAG GTC GGT GAT CGT GAG-3’; mouse TRIM63/MuRF-1, F 5’-CAA CCT GTG CCG CAA GTG-3’, R 5’-CAA CCT CGT GCC TAC AAG ATG-3’.
Statistical analysis
RESULTS
Protein degradation was increased in the cardiac muscle of obese db/db mice
The rate of total protein degradation in the cardiac muscle of the db/db mice was 1.15-fold higher in the 3-week-old db/db mice and 1.4-fold higher at 10 weeks than the rate measured in cardiac muscle of WT mice of the same ages (Figure 1A). To evaluate this finding in more detail, we measured the degradation of soluble proteins in the heart muscle. The degradation of soluble proteins was not significantly different in the 3-week-old db/db mice and was 1.3-fold higher in the cardiac muscle of the 10- week-old mice compared to that in the cardiac muscle of the WT mice (Figure 1B). The degradation of the myofibrillar proteins was assessed by actin cleavage [17]. The myofibrillar protein breakdown, characterized by a 14-kDa actin fragment, in the cardiac muscle of db/db mice was 1.8-fold higher in the 3-week-old mice and 2.9-fold in 10-week-old db/db mice than that in the WT mice (Figure 1C). These results indicate that protein degradation is higher in the db/db mouse heart. The increase in myofibrillar protein breakdown happens earlier and to a greater extent than soluble protein degradation.
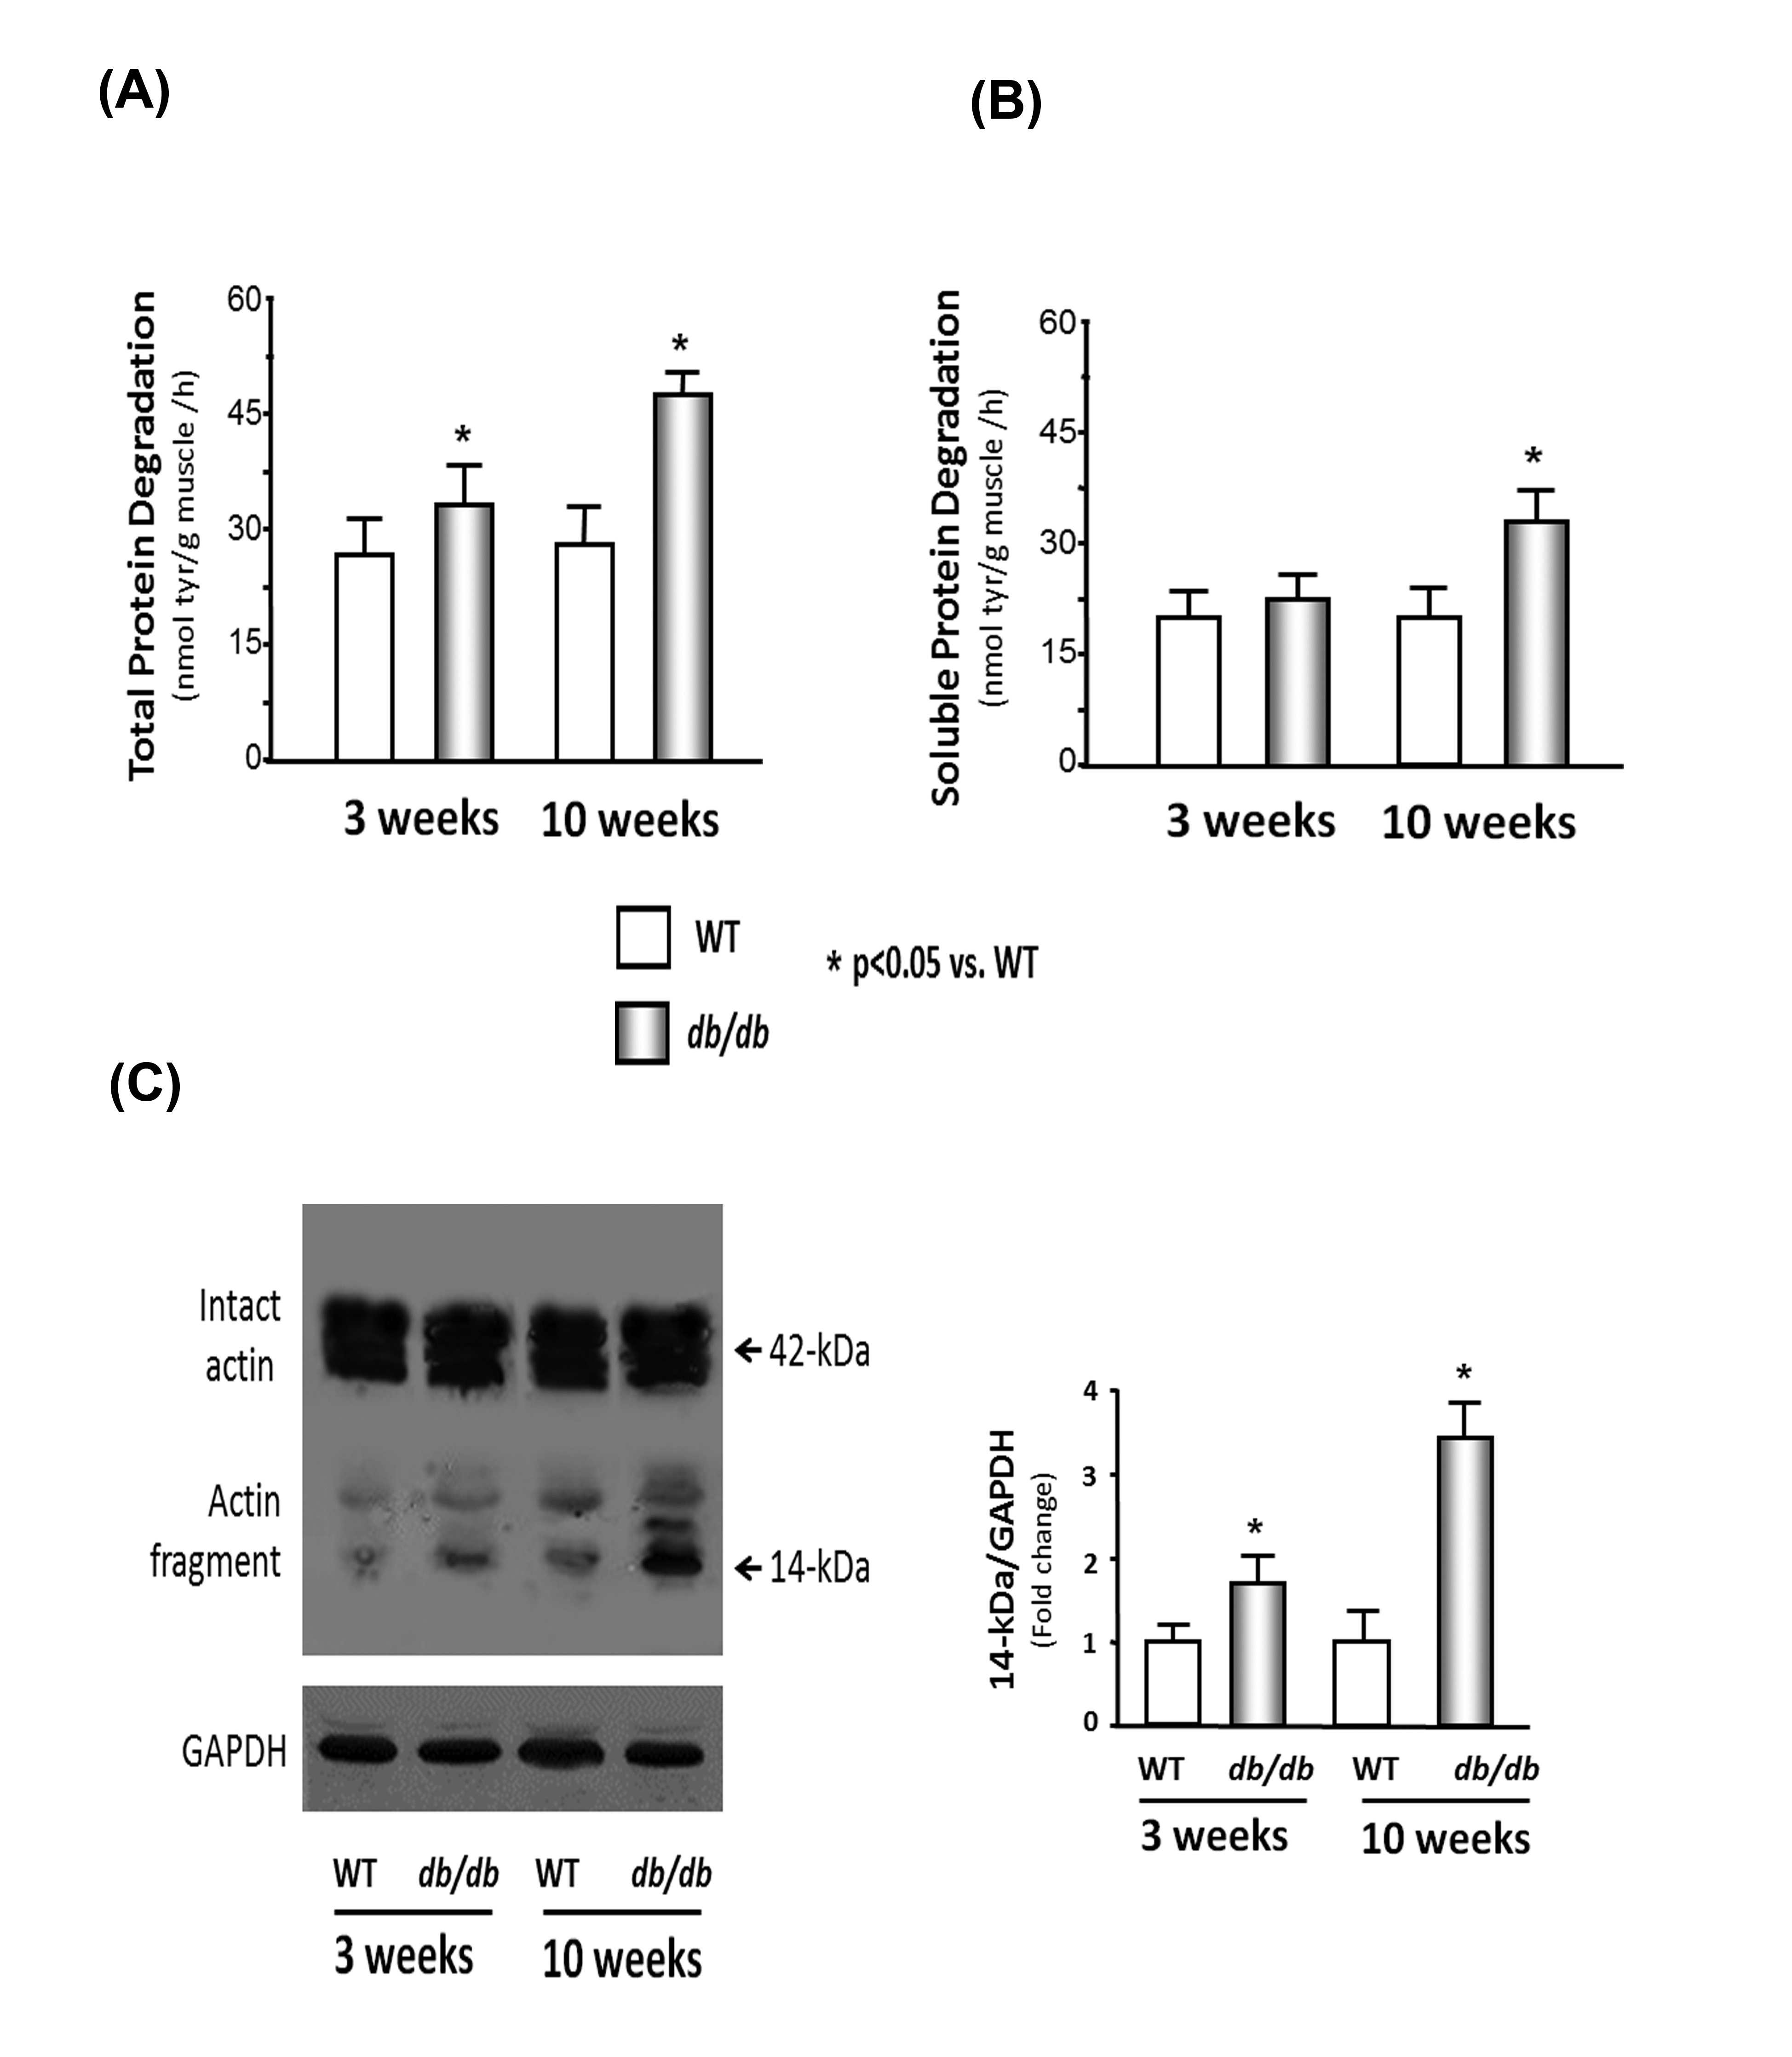 Figure 1: Protein degradation is elevated in the cardiac muscle of db/db mice.
(B) Soluble protein degradation was measured by tyrosine release from cardiac muscle extracts of WT and db/db mice.
(C) Actin cleavage was measured in WT and db/db mice. Western blot analysis of heart muscle protein shows both intact actin (42-kDa) and the 14-kDa actin fragment cleavage product (indicated by arrows). GAPDH (bottom panel) was used as a loading control. The bar graph shows the mean value of the 14- kDa fragment band intensity, expressed as a fold-change of WT value after normalization by the density of the GAPDH bands.
Insulin and the IGF-1 signaling pathway were down-regulated in the hearts of db/db mice
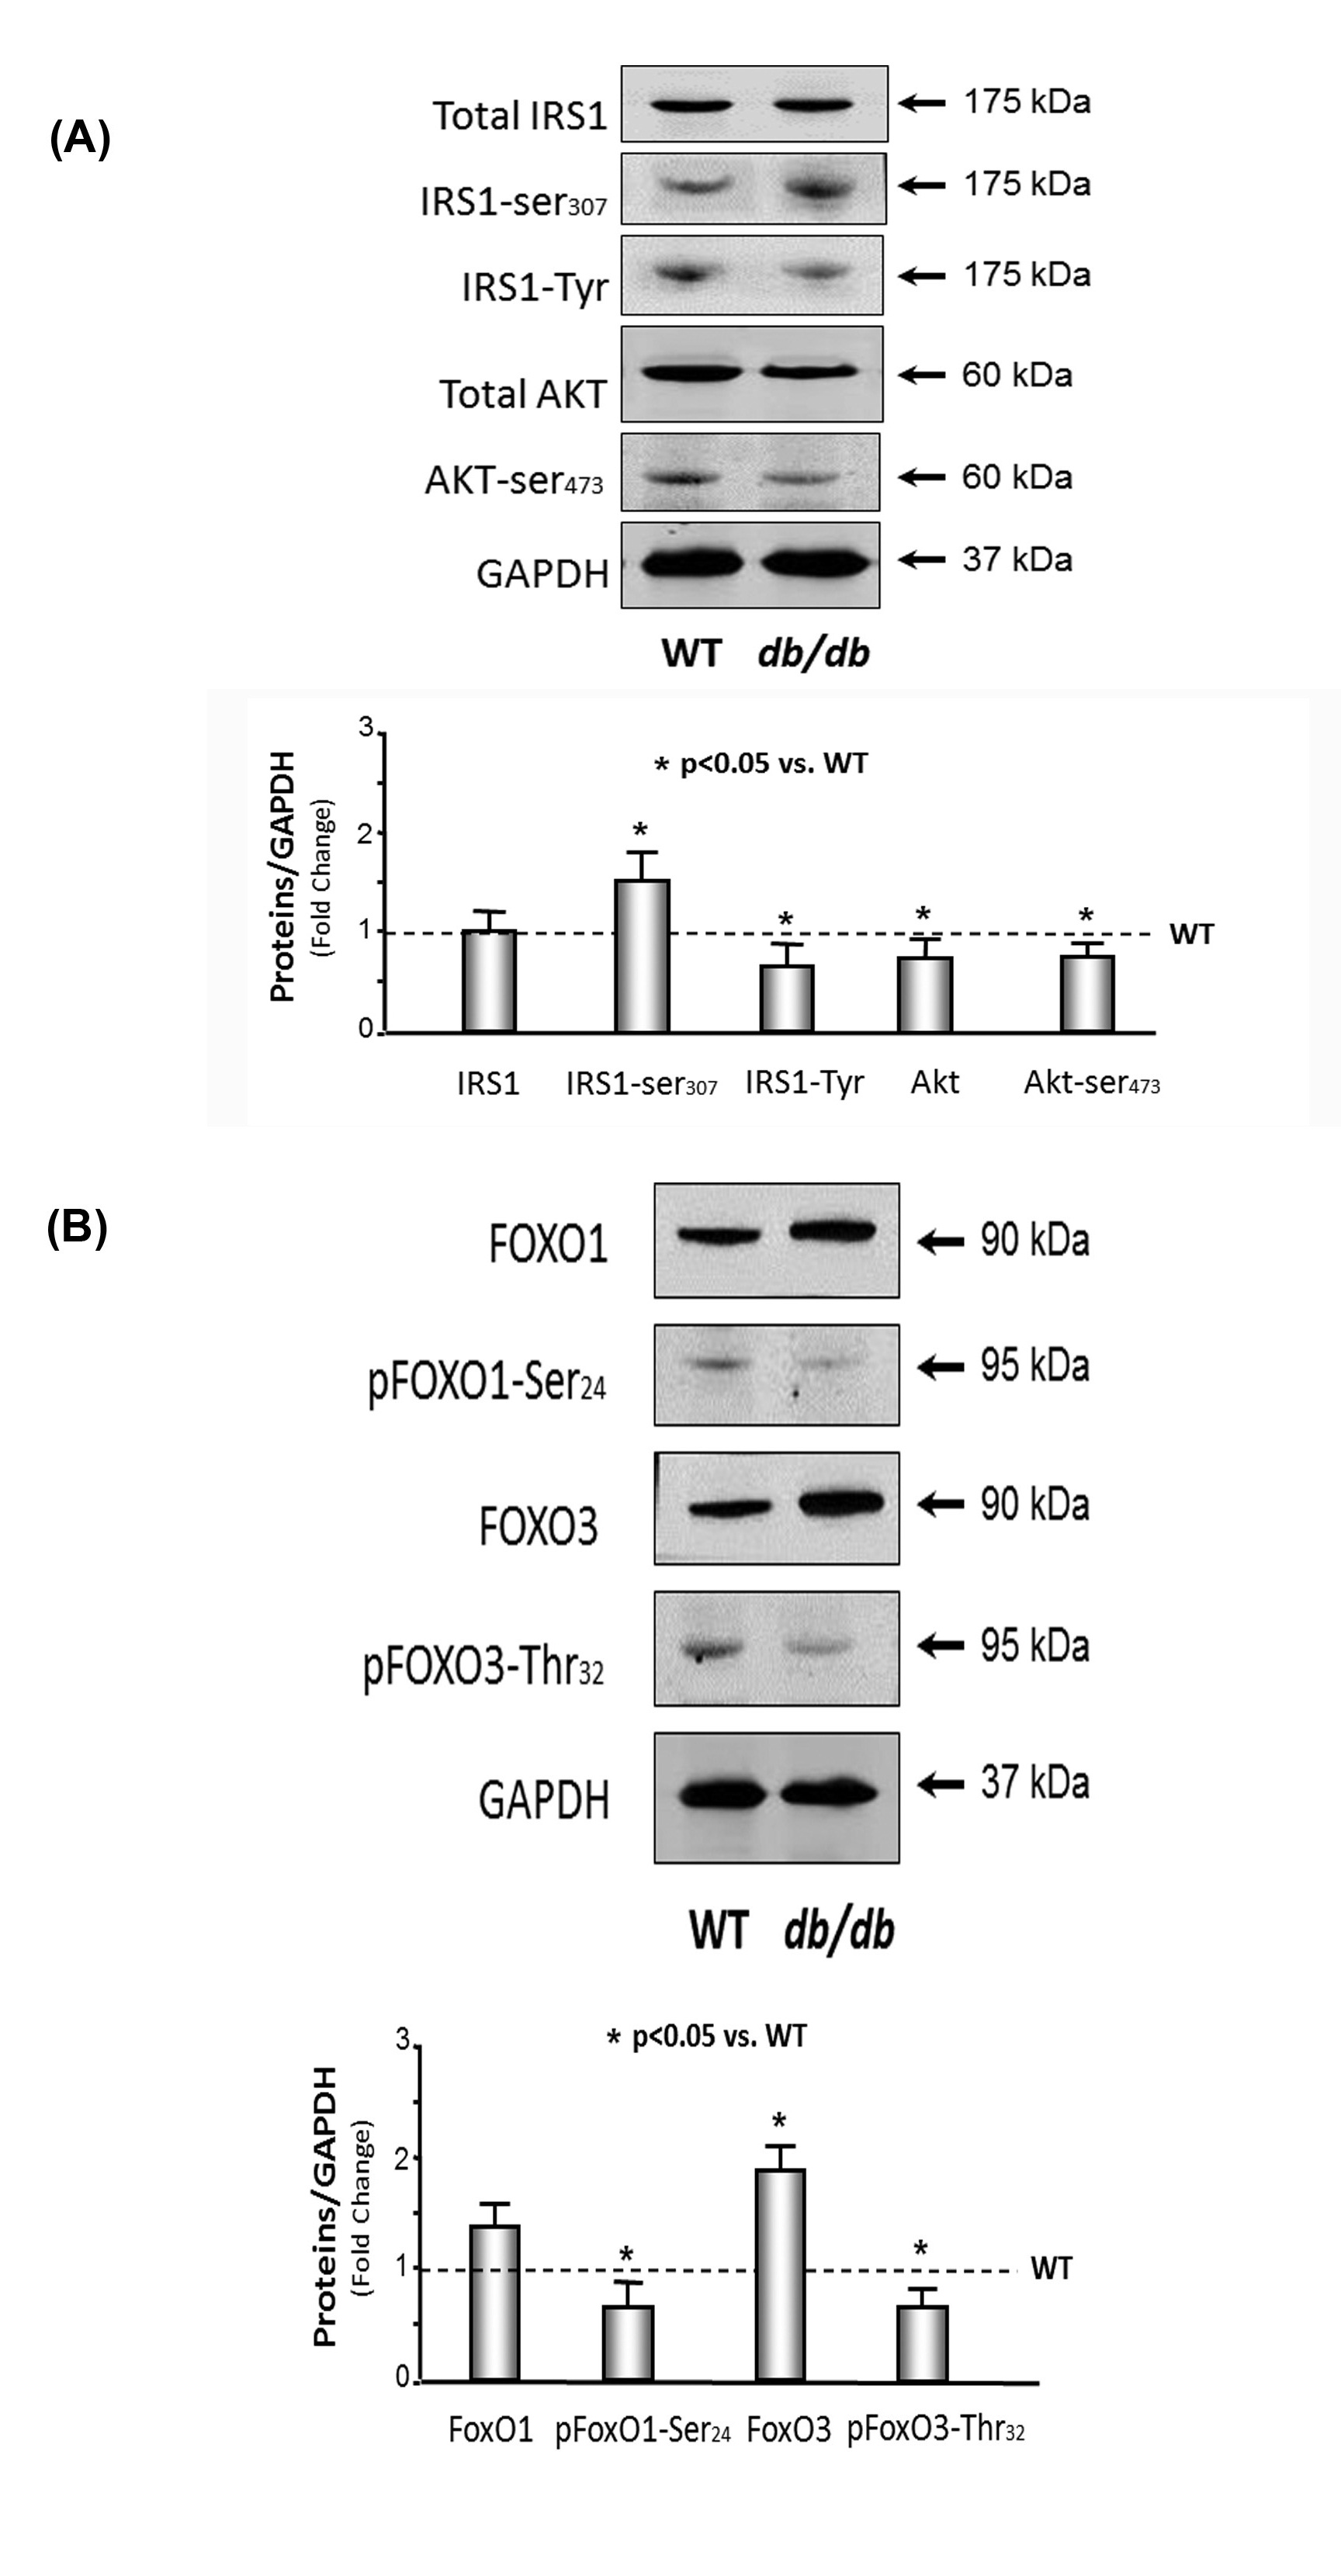
(B) FoxO1 and 3 were activated in the muscle of db/db mice. The protein catabolism factors FoxO1 and FoxO3 were measured by Western blotting in cardiac muscle lysates from WT and db/db mice. The bar graph compares the densities of protein bands in each group expressed as a fold-change from levels in WT mice which is represented by a line at 1-fold. All band densities were normalized to the density of GAPDH (Bars: mean ± SE; n=9/group; *p<0.05 vs. WT mice).
Activation of the UPS in the hearts of db/db mice
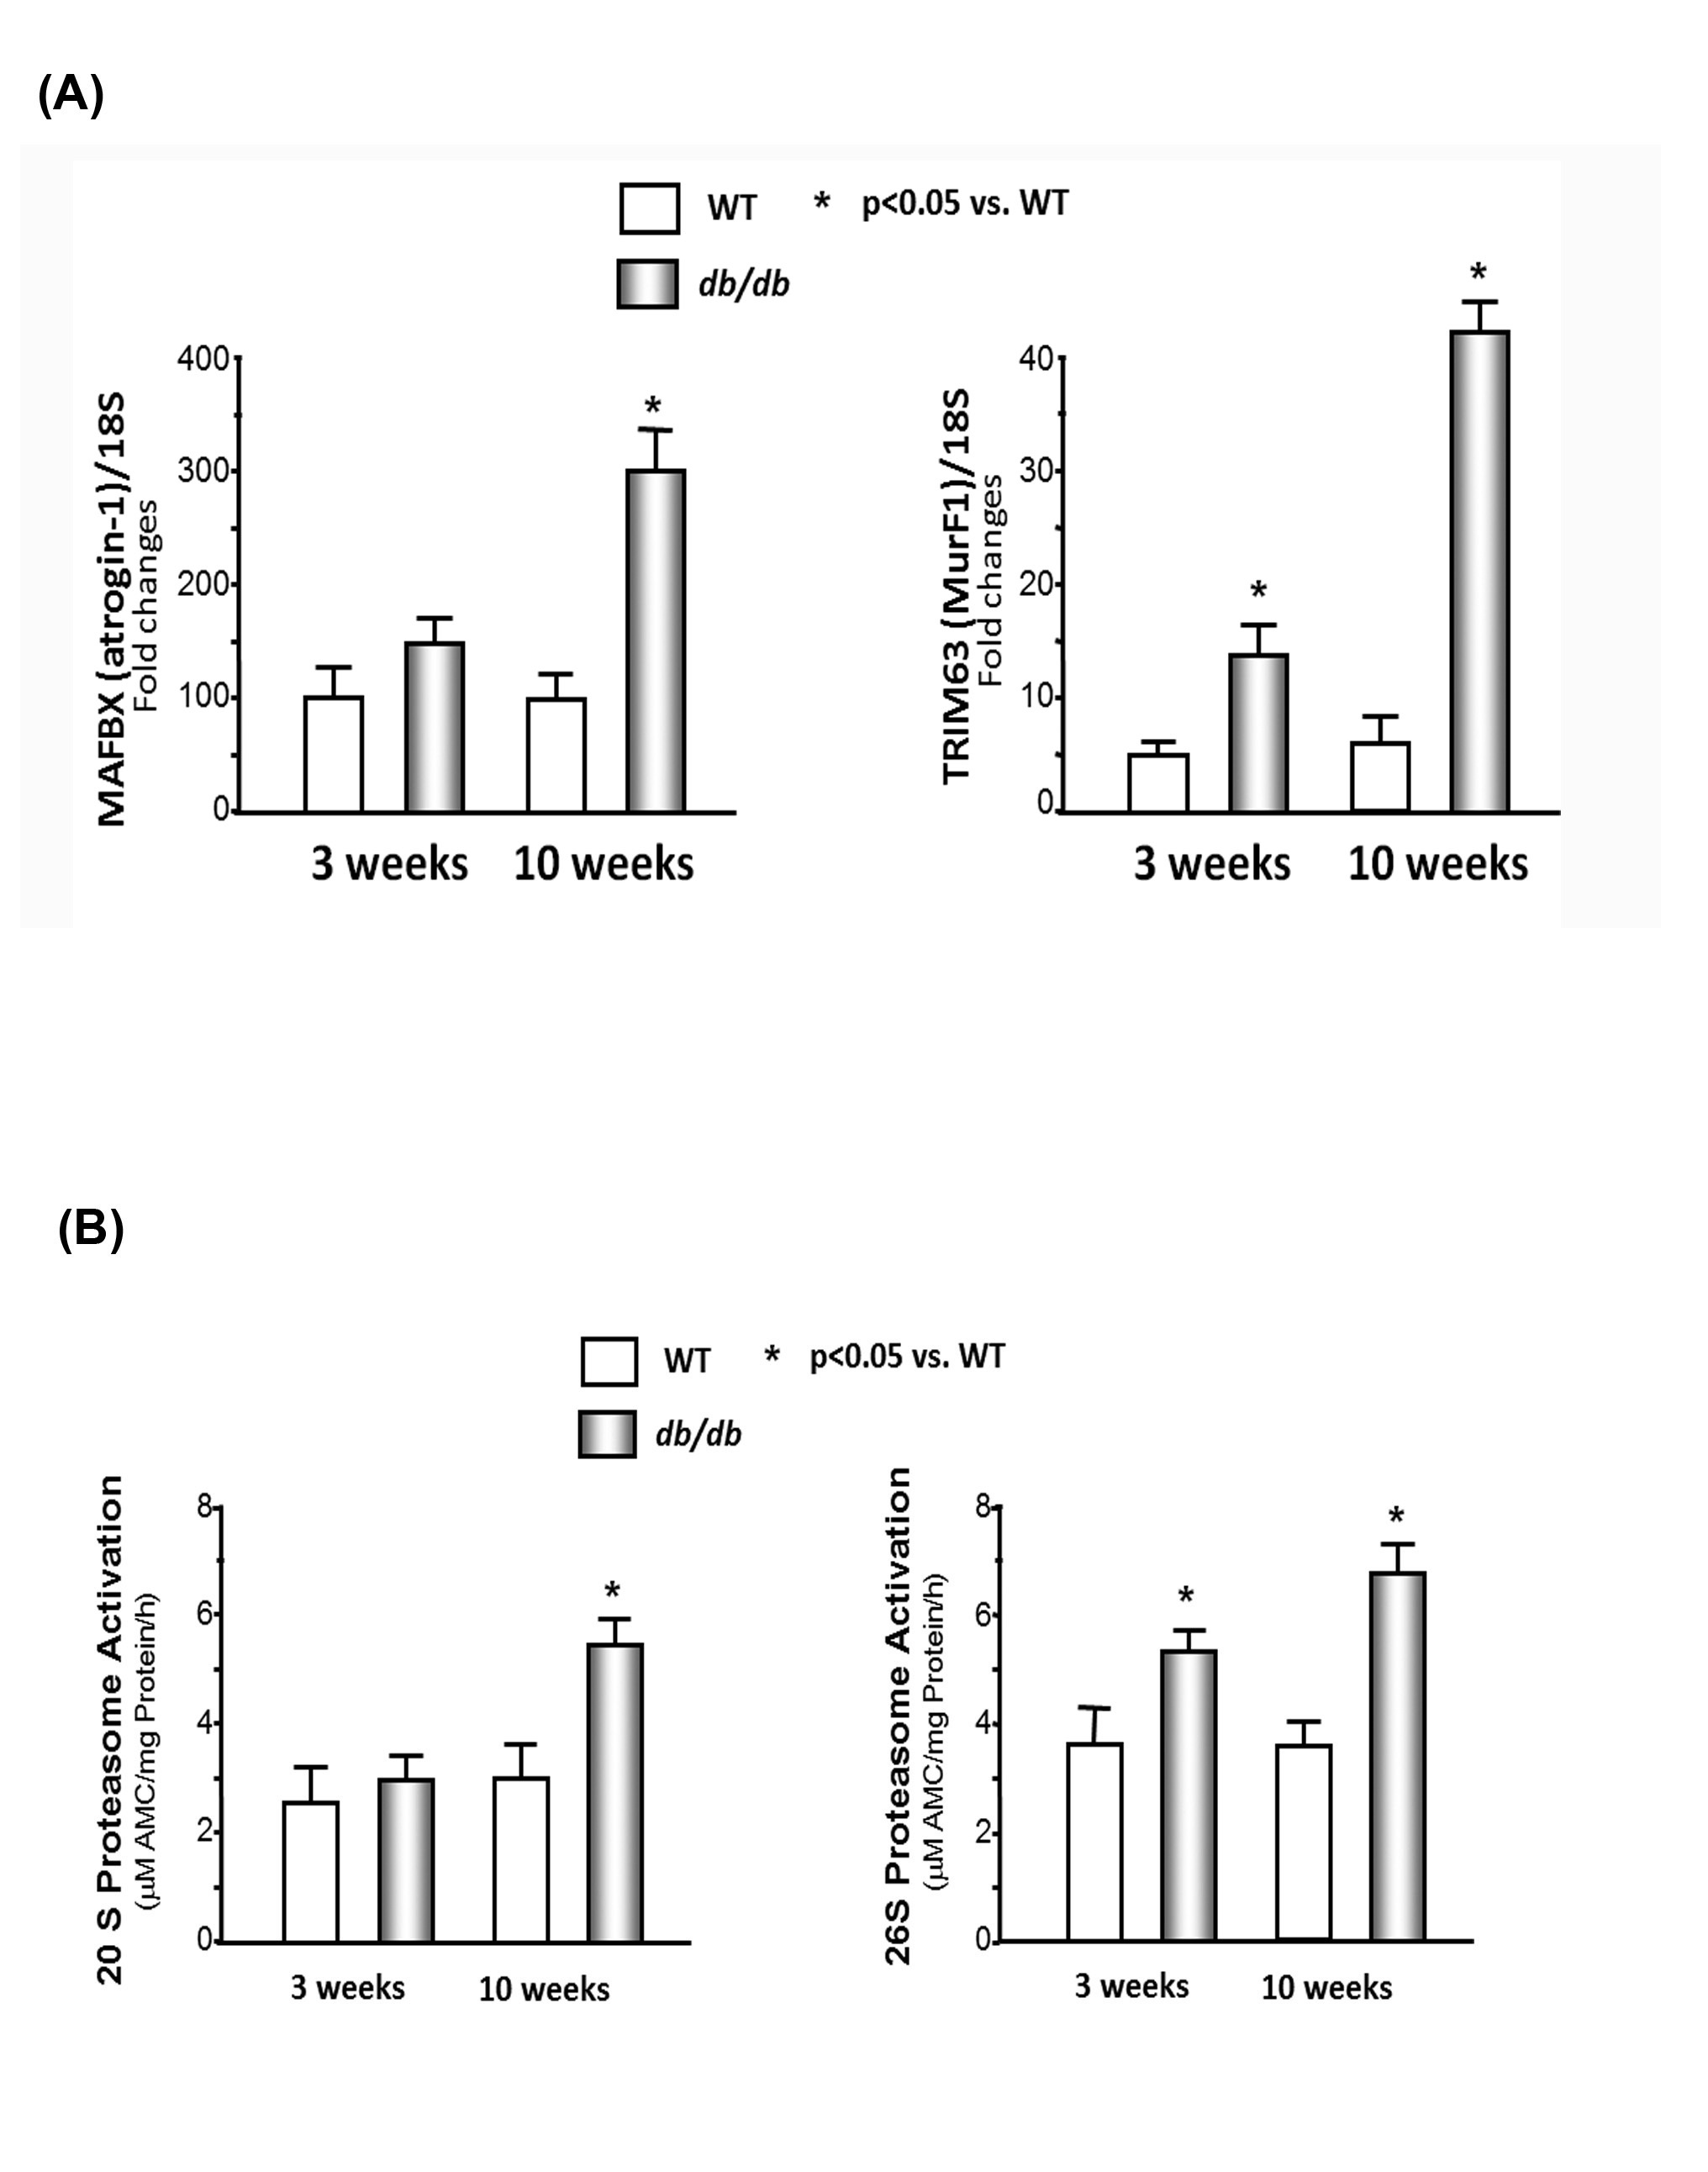
(B) Chymotrypsin-like activity of the proteasome is increased in cardiac muscle of db/db mice. The chymotrypsin-like activity was measured using the fluorogenic substrate LLVY-amc, with or without the proteasome inhibitor epoxomicin (20M) in WT and db/db mice. The difference between activity in the presence and absence of inhibitor was used to calculate proteasome activity. Data are reported as the mean ± SE; n=9/group; *p<0.05 vs WT.
Muscle wasting is associated with low plasma adiponectin levels and high serum-free fatty acid concentrations in db/db mice
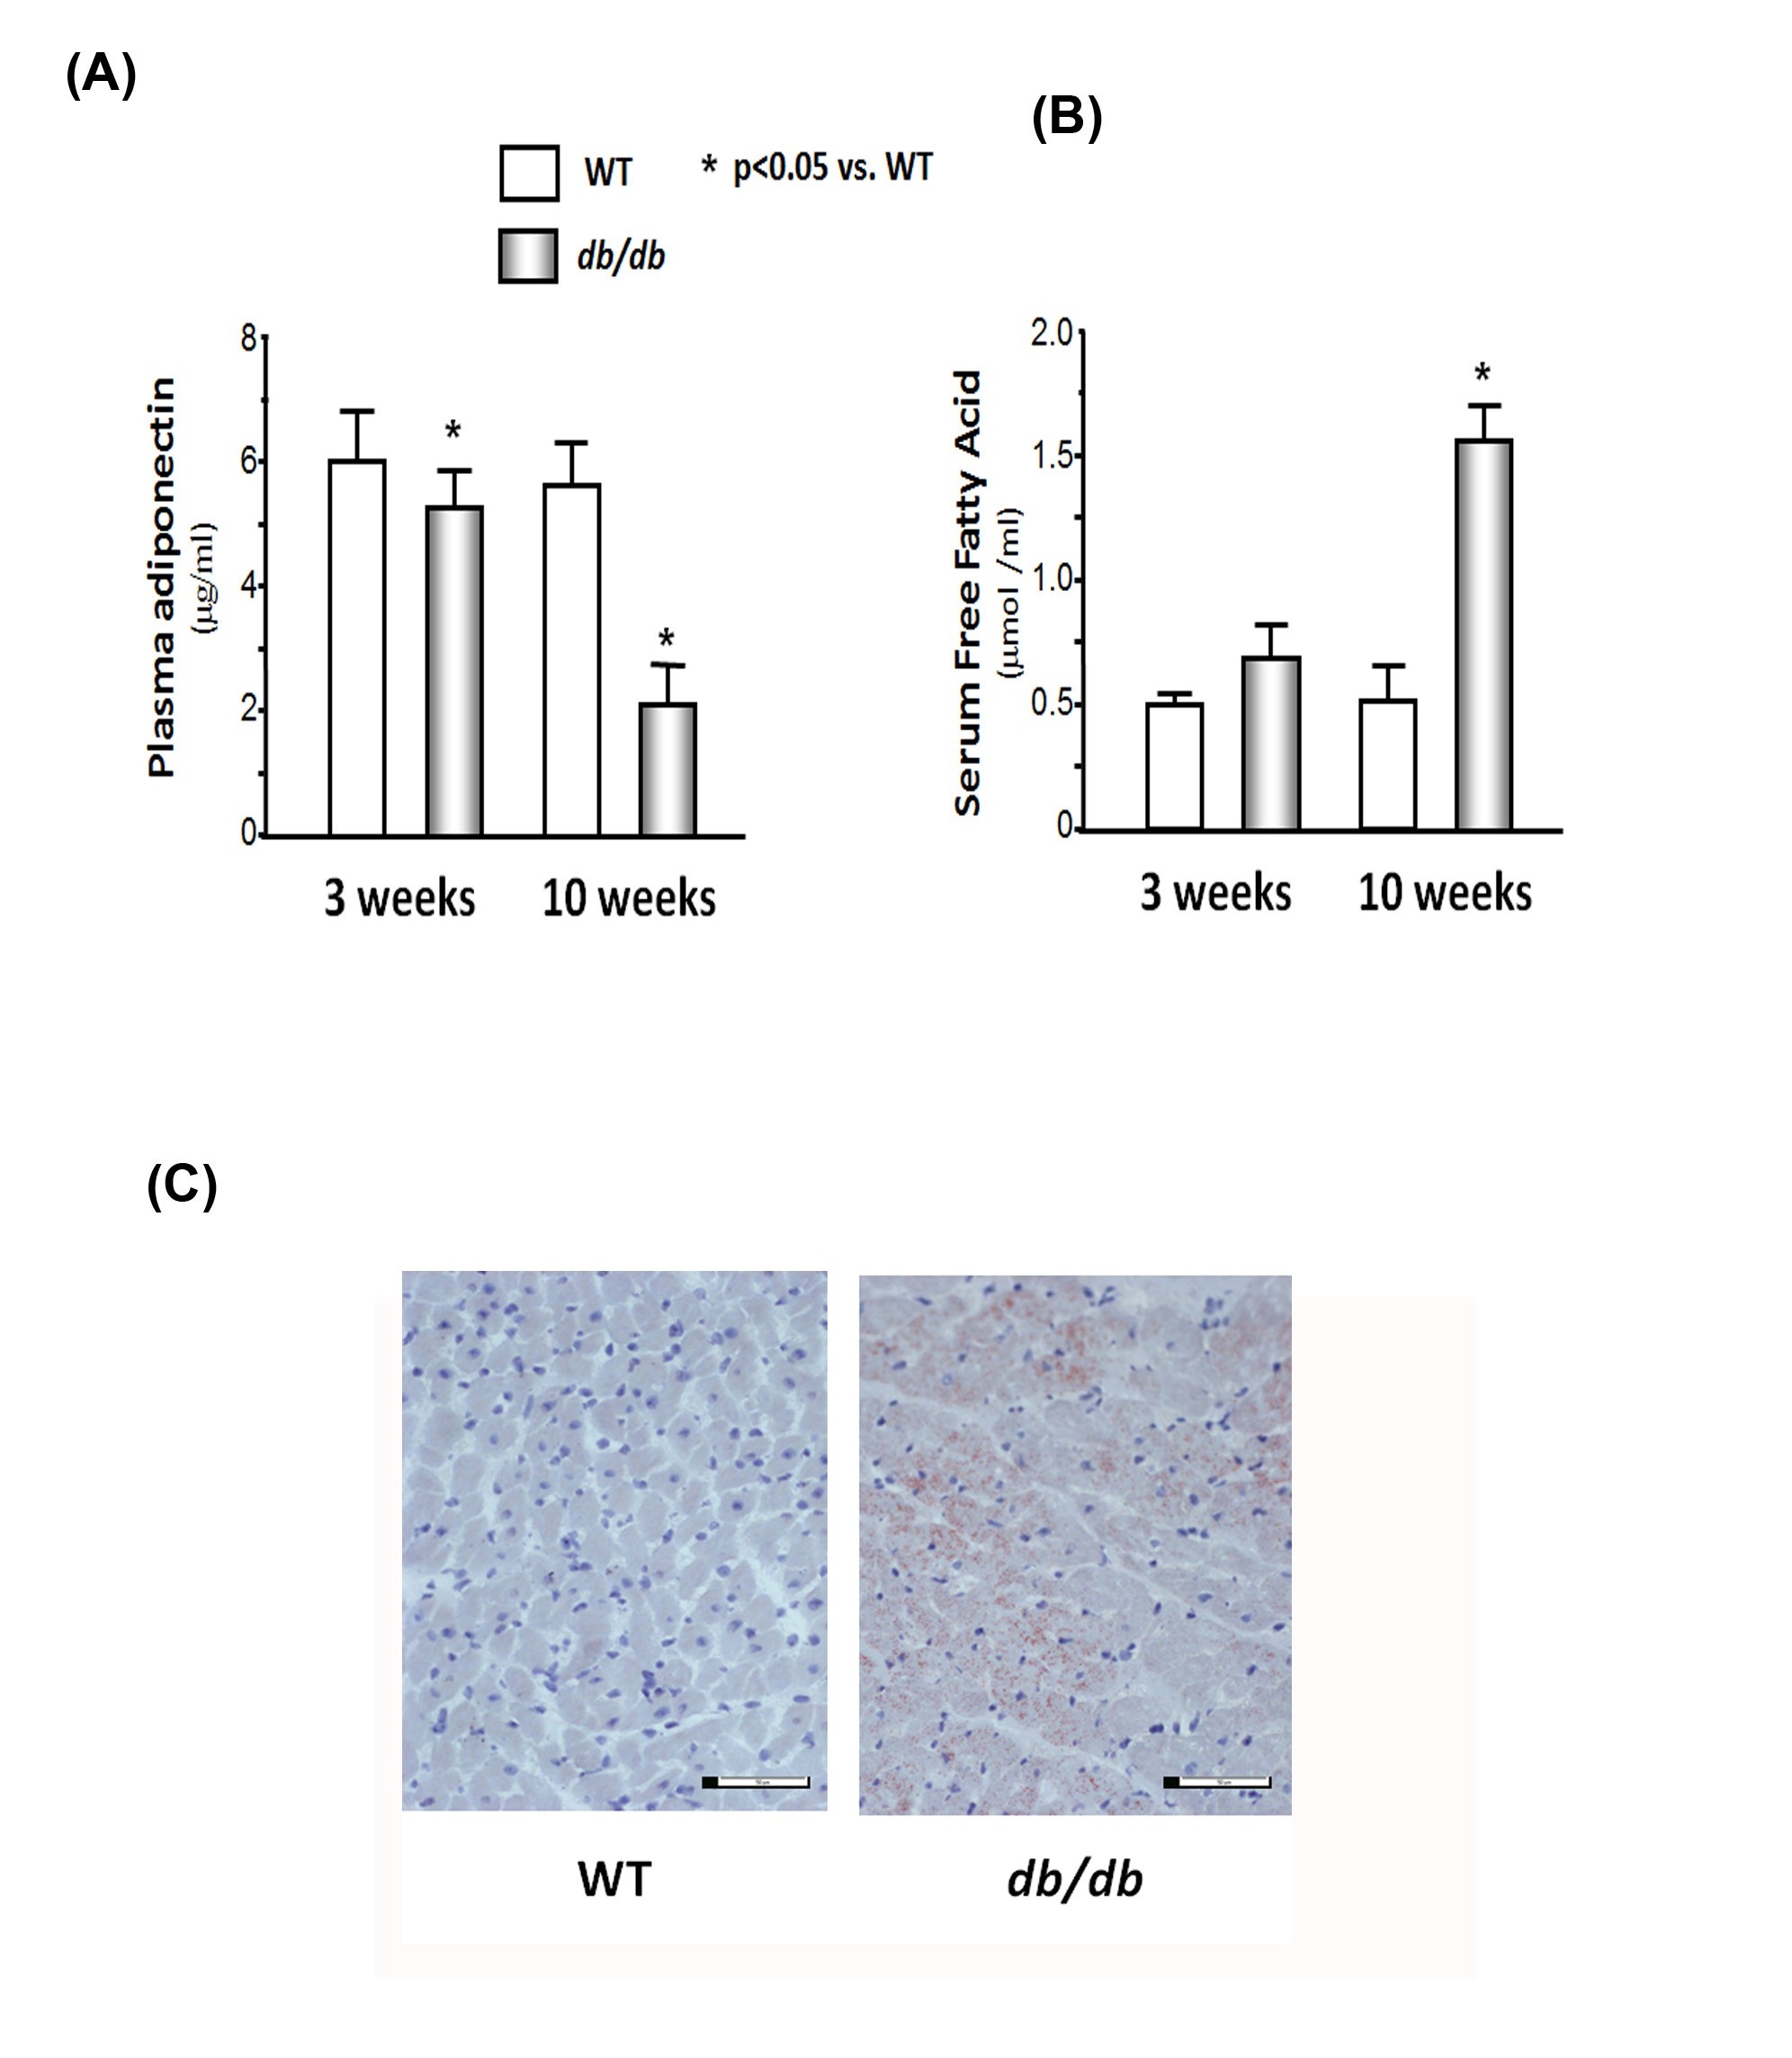
(B) Serum free fatty acid concentrations were measured by the colorimetric determination of Nonesterified Fatty Acids (NEFA) using the NEFA kit (Cv = 0.3%). The bar graph shows the concentration in each group expressed as µmol /ml.
(C) Fat accumulated in heart of 10-week db/db mice. Cardiac muscles were placed in cryo-mold for embedding and freezing isopentane in dry ice. Fat staining was determined by oil red-O in propylene glycol staining. There were numerous red dots in db/db mouse muscle, but not in WT muscle, indicating that lipid accumulation.
Muscle wasting is associated with increased cytokines in the hearts of the db/db mice
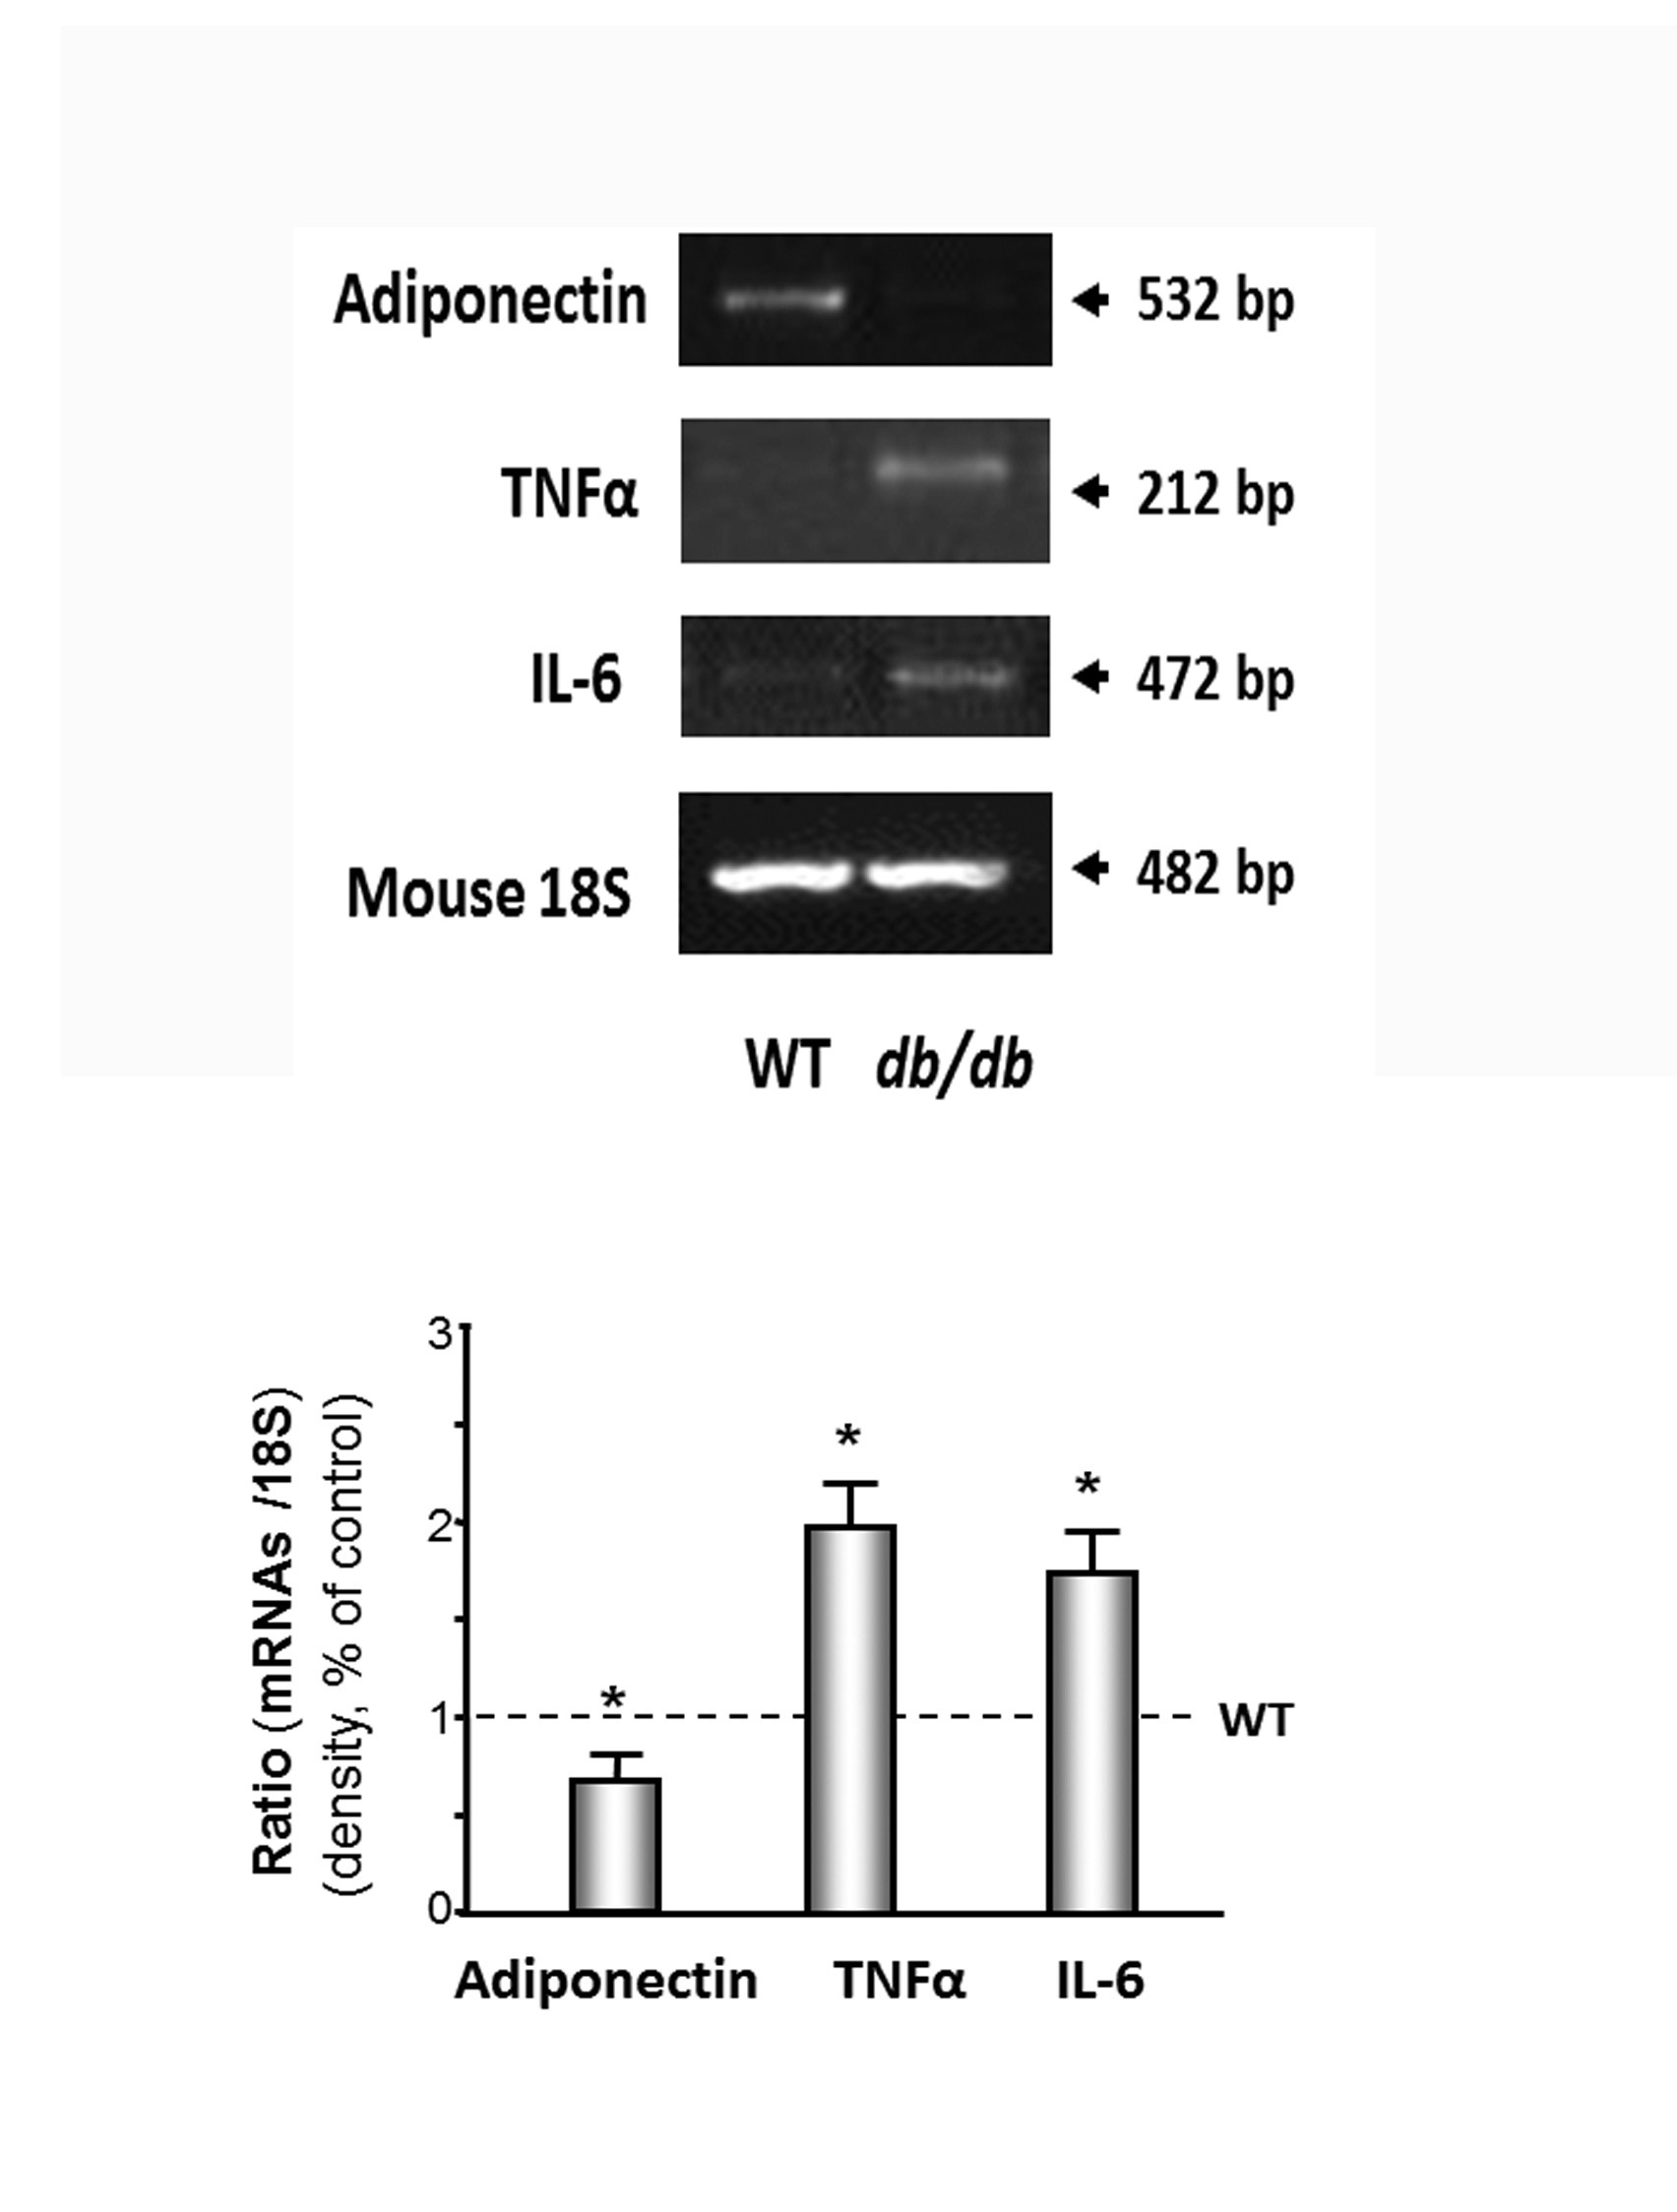 Figure 5: Inflammatory cytokines were increased in cardiac muscle of db/db mice.
DISCUSSION
Studies have consistently found that an increase in insulin resistance causes protein catabolism in patients with type 2 diabetes mellitus [20] and obesity [32]. In our previous investigation, we found that insulin resistance, which is induced by decreased adiponectin and down-regulation of the IRS-1/PI3K/Akt pathway, can cause skeletal muscle wasting [2,3]. Others showed that protein degradation throughout the entire body was 12-24% greater in type 2 diabetes patients than non-diabetic obese subjects in the iso-energetic fed state [20]. Type 2 diabetes patients undergoing chronic hemodialysis have a 2-fold higher rate of protein degradation compared with non- diabetic hemodialysis patients of the same age, gender, and race [33]. Protein catabolism throughout the whole body also occurs in obese subjects without diabetes and is linked to increased insulin resistance [32]. Even diabetic patients that have a stable body weight lose muscle strength and develop greater adiposity [34]. Obese Zucker rats have 27% less calf muscle mass compared with control lean rats [35]. Mice with the MIRKO are normoglycemic but have increased body weight and fat mass and decreased muscle weight [13]. In our study, we found that blood glucose is 3 times higher and plasma insulin is 10 times higher in the 10-month-old db/db mice versus the WT control mice, which indicate insulin resistance (Table 1). Tyrosine phosphorylation of IRS-1 linked to the upregulation of insulin and/or the IGF-1 signaling pathway results in an increase in insulin sensitivity. Serine phosphorylation of IRS-1 decreases insulin responses leading to downregulation of insulin and/or the IGF-1 signaling pathway results in insulin resistance. We showed that tyrosine phosphorylation of IRS-1 was 20% lower and serine phosphorylation of IRS-1 was 1.5-fold higher in the 10-month-old db/dbmice compared with the WT mice, which provides additional evidence for insulin resistance.
| WT | db/db | P (n=9) | ||
| Heart Weight (HW) | mg | 119.1 ± 5.9 | 121.8 ± 4.8 | >0.05 |
| Body Weight (BW) | gram | 24.5 ± 1.9 | 42.6 ± 4.1 | < 0.001 |
| HW/BW | ratio | 4.78 ± 1.5 | 2.96 ± 2.2 | <0.001 |
| Body length | cm | 8.7 ± 0.7 | 8.5 ± 0.5 | >0.05 |
| BMI | BW2 of length | 3.8 ± 0.2 | 6.1 ± 0.8 | <0.001 |
| Blood glucose | mg% | 105.3 ± 5.2 | 326.4 ± 9.2 | <0.001 |
| Plasma insulin | ng/ml | 3.1 ± 1.2 | 34.2 ± 3.2 | <0.001 |
BMI: Body Mass Index
All data are presented as mean ± se
Our previous studies showed that insulin resistance causes skeletal muscle wasting in obese mice [2,3]. There are three major mechanisms that can lead to muscle atrophy including an increase in protein degradation, a decrease in protein synthesis, or a decrease in myogenesis. This study focused on protein degradation and inflammatory-related cytokines. There are three major proteolytic pathways involved in cardiac and skeletal muscles including the autophagosomic-lysosomal pathway, the calcium-dependent proteolytic pathway, and the UPS. We focused on the impact of the UPS on cardiac muscle catabolism in obese mice since the UPS is responsible for most of the breakdown of long-lived proteins and plays a major role in muscle protein degradation. Our current study found that protein degradation was higher in the cardiac muscle of these insulin-resistant obese mice. The following four observations provide evidence of heart catabolism. 1) The ratio of heart and body weight is significant lower in the db/db mice versus the WT mice. 2) Degradation of both soluble proteins and myofibrillar proteins were higher in the db/db mice, and degradation of myofibrillar proteins, but not soluble proteins, was accelerated in the 3-week-old db/db mice (Figure 1B), which indicates myofibrillar protein degradation occurs before soluble protein degradation in the hearts of obese db/db mice. 3) The levels of MAFBX/atrogin-1 and TRIM63/MurF1 are significantly higher in the cardiac muscle of the db/db mice compared with those of the WT mice (Figure 3A). MAFBX/atrogin-1 and TRIM63/MurF1 are E3 ubiquitin ligases, and activation of either ligase will lead to an increase in protein degradation. 4) The chymotrypsin-like activity of the proteasome in the heart muscle is higher in the db/db mice compared to that of the WT mice (Figure 3B).
Muscle protein catabolism is associated with high levels of free fatty acids and inflammatory cytokines, which may be induced by a decrease in adiponectin levels. The concentration of plasma adiponectin has been shown to correlate negatively with glucose, insulin, triglyceride levels, and body mass index [36] and positively with high- density lipoprotein-cholesterol levels and insulin-stimulated glucose disposal in humans [37]. Thiazolidinedione therapy increases endogenous adiponectin production and leads to weight loss in humans [38]. Adiponectin increases insulin sensitivity by increasing tissue fatty acid oxidation, resulting in reduced circulating fatty acid levels and reduced intracellular triglyceride content in the liver and muscle [22]. Moreover, adiponectin enhances the insulin signal transduction cascade by tyrosine phosphorylation of IRS-1 and the insulin receptor in human skeletal muscle [21]. Adiponectin Knockout (adipo-KO) mice show delayed clearance of FFA in plasma, high levels of TNFα mRNA in adipose tissue, and high plasma TNFα concentrations [31]. The adipo-KO mice exhibited severe diet-induced insulin resistance with reduced IRS-1- associated PI3K activity in muscle.
Consistent with a protective effect of adiponectin on insulin resistance, studies have provided insight into the direct anti-inflammatory effects of adiponectin, including the reduction of TNFα secretion from macrophages [23]. Our previous study [2] shows that feeding mice rosiglitazone increases circulating adiponectin levels, decreases TNFα expression, and prevents accelerated protein degradation. We believe that low adiponectin causes an increase of TNFα or possibly other inflammatory cytokines induced by the accumulation of visceral fat, which might be a major proponent of muscle catabolism (Figure 6). In this study, we found lower levels of adiponectin and higher levels of TNFα in the cardiac muscle of the db/dbmice, which may be related to the increase in protein degradation in the cardiac muscle of the db/dbobese mice.
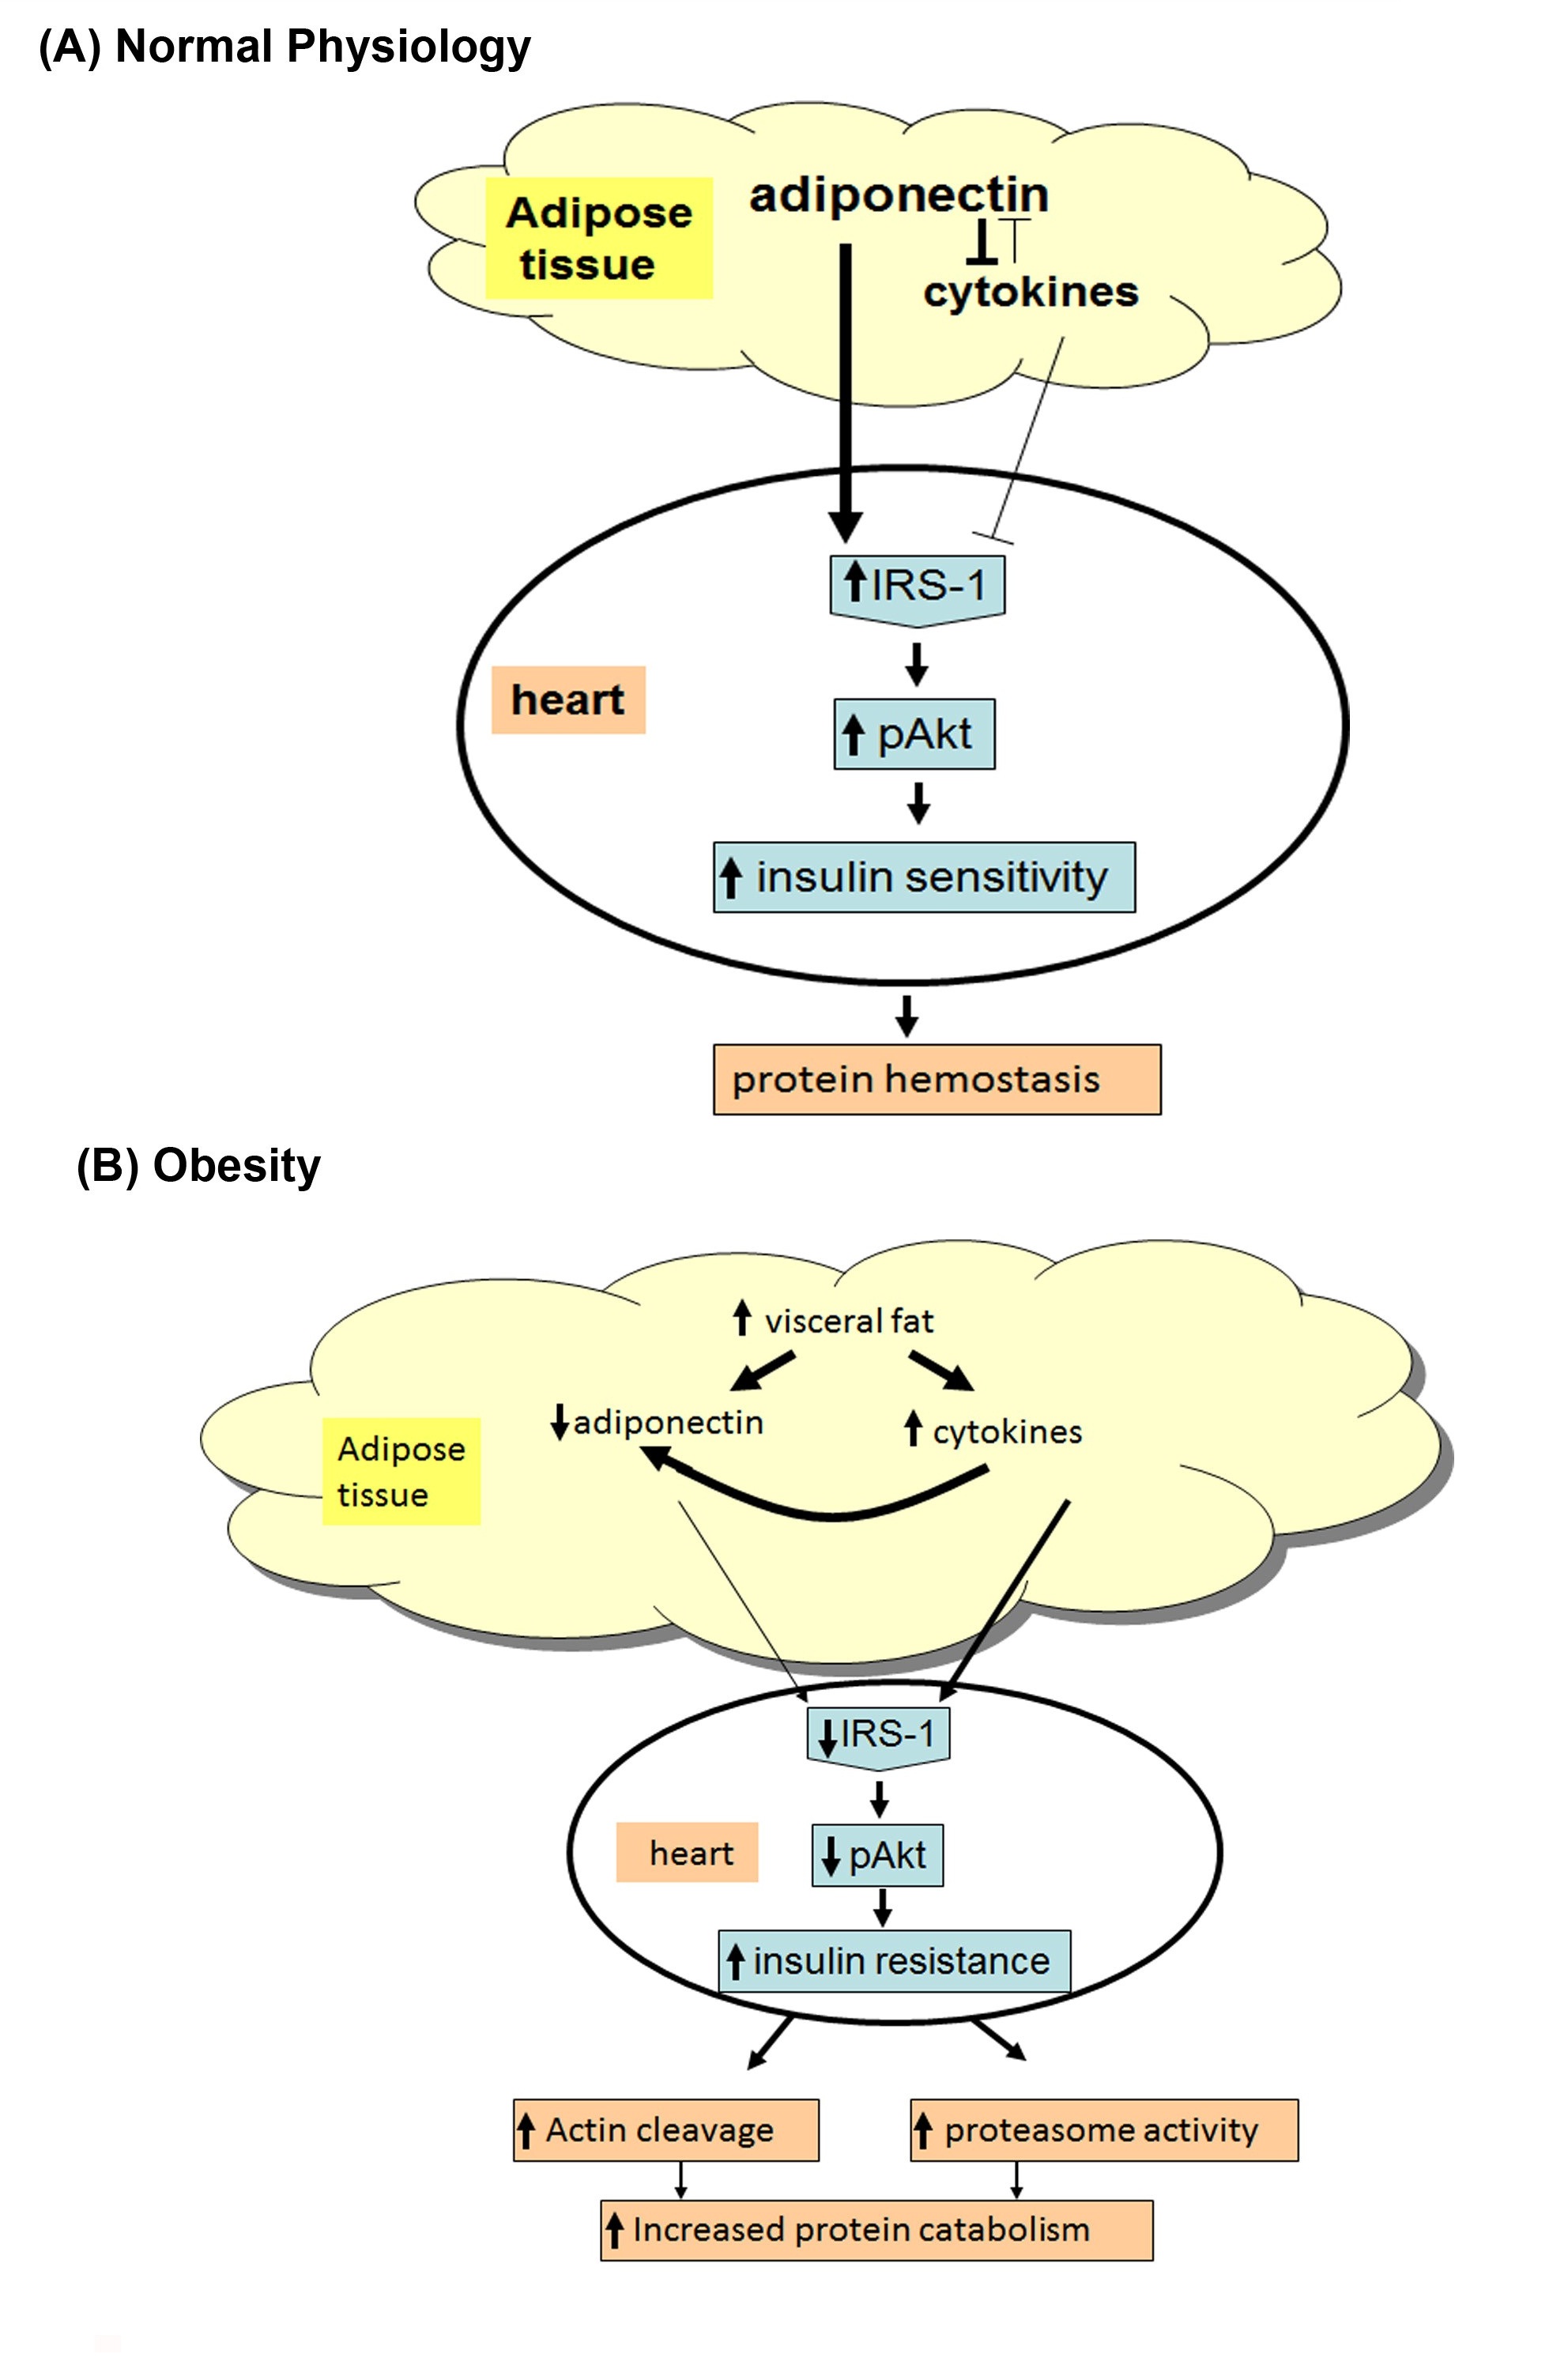 Figure 6: (A) In normal physiologic condition, adiponectin functions as a mediator for insulin sensitivity.
Adiponectin is a protein secreted by adipocytes, it can inhibit anti- inflammatory cytokines, oxidation of fatty acid, and up-regulation of IRS-1/PI3K/Akt (Insulin Receptor Substrate-1/Phosphatidylinositol 3-Kinase) signaling.
(B) In obese insulin resistant subjects (e.g., db/db mice), adiponectin is reduced in the blood and leading to protein catabolism. Reduced adiponectin increases cytokines and inhibits pAkt. These changes trigger increased cardiac muscle protein catabolism in the heart of insulin resistant obese mice.
Our study indicates that there is significant cardiac muscle protein catabolism in type 2 diabetic db/dbmice, and insulin resistance, decreased adiponectin, and increased inflammatory cytokines are the potential causes of protein catabolism (Figure 6). This study provides evidence that blocking insulin resistance could be a potential therapeutic strategy for treating cardiac muscle wasting in patients with type 2 diabetes and obesity.
REFERENCES
- Griffiths RD (1996) Muscle mass, survival, and the elderly ICU patient. Nutrition 12: 456-458.
- Wang X, Hu Z, Hu J, Du J, Mitch WE (2006) Insulin resistance accelerates muscle protein degradation: Activation of the ubiquitin-proteasome pathway by defects in muscle cell signaling. Endocrinology 147: 4160-4168.
- Zhou Q, Du J, Hu Z, Walsh K, Wang XH (2007) Evidence for adipose-muscle cross talk: opposing regulation of muscle proteolysis by adiponectin and fatty acids. Endocrinology 148: 5696-5705.
- Hu J, Klein JD, Du J, Wang XH (2008) Cardiac muscle protein catabolism in diabetes mellitus: activation of the ubiquitin-proteasome system by insulin deficiency. Endocrinology 149: 5384-5390.
- Mitch WE, Bailey JL, Wang X, Jurkovitz C, Newby D, et al. (1999) Evaluation of signals activating ubiquitin-proteasome proteolysis in a model of muscle wasting. Am J Physiol 276: 1132-1138.
- Wang XH, Mitch WE (2014) Mechanisms of muscle wasting in chronic kidney disease. Nat Rev Nephrol 10: 504-516.
- Price SR, Bailey JL, Wang X, Jurkovitz C, England BK, et al. (1996) Muscle wasting in insulinopenic rats results from activation of the ATP-dependent, ubiquitin-proteasome proteolytic pathway by a mechanism including gene transcription. J Clin Invest 98: 1703-1708.
- Wang X, Hu J, Price SR (2007) Inhibition of PI3-kinase signaling by glucocorticoids results in increased branched-chain amino acid degradation in renal epithelial cells. Am J Physiol Cell Physiol 292: 1874-1879.
- Fryburg DA, Jahn LA, Hill SA, Oliveras DM, Barrett EJ (1995) Insulin and insulin-like growth factor-I enhance human skeletal muscle protein anabolism during hyperaminoacidemia by different mechanisms. J Clin Invest 96: 1722-1729.
- Lee SW, Dai G, Hu Z, Wang X, Du J, et al. (2004) Regulation of muscle protein degradation: coordinated control of apoptotic and ubiquitin-proteasome systems by phosphatidylinositol 3 kinase. J Am Soc Nephrol 15: 1537-1545.
- Nair KS, Ford GC, Ekberg K, Fernqvist-Forbes E, Wahren J (1995) Protein dynamics in whole body and in splanchnic and leg tissues in type I diabetic patients. J Clin Invest 95: 2926-2937.
- Ouchi N, Kihara S, Arita Y, Okamoto Y, Maeda K, et al. (2000) Adiponectin, an adipocyte-derived plasma protein, inhibits endothelial NF-kappaB signaling through a cAMP-dependent pathway. Circulation 102: 1296-1301.
- Kim JK, Michael MD, Previs SF, Peroni OD, Mauvais-Jarvis F, et al. (2000) Redistribution of substrates to adipose tissue promotes obesity in mice with selective insulin resistance in muscle. J Clin Invest 105: 1791-1797.
- Tessari P, Biolo G, Inchiostro S, Saccà L, Nosadini R, et al. (1990) Effects of insulin on whole body and forearm leucine and KIC metabolism in type 1 diabetes. Am J Physiol 259: 96-103.
- Cosper PF, Leinwand LA (2011) Cancer causes cardiac atrophy and autophagy in a sexually dimorphic manner. Cancer Res 71: 1710-1720.
- Mitch WE, Goldberg AL (1996) Mechanisms of muscle wasting. The role of the ubiquitin-proteasome pathway. N Engl J Med 335: 1897-1905.
- Du J, Wang X, Miereles C, Bailey JL, Debigare R, et al. (2004) Activation of caspase-3 is an initial step triggering accelerated muscle proteolysis in catabolic conditions. J Clin Invest 113: 115-123.
- Hu J, Du J, Zhang L, Price SR, Klein JD, et al. (2010) XIAP reduces muscle proteolysis induced by CKD. J Am Soc Nephrol 21: 1174-1183.
- Wang XH, Zhang L, Mitch WE, LeDoux JM, Hu J, et al. (2010) Caspase-3 cleaves specific 19 S proteasome subunits in skeletal muscle stimulating proteasome activity. J Biol Chem 285: 21249-21257.
- Gougeon R, Styhler K, Morais JA, Jones PJ, Marliss EB (2000) Effects of oral hypoglycemic agents and diet on protein metabolism in type 2 diabetes. Diabetes Care 23: 1-8.
- Stefan N, Vozarova B, Funahashi T, Matsuzawa Y, Ravussin E, et al. (2002) Plasma adiponectin levels are not associated with fat oxidation in humans. Obes Res 10: 1016-1020.
- Kershaw EE, Flier JS (2004) Adipose tissue as an endocrine organ. J Clin Endocrinol Metab 89: 2548-2556.
- Fasshauer M, Klein J, Neumann S, Eszlinger M, Paschke R (2002) Hormonal regulation of adiponectin gene expression in 3T3-L1 adipocytes. Biochem Biophys Res Commun 290: 1084-1089.
- Baracos VE, Goldberg A (1986) Maintenance of normal length improves protein balance and energy status in isolated rat skeletal muscles. Am J Physiol 251: 588-596.
- Clark AS, Mitch WE (1983) Comparison of protein synthesis and degradation in incubated and perfused muscle. Biochem J 212: 649-653.
- Fagan JM, Waxman L, Goldberg AL (1987) Skeletal muscle and liver contain a soluble ATP + ubiquitin-dependent proteolytic system. Biochem J 243: 335-343.
- Solomon V, Goldberg AL (1996) Importance of the ATP-ubiquitin-proteasome pathway in the degradation of soluble and myofibrillar proteins in rabbit muscle extracts. J Biol Chem 271: 26690-26697.
- Unger RH (2003) The physiology of cellular liporegulation. Annu Rev Physiol 65: 333-347.
- Haddad F, Zaldivar F, Cooper DM, Adams GR (2005) IL-6-induced skeletal muscle atrophy. J Appl Physiol (1985) 98: 911-917.
- Li YP, Chen Y, John J, Moylan J, Jin B, et al. (2005) TNF-alpha acts via p38 MAPK to stimulate expression of the ubiquitin ligase atrogin1/MAFbx in skeletal muscle. FASEB J 19: 362-370.
- Maeda N, Shimomura I, Kishida K, Nishizawa H, Matsuda M, et al. (2002) Diet-induced insulin resistance in mice lacking adiponectin/ACRP30. Nat Med 8: 731-737.
- Chevalier S, Burgess SC, Malloy CR, Gougeon R, Marliss EB, et al. (2006) The greater contribution of gluconeogenesis to glucose production in obesity is related to increased whole-body protein catabolism. Diabetes 55: 675-681.
- Pupim LB, Flakoll PJ, Majchrzak KM, Aftab Guy DL, Stenvinkel P, et al. (2005) Increased muscle protein breakdown in chronic hemodialysis patients with type 2 diabetes mellitus. Kidney Int 68: 1857-1865.
- Brodsky IG, Robbins DC, Hiser E, Fuller SP, Fillyaw M, et al. (1992) Effects of low-protein diets on protein metabolism in insulin-dependent diabetes mellitus patients with early nephropathy. J Clin Endocrinol Metab 75: 351-357.
- Wallis MG, Wheatley CM, Rattigan S, Barrett EJ, Clark AD, et al. (2002) Insulin-mediated hemodynamic changes are impaired in muscle of Zucker obese rats. Diabetes 51: 3492-3498.
- Matsubara M, Maruoka S, Katayose S (2002) Decreased plasma adiponectin concentrations in women with dyslipidemia. J Clin Endocrinol Metab 87: 2764-2769.
- Matsubara M, Maruoka S, Katayose S (2002) Inverse relationship between plasma adiponectin and leptin concentrations in normal-weight and obese women. Eur J Endocrinol 147: 173-180.
- Yang WS, Jeng CY, Wu TJ, Tanaka S, Funahashi T, et al. (2002) Synthetic peroxisome proliferator-activated receptor-gamma agonist, rosiglitazone, increases plasma levels of adiponectin in type 2 diabetic patients. Diabetes Care 25: 376-380.
Citation: Li M, Hassounah F, Wang XH (2015) Cardiac Muscle Protein Catabolism in db/db Obese Mice, a Type II Diabetes Mellitus Model. J Diabetes Metab Syndr Disord 2: 004.
Copyright: © 2015 Min Li, et al. This is an open-access article distributed under the terms of the Creative Commons Attribution License, which permits unrestricted use, distribution, and reproduction in any medium, provided the original author and source are credited.