Journal of Obesity & Weight Loss Category: Medical
Type: Research Article
Visceral Adiposity: A Major Predictor in Diabetes and Hypertension
*Corresponding Author(s):
Saera Suhail KidwaiDepartment Of Medicine, United Medical And Dental College, Karachi, Pakistan
Tel:03353159633; 03003543519,
Email:saerakhan@hotmail.com
Received Date: Feb 27, 2017
Accepted Date: Apr 07, 2017
Published Date: Apr 22, 2017
Abstract
Aim: To determine and compare the relationship between visceral fat and anthropometric measurements in diabetic and non diabetic, hypertensive and non hypertensive Pakistani adults.
Study design: Cross sectional analytic study
Place and duration of study: Study setting is a tertiary care hospital located in the suburbs of Karachi Pakistan catering a population of low income strata, the study was conducted for a duration of 6 months from Oct 2015 till March 2016.
Materials and Methods: A total of 229 adults aged 41.58±12.47 years were recruited with informed consent from the suburbs of Karachi. Male (n=81): female (n=148) ratio is 1:2. Blood Pressure (BP) and WC are measured using standard equipments. Body Mass Index (BMI) is categorized as normal: 18.5-22.9 overweight: 23-24.9 and obese ≥25. Waist Circumference (WC) is considered high if ≥80 cms in females and ≥90 cms in males which is in accordance with South Asian Modified National Cholesterol Education Program Adult Treatment Panel III criteria (SAM-NCEP) criteria. Total Body Fat (TBF), Total Visceral Fat percentage (TVF) and BMI were measured by OMRON BF508. SPSS version 16 is used for all calculations P value was taken as significant with a P<0.05
Result: Means and standard deviations for all variables including age, body mass index, waist circumference, Systolic and diastolic blood pressure, total body fat and total visceral fat were calculated. BMI, WC, Systolic BP and TVF proved significance with P<0.05. Linear regression analysis was used with total visceral fat percentage as dependent variable and BMI, age, systolic and diastolic blood pressure, waist circumference and total body fat as independent variables. All the variables except total body fat proved significance with Systolic BP and WC being the highest determinant (P<0.05). Mean of TVF in males is found 9.53% and in females 9.26%, mean of TVF in Diabetic cohort is 10.9% whereas in non diabetics 8.7%. Similarly, in hypertensive TVF is 10.7% and in non hypertensive 8.6 %. TBF has not shown any significance in hypertensive, diabetic and even in obese individuals (P value>.05).
Conclusion: Significant correlation is found between TVF and systolic BP and WC in this study. Higher values of TVF is observed diabetic and hypertensive individuals. Contrary to the general concept males have shown an equally higher percentage of visceral fat than females in our cohort. Therefore, central obesity should be aggressively managed in order to lower the risk of diabetes and hypertension in both genders.
Keywords
Diabetes; Hypertension
INTRODUCTION
Obesity is a very complex and heterogeneous condition which over the years have spread like an exploding epidemic, it has resulted in a variety of metabolic disorders thus leading to morbidity and mortality of mass population. The variation in distribution of regional fat is one of the major determinants of metabolic heterogeneity in obese individuals and their respective cardiovascular risk [1]. “Asian Indian phenotype” is a unique term that refers to a high risk ethnic group of Indian origin in a way that despite relatively lower prevalence rates of generalized obesity, they tend to have a greater degree of central body obesity. In addition, they have relatively increased visceral fat, higher plasma insulin levels representing insulin resistance and a lower adiponectin levels [2]. An excess of intra-abdominal or visceral adipose tissue has been reported to be detrimental and associated with a constellation of metabolic abnormalities including insulin resistance, hyperinsulinemia, glucose intolerance and thus type 2 diabetes mellitus. Similarly an atherogenic high triglyceride apolipoprotein B-small, dense low-density lipoprotein-low high-density lipoprotein-cholesterol dyslipidemia, inflammation, altered cytokine profile, impaired fibrinolysis, and increased risk of thrombosis, and endothelial dysfunction increases the cardiovascular risk several folds [3]. The geographical location and phenotype of our population belongs to the same high risk “Asian Indian phenotype” thus making us the susceptible population for all the above metabolic risks.
In this study we aim to determine the relationship of anthropometric measures WC and BMI with visceral fat in both males and females and also compare them in diabetic and non diabetic, hypertensive and non hypertensive cohorts. To our knowledge in recent years no published data is available from this geographical location as regard the comparison of demographic measurements with visceral fat percentage with which we can compare similar international statistic. The genotypical and phenotypical variation is too significant in the Asians when compared with Europeans or Americans which justifies the importance of this study not only to compare and document the statistics but also to emphasize the importance of life style modifications which are necessary to avoid the much anticipated cardiovascular morbitity and mortality in high risk individuals.
In this study we aim to determine the relationship of anthropometric measures WC and BMI with visceral fat in both males and females and also compare them in diabetic and non diabetic, hypertensive and non hypertensive cohorts. To our knowledge in recent years no published data is available from this geographical location as regard the comparison of demographic measurements with visceral fat percentage with which we can compare similar international statistic. The genotypical and phenotypical variation is too significant in the Asians when compared with Europeans or Americans which justifies the importance of this study not only to compare and document the statistics but also to emphasize the importance of life style modifications which are necessary to avoid the much anticipated cardiovascular morbitity and mortality in high risk individuals.
METHOD
This cross-sectional comparative study is done on 229 adults with age ranging from 25 to 70 years. Subjects were recruited randomly after taking informed consent, from the outpatient medical department of a tertiary care center catering a population of low-middle class population located in the suburbs of Karachi. Study was conducted from Oct 2015 till Mar 2016 for duration of 6 months. All the subjects who had any chronic illness other than diabetes or hypertension or were pregnant were excluded from the study. A detailed history with systemic examination is taken and relevant investigations are done. Demographic details are noted.
Blood Pressure (BP) and Waist Circumference (WC) are measured using standard equipments. Total Body Fat (TBF), Total Visceral Fat Percentage (TVF) and Body Mass Index (BMI) were measured by OMRON BF508. Body Mass Index (BMI) is categorized as normal 18.5-22.9 overweight 23-24.9 and obese ≥25. Waist circumference (WC) is considered high if ≥80cms in females and ≥90 cms in males which is in accordance with South Asian Modified National Cholesterol Education Program Adult Treatment Panel III criteria (SAM-NCEP) criteria [4].
Subjects were considered hypertensive if their blood pressure ≥140 systolic or ≥90 diastolic in non diabetics and ≥135 systolic and ≥85 diastolic in diabetics. Subjects were considered diabetic if they were already on medication or their fasting blood sugar was ≥126 mg/dl or random blood sugar ≥ 200 mg/dl or Hb A1c ≥ 6% [5]. All the variables that is age, gender, duration of disease, BMI, WC, total body fat, visceral fat, systolic and diastolic blood pressure were quantified and means with standard deviation calculated. Effects of total visceral fat on these variables were measured using linear regression module. The statistical data is analyzed using SPSS version 16 with a P value of <0.05 taken as significant.
RESULT
250 subjects participated in this study however complete collected data to be analyzed was for 229 individuals only. Mean age of the cohort regardless of gender is 41.59±12.47 years and male (n= 81): female (n=148) ratio is 1:2. Means and standard deviations for all variables (age, BMI, WC, Systolic and diastolic BP, TBF and TVF) are mentioned in table 1.
Table 1: Means of all variables with respect to gender.
SPSS version 16 is used for all calculations with a P value (P<0.05) taken as significant. Frequency of diabetes in the cohort is 27.5% (n=63) and hypertension is 34.5% (n=79). The data on means of all variables showed a significance of P< 0.05 in age, BMI, WC, systolic BP and TVF amongst males and females. Linear regression analysis is used with total visceral fat percentage as dependent variable and BMI, age, systolic and diastolic blood pressure, waist circumference and total body fat as independent variables which showed high significance (P<0.05) for all variables except for total body fat (Table 2).
| Male | Female | Total | |
| Age | 43.77±12.87 | 40.39±12.12 | 41.59±12.47 |
| BMI | 25.96±5.02 | 26.95±5.53 | 26.6±5.37 |
| SysBP | 119.73±16.52 | 115.21±15.1 | 116.77±15.71 |
| DiasBP | 78.05±16.86 | 75±10.9 | 76.07±13.34 |
| WC | 92.1±13.73 | 96.8±14.97 | 95.14±14.69 |
| TBF | 35.33±12.99 | 37.25±11.36 | 36.57±11.97 |
| TVF | 9.53±4.84 | 9.26±4.44 | 9.35±4.58 |
SPSS version 16 is used for all calculations with a P value (P<0.05) taken as significant. Frequency of diabetes in the cohort is 27.5% (n=63) and hypertension is 34.5% (n=79). The data on means of all variables showed a significance of P< 0.05 in age, BMI, WC, systolic BP and TVF amongst males and females. Linear regression analysis is used with total visceral fat percentage as dependent variable and BMI, age, systolic and diastolic blood pressure, waist circumference and total body fat as independent variables which showed high significance (P<0.05) for all variables except for total body fat (Table 2).
| R | R2 | β | P value | |
| Age | 0.294(a) | 0.086248 | 0.108058 | <0.05 |
| BMI | 0.791(a) | 0.625117 | 0.67425 | <0.05 |
| DiasBP | 0.248(a) | 0.061421 | 0.084732 | <0.05 |
| SysBP | 0.385(a) | 0.147916 | 0.112107 | <0.05 |
| TBF | 0.117(a) | 0.013716 | 0.044779 | >0.05 |
| WC | 0.778(a) | 0.605395 | 0.242505 | <0.05 |
We have compared all the variable behaviors in groups of diabetic and non diabetic and hypertensive and non hypertensive population tables 3 and 4. The diabetic and hypertensive subjects proved to be significantly associated with a higher age, BMI, systolic BP, WC and TVF (P<0.00), which suggest that either the higher values of age, BMI, WC and TVF are responsible for DM and HTN or vice versa, further prospective Randomized Controlled Trials are required to prove the cause and effect relationship between these variables.
| DM | no DM | Total | Sig. | |
| Age | 47.73±9.05 | 39.24±12.81 | 41.59±12.47 | <0.05 |
| BMI | 27.89±5.34 | 26.11±5.31 | 26.6±5.37 | <0.05 |
| Sys BP | 122.98±14.26 | 114.56±15.66 | 116.77±15.71 | <0.05 |
| Dias BP | 77.97±17.6 | 75.38±11.38 | 76.07±13.34 | >0.05 |
| WC | 101.33±13.08 | 92.79±14.61 | 95.14±14.69 | <0.05 |
| TBF | 38±10.16 | 36.03±12.58 | 36.57±11.97 | >0.05 |
| TVF | 10.95±4.57 | 8.75±4.45 | 9.35±4.58 | <0.05 |
| HTN | no HTN | Total | Sig. | |
| Age | 46.41±11.64 | 39.03±12.16 | 41.59±12.47 | <0.05 |
| BMI | 28.38±5.13 | 25.66±5.26 | 26.6±5.37 | <0.05 |
| SysBP | 124.79±14.03 | 112.88±15.04 | 116.77±15.71 | <0.05 |
| DiasBP | 79.86±17.2 | 74.18±10.49 | 76.07±13.34 | <0.05 |
| WC | 100.18±13.23 | 92.49±14.76 | 95.14±14.69 | <0.05 |
| TBF | 36.2±11.4 | 36.76±12.29 | 36.57±11.97 | >0.05 |
| TVF | 10.71±4.39 | 8.64±4.52 | 9.35±4.58 | <0.05 |
Means of age, BMI, WC, systolic and diastolic BP and TBF is compared in the normal and high visceral fat category in table 5 which has proved significance in all the variables except TBF (P<0.05).
| <9 | 9 and above | Total | Sig. | |
| Age | 38.63±12.5 | 45.8±11.19 | 41.59±12.47 | <0.05 |
| BMI | 23.59±3.82 | 30.85±4.25 | 26.6±5.37 | <0.05 |
| SysBP | 112.34±15.14 | 123.15±14.35 | 116.77±15.71 | <0.05 |
| DiasBP | 73.8±12.51 | 79.33±13.89 | 76.07±13.34 | <0.05 |
| WC | 87.35±11.33 | 106.13±11.53 | 95.14±14.69 | <0.05 |
| TBF | 36.4±11.16 | 36.81±13.09 | 36.57±11.97 | >0.05 |
When comparing the means of BMI, WC and TVF in a younger age group (20-29yrs ) it has shown a significantly lower mean values (<0.05) than 40yrs and above which proves the higher the age the more the BMI, WC, TVF and systolic BP (Table 6).
| 20 to 29yrs | 30 to 39yrs | 40 to 49 yrs | 50 and above | Sig. | |
| BMI | 24.3+5.39 | 27.806+5.452 | 27.843+4.949 | 26.159+5.224 | <0.05 |
| SysBP | 111.429+16.465 | 113.488+13.607 | 119.032+15.333 | 120+15.88 | <0.05 |
| DiasBP | 73.095+10.704 | 75.116+10.088 | 76.191+14.639 | 78.31+15.022 | 0.230 |
| WC | 85.477+15.322 | 94.766+14.142 | 99.687+15.079 | 97.227+11.644 | <0.05 |
| TBF | 37.564+11.033 | 37.321+13.099 | 34.822+10.054 | 36.984+13.256 | 0.592 |
| TVF | 6.818+3.681 | 8.617+4.163 | 10.524+4.403 | 10.32+4.836 | <0.05 |
Mean of TVF in males is found 9.53% and in females 9.26%, mean of TVF in Diabetic cohort is 10.9% whereas in non diabetics 8.7%. Similarly, in hypertensive TVF is 10.7% and in non hypertensive 8.6 %.
Relationship of total visceral fat and WC is represented in figure 1 which shows a direct relationship between both the variables increasing proportionately along each other.
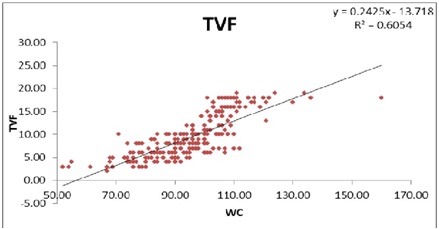
Figure 1: Relationship of total visceral fat and WC.
DISCUSSION
The higher prevalence of cardiovascular morbidity and mortality in obese patients with central distribution of fat is well known [6]. It is estimated that around 20-25 percent of the world’s adult population have the metabolic syndrome and they are twice as likely to die from and three times as likely to have a heart attack or stroke compared with people without the syndrome. One of the major factors affecting the differences in adiposity is the different ethnic origin [5]. There is established data available giving evidence of higher susceptibility of visceral adipose tissue deposition in whites then blacks, this is further endorsed by the presence of higher plasma triglyceride and apolipo protein B levels in whites when compared to blacks [7,8].
Asian population when compared with subjects of other ethnic origin is observed to have more adipose visceral tissue deposition at lower BMI values in several studies. This may be the reason why Asians are susceptible to develop Type 2 Diabetes mellitus at a lower BMI value than whites [9]. However to further strengthen this hypothesis extensive imaging of body fat distribution is needed specifically in a cohort of different ethnicities to define the high risk abdominal obesity on a global scale.
In our study, age has shown high significance with the visceral adiposity as most of the individuals with a visceral fat value of >9% falls in the age group of (45.8±11.19), thus the higher the age the more the chances of developing central obesity. Similarly, higher BMI had higher visceral adiposity. There was a wide range of distribution of subjects in the obese category from 9 to 17% also explains why all the subjects have not developed the complications of visceral fat deposition, as the subjects having values of VF% just above normal levels are less likely to develop diabetes or hypertension.
Another important observation is that only 30% of the total subjects have a visceral fat % of > 9 which is considered abnormal for Asian population, consequently, 22% of the total sample has diastolic hypertension and 15% of the sample had systolic hypertension and nearly all of them belong to the high visceral fat group. In table 4 when significance testing was applied on the measures comparing hypertensive and non hypertension subjects, all the variables showed a high significance P<0.00. Interestingly, total body fat has not shown any significance with the visceral fat percentage a finding that was predicted in several studies but still not anticipated. This observation confirms the finding of previous studies negating the predictability of total body fat for hypertension [10].
The study is also evident for the fact that almost all the subjects who had systolic and diastolic hypertension had a WC of 106.13+ 11.53 and belong to higher VF group (>9%). The means of total body fat content of the same groups with or without diabetes and hypertension is 36.57±11.97. On the contrary, means of TVF in diabetes (10.95±4.57) is significantly higher than non diabetics (8.75±4.45), similar is the case with Hypertension where means of TVF in Htn (10.71±4.39) is significantly higher than non Htn (8.64±4.52). This finding further seconds the theory that it is not the total body fat that determines the metabolic profile and predicts diabetes mellitus and hypertension instead visceral adiposity has proven to be the major determinant [11].
Our study further endorses that the higher age groups i.e., >40yrs are more prone to have a higher BMI, WC, TVF and systolic BP or in other words more visceral adiposity and obesity resulting in poor control on blood pressure as well as more likely to become diabetic.
WC has proved to be strongly associated with visceral fat with a value of P <0.05 in our study and therefore, justifies its importance for its consideration as a single and most feasible anthropometric measure that identifies the metabolic risk of an individual. However, the limitation remains that it cannot differentiate between the visceral and subcutaneous fat. Secondly, the sample size of diabetics is just satisfactory as it is a cross sectional study.
WC has proven to have the closest relationship with the measure of visceral adipose tissue and studies suggest that visceral adipose tissue may be particularly sensitive to the metabolic risks in Asians. Our finding is endorsed by a study recently done which compared different obesity indices to predict incident hypertension, it included Visceral Adiposity Index (VAI), Hyper Tri Glyceridemic-Waist (HTGW) phenotype, A Body Shape Index (ABSI), Body Mass Index (BMI), Waist Circumference (WC), Waist-to-Height Ratio (WHtR) and Waist-To-Hip Ratio (WHR). WHR, WHtR and WC were more strongly associated with the development of HTN [12].
A number of mechanisms may be implicated in the pathophysiology of obesity-related hypertension which includes secretion of Leptin from adipocytes which stimulates the sympathetic nervous system, activation of renin angiotensin and aldosterone system, decrease in natriuretic peptide and in salt excretion, all of which contribute to hypertension. In addition, in several research studies “hypertriglyceridemic waist” is recommended as a clinically effective marker for identifying the risk of prediabetes and diabetes in first degree relatives of type 2 diabetic patients [13].
Li Xu in his study done in China also proved that along with the strong association of visceral fat and WC, an increase in glucose metabolic risk factors fasting blood glucose, HbA1c, a decreasing HDL and increasing TG trend is observed in abdominally obese individuals [14]. Finelli et al in his study stresses the need to reduce visceral fat as a treatment strategy to delay age related diseases and thus increase longevity, he suggested a strategy in which the intake levels should be titrated on the current weight of the individual, activity levels and weight loss goals [15]. The prediction that diabetes incidence will double by 2025 indicates a parallel rise in cardiovascular-related illness and death, with an inevitable and profound impact on global healthcare systems. This was stated in the year 2015 in a consensus workshop by IDF [5].
Pakistan is expected to attain 5th position in the year 2025 among the countries who have most prevalent diabetic population according to IDF and every 4th individual will be harboring this multi systemic disease which is very alarming [16]. It is and further will be disastrous on this developing country, the best strategy therefore is primary prevention by life style modification.
LIMITATIONS
The percentages of TVF are significantly high in both the diabetic and hypertensive group but the number of diabetics and hypertensive in this randomly selected cohort is less, therefore the finding has to be endorsed if reproduced in similar studies with a bigger sample size in this setting. In this regard we have used reference studies from China, India and also Brazil, which have shown similar results. The unawareness of healthy living has posed a great threat to the vast majority of population be it educated or uneducated. Therefore, the need of the day is to emphasize on prevention along with the management on the already existing epidemic of Diabetes however, to halt these steep rise of numbers we need to develop a strategy to collect the statistics of our population and underline the most important determinant responsible. Health communities with the support of government can help to educate the population at a massive scale.
CONCLUSION
Significant correlation is found between TVF and systolic BP and WC in this study. Higher values of TVF is observed diabetic and hypertensive individuals. Contrary to the general concept males have shown an equally higher percentage of visceral fat than females in our cohort. Therefore, central obesity should be aggressively managed in order to lower the risk of diabetes and hypertension in both genders. Our study further reveals that WC can be used as an approximate index of abdominal visceral adiposity and in the evaluation of metabolic risks. Further RCT’s are warranted with a larger sample size to generalize the findings for our population.
REFERENCES
- Després JP (2012) Body fat distribution and risk of cardiovascular disease: an update. Circulation 126: 1301-1313.
- Sandeep S, Gokulakrishnan K, Velmurugan K, Deepa M, Mohan V (2010) Visceral & subcutaneous abdominal fat in relation to insulin resistance & metabolic syndrome in non-diabetic south Indians. Indian J Med Res 131: 629-635.
- Mehta SR, Godsland IF, Thomas EL, Pavitt DV, Morin SX, Bell JD, et al. (2012) Intrahepatic insulin exposure, intrahepatocellular lipid and regional body fat in nonalcoholic fatty liver disease. J Clin Endocrinol Metab 97: 2151-2159.
- CADI (2001) South Asian Modified National Cholesterol Education Program Adult Treatment Panel III criteria (SAM-NCEP) criteria. CADI, IL, USA.
- http://www.uff.br/camelia/diretrizes/sindrome%20metabolica/IDF_Metasyndrome_definition.pdf
- Calle EE, Thun MJ, Petrelli JM, Rodriguez C, Heath CW Jr (1999) Body mass index and mortality in a prospective cohort of U.S adults. N Engl J Med 337:1097–105.
- Després JP, Gagnon J, Bergeron J, Couillard C, Leon AS, et al. (2000) Race, visceral adipose tissue, plasma lipids, and lipoprotein lipase activity in men and women: the Health, Risk Factors, Exercise Training, and Genetics (HERITAGE) family study. Arterioscler Thromb Vasc Biol 20: 1932-1938.
- Katzmarzyk PT, Bray GA, Greenway FL, Johnson WD, Newton RL Jr, et al. (2010) Racial differences in abdominal depot-specific adiposity in white and African American adults. Am J Clin Nutr 91: 7-15.
- Nishida C (2004) Appropriate body-mass index for Asian populations and its implications for policy and intervention strategies. Lancet 363: 157-163.
- Catherine AS, Steven EK, Wilfred YF, Tomoshige H, Donna LL, et al. (2015) Changes in intra-abdominal fat predicts the risk of hypertension in japanese americans. Hypertension 66: 134-140.
- De Lorenzo A, Bianchi A, Maroni P, Iannarelli A, Di Daniele N, et al.(2013) Adiposity rather than BMI determines metabolic risk. Int J Cardiol 166: 111–117.
- Janghorbani M, Aminorroaya A, Amini M (2017) Comparison of different obesity indices for predicting incident hypertension. High Blood Press Cardiovasc Prev.
- Zheng S, Shi S, Ren X, Han T, Li Y, et al. (2016) Triglyceride glucose-waist circumference, a novel and effective predictor of diabetes in first-degree relatives of type 2 diabetes patients: cross-sectional and prospective cohort study. J Transl Med 14: 260.
- Li X, Katashima M, Yasumasu T, Li KJ (2012) Visceral fat area,waist circumference and metabolic risk factors in abdominally obese chinese adults. Biomed Environ Sci, 25: 141-148
- Finelli C, Sommella L, Gioia S, La Sala N, Tarantino G (2013) Should visceral fat be reduced to increase longevity?. Ageing Res Rev. 12: 996-1004.
- International Diabetes Federation (2006) Diabetes Atlas. International Diabetes Federation, Brussels, Belgium.
Citation: Kidwai SS, Bashir F, Nageen A, Munir SM, Ara J (2017) Visceral Adiposity: A Major Predictor in Diabetes and Hypertension. J Obes Weight Loss 2: 007.
Copyright: © 2017 Saera Suhail Kidwai, et al. This is an open-access article distributed under the terms of the Creative Commons Attribution License, which permits unrestricted use, distribution, and reproduction in any medium, provided the original author and source are credited.
Journal Highlights
© 2026, Copyrights Herald Scholarly Open Access. All Rights Reserved!