Journal of Obesity & Weight Loss Category: Medical
Type: Research Article
Weight, Mental Health, Income and Marital Satisfaction: Evidence from the National Longitudinal Survey of Youth
*Corresponding Author(s):
Manouchehr MokhtariSchool Of Public Health, University Of Maryland - College Park, 1142 SPH Building, College Park, MD 20742, United States
Tel:+1 3014054014,
Email:mokhtari@umd.edu
Received Date: Sep 30, 2015
Accepted Date: Nov 14, 2015
Published Date: Nov 30, 2015
Abstract
Using a nationally representative sample of US married female respondents from the National Longitudinal Survey of Youth (1979), our study examined the degree to which wives’ body weight is related to marital satisfaction, as well as, the possibility that depression symptoms mediate this relationship. First, we found an inverse relationship between body weight and marital satisfaction that was independent of physical health limitations, depressive symptoms, length of marriage, number of children and ethnicity. Second, we considered the role of income in marital satisfaction. The addition of income rendered the association between body weight and marital satisfaction null suggesting that income, not body weight, is the most important factor in predicting marital satisfaction.
Keywords
BMI; Depression; Happiness; Health; Income; Marital satisfaction; Mental health; NLSY; Obesity; Weight
INTRODUCTION
Excess body weight is well-recognized as a major health issue around the world. Those with excess body weight do not usually live as long as those with a healthy body weight. Disease orientation in research often directs researchers to focus on the warning signs for heart disease, type 2 diabetes, high blood pressure, high cholesterol levels, stroke, liver and gallbladder disease, sleep apnea and respiratory problems, arthritis, abnormal menstrual periods and infertility in women, and certain cancers. On the other hand, the influence of excess body weight on marital satisfaction, mental health, and risk of depression, appearance, attraction, and relationship receive only scant focus in scholarly work, but see [1-9]. Similarly, while referencing the role of economic factors, scholarly work often do not include economic models that would show the role that income might play in marital satisfaction [1-3]. The association of mental health, depression, and appearance with satisfaction provides a gateway for exploring the psychosocial association between body weight and marital satisfaction. In addition to psychosocial predictors of marital satisfaction, controlling for economic and sociodemographic factors allows for shedding light on important drivers of marital satisfaction for young women in the United States.
Using a nationally representative sample of US married female respondents from the [10], aged 37-45 in 2002, our study examines the degrees to which wives’ body weight is related to marital satisfaction as well as the possibility that depression symptoms and income mediate the relation between body weight and marital satisfaction.
While economic theory links income and satisfaction (utility), social norms provide a conceptual model for understanding the link between body weight and marital satisfaction. This model emphasizes the high reward for conformity to societal ideals, such as thinness, which are often widely internalized by members of a society [11-14]. Because the social norm is for women to be thin in American society, overweight women are stigmatized [11,12,15-17]. Because women commonly internalize society’s expectations, those who deviate from these standards can be expected to experience lower personal satisfaction and self-esteem, and even depression, because they have personally violated the norm [18,19]. Depression in turn negatively influences individual’s marital satisfaction [18,20,21]. In sum, social norms theory suggests that those who deviate from society’s expectations by having higher body weight will experience higher levels of depression and consequently lower levels of marital satisfaction [18].
BODY WEIGHT AND MARRIAGE
Recent longitudinal [7,8] and cross-sectional [20-22] studies have described the association between body weight, marital status, and health status. Being married is associated with significant weight gain, whereas, being divorced is associated with significant weight loss [8,20]. Married people weigh more than the never married and have the highest self-reported health status, followed by widowed and then single people, with separated people having the worst health status [21,23,24]. Married women also tend to perceive themselves as overweight and are more likely to want to lose weight than women who are not married [22]. Additionally, recent research has found an interplay between hostile marital behaviors, mood disorders and individual metabolic responses [6] indicating that body weight is not an isolated experience in couples. Moreover, Meltzer, et al., [7] found that it was the comparison of wives’ body mass index with husbands’ that was linked to marital satisfaction. These findings suggest that there is something about marriage that influences one’s body weight [4,5,25,26], yet few studies have investigated factors within a marriage that could influence body weight.
While focusing on marital dissolution or marital status, researchers often examine the impact of either body weight or physical health. This leaves a gap in research for the potential association between body weight and the quality of the marital relationship. The present study adds to the literature in an important way. This study examines the link between body weight and marital satisfaction while taking into account the effects of other factors (e.g., income) known to be related to marital satisfaction. Additionally, our study investigates the association between body weight and marital satisfaction using depression as a mediator and a potential pathway from body weight to marital satisfaction.
While focusing on marital dissolution or marital status, researchers often examine the impact of either body weight or physical health. This leaves a gap in research for the potential association between body weight and the quality of the marital relationship. The present study adds to the literature in an important way. This study examines the link between body weight and marital satisfaction while taking into account the effects of other factors (e.g., income) known to be related to marital satisfaction. Additionally, our study investigates the association between body weight and marital satisfaction using depression as a mediator and a potential pathway from body weight to marital satisfaction.
ECONOMICS AND SOCIODEMOGRAPHICS OF MARITAL SATISFACTION
Economics points to income as the main driver of marital satisfaction
Psychosocial factors are not the only competing predictors of marital satisfaction. Economic approaches to understanding marital satisfaction (utility, U) postulates that a rational individual maximize her utility subject to constraints she faces. For example, a female respondent with a depression threshold level D, maximizes her utility U>D, which depends on a level of consumption C that does not influence her body weight and a level of consumption Cw that does. In particular, let’s assume that body weight W deceases if she consumes Cw. Also assume that a female respondent with an income level I faces stress S, and prices P for C and Pw for Cw. Then maximization of U = U[C, W(Cw,S), S] Subject to I = PC + PwCw, assuming ∂U/∂C>0, ∂U2/∂C2<0, ∂U/∂W<0, ∂U/∂S<0, ∂W/∂Cw<0, ∂U2/∂Cw2<0, ∂W/∂S>0, yields consumption levels that are increasing functions of income, i.e., ∂C/∂I>0 and ∂Cw/∂I>0. Therefore, we may note that, while higher weight reduces female respondents utility or marital satisfaction ∂U/∂W<0, her utility U=U{C(I),W[Cw(I),S],S} still remains as a rising function of income; thus, implying that income is the most crucial determinant of marital satisfaction.
Extant literature indicates that higher income individuals are less likely to be obese than lower income individuals [27-30]. Lower income individuals are less able to adhere to societal norms of being thin based on the notion that one’s ability to control time, food quality, physical activity level, and stress levels are differentially associated with income [31-33]. For example, an individual earning $35,000 has less time and money than an individual earning $60,000 to maintain a normal body weight and a happy relationship. Since income can influence both body weight and marital satisfaction differently depending on the level of income, we are hypothesizing that income will moderate the association between body weight and marital satisfaction.
Extant literature indicates that higher income individuals are less likely to be obese than lower income individuals [27-30]. Lower income individuals are less able to adhere to societal norms of being thin based on the notion that one’s ability to control time, food quality, physical activity level, and stress levels are differentially associated with income [31-33]. For example, an individual earning $35,000 has less time and money than an individual earning $60,000 to maintain a normal body weight and a happy relationship. Since income can influence both body weight and marital satisfaction differently depending on the level of income, we are hypothesizing that income will moderate the association between body weight and marital satisfaction.
Happily married people have fewer health complaints
There is evidence that physical health and marital satisfaction have a reciprocal effect on one another [34-35]. Married couples report being happier and in better health than individuals who are not married [36]. Furthermore, mortality rates in the US are higher for non-married people than married people [24]. Happily married people have fewer health complaints and higher health ratings [37-40], sleep better, and have fewer physician visits than couples who are less satisfied with their marriage [9,41]. Changes in marital quality also correlate with changes in physical health [9]. Decline in health is linked with decreased marital satisfaction [42]. Health and marriage are so intertwined that researchers have described the health gain from marriage as similar to the benefit from giving up smoking [43]. We examine them as moderating variables because the association between overweight and marital satisfaction may vary depending on the respondent’s perceived health status. Overweight individuals who perceive themselves as healthy are likely to evaluate themselves more positively than overweight individuals who perceive themselves to be in poor health.
Marital satisfaction has a “U” shaped relation to length of marriage
In the beginning of marriage, marital satisfaction tends to be high, declining somewhat over the course of the marriage (particularly with the introduction of children - usually between the years of 7 and 14) and then increasing again and eventually leveling off [44-46]. There are contradictory findings regarding the effect that children have on marital satisfaction, as both positive [47] and negative associations [48] have been found. Length of marriage and number of children are included in our study as control variables.
Race and ethnicity are linked to body weight
With the increase in the awareness of the association of race and ethnicity with health, particularly body weight, these variables become increasingly important to control in studies. For example, seventy three percent of African American women are overweight or obese compared to less than 60% of European-American [49]. Race and ethnicity are also found to be important factors in measuring the effectiveness of publicly funded weight loss programs [50]. However, the distinction between race and ethnicity, as two completely separate factors influencing an outcome, are often blurred e.g., [50]. Nonetheless, the National Institute of Health adoption of the 997 Office of Management and Budget (OMB) revised minimum standards, which include two ethnic categories (Hispanic or Latino, and Not Hispanic or Latino) and five racial categories (American Indian or Alaska Native, Asian, Black or African American, Native Hawaiian or other Pacific Islander, and White), provide appropriate guidance for collecting data and consideration of the racial and ethnic differenced in the underlying empirical studies. Given that, recent findings suggest that there could be an interaction between race and body weight in determining marital satisfaction, such that the association between body weight and marital satisfaction might be different among racial groups. Consequently, in our study race and ethnicity was included as a moderator.
To date, few studies have examined the link between body weight and marital satisfaction while taking all of these additional variables into account. Informed by social norms theory, we hypothesized that body weight would be negatively correlated with marital satisfaction independent of length of marriage and number of children. Second, we hypothesized that depression would mediate the association between body weight and marital satisfaction. Third, we hypothesized that physical health, health status, income, and race and ethnicity would moderate the relationship between body weight and marital satisfaction independent of length of marriage and number of children.
To date, few studies have examined the link between body weight and marital satisfaction while taking all of these additional variables into account. Informed by social norms theory, we hypothesized that body weight would be negatively correlated with marital satisfaction independent of length of marriage and number of children. Second, we hypothesized that depression would mediate the association between body weight and marital satisfaction. Third, we hypothesized that physical health, health status, income, and race and ethnicity would moderate the relationship between body weight and marital satisfaction independent of length of marriage and number of children.
METHOD
We used the National Longitudinal Survey of Youth [10] (NLSY79). The survey was conducted annually from 1979-1994 and biennially from 1996 to the present. The NLSY79 sample is a multi-stage, stratified random sample. The NLSY79 has retention rates close to 90 percent from 1979 to 2002. The dataset provides a nationally representative sample of 12,686 young men and women who were between the ages of 14 and 22 when they were first interviewed in 1979. However, 4,962 cases were eliminated due to dropping out (2,722), refusal (1,092), cannot be located (410), death (346), difficult cases (257) and other reasons (135). In 2002 out of 7,724 (=12,686-4962) there were 4,070 married respondents, and out of those, 2,573 were living with their spouse or partner. Only those female respondents reporting living with their partner were asked how happy they were with their relationship and, therefore, were eligible to be in our sample. After restricting the sample to the women who are between 37 and 45 years of age in 2002, and excluding observations that would correspond to predictors with missing observations, the final analytic sample is N=1,640 (Table 1).
Given that, the dependent variable, marital satisfaction, is a categorical variable, therefore, logistic regression models were fit. In particular, it is worth noting that the dependent variable (yi=marital satisfaction) in this study is an ordered indicator of levels of satisfaction (µj, where, j=0,1,2,3). Therefore, under the proportional odds assumption, an ordered logit model (yi*=Xi β+ε_i, where, μj-1<yi*≤μ_j) provides the proper setup for the reported regression analysis in this study [51]. One must note that the odds ratios are linearly related to the predictors in the mode and that the parameters (β) are estimated by running the following regression, where, ln (.) is log of the odds:
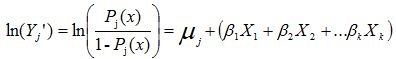
For the reported statistical analysis in this paper, we used statistical software Stata [52] and [53], which allow for the proper use of weights when the sample has a complex design. The weight variable for 2002, which is included in the NLSY79, was used for the statistical analyses that are reported in Tables 1 and 2.
Given that, the dependent variable, marital satisfaction, is a categorical variable, therefore, logistic regression models were fit. In particular, it is worth noting that the dependent variable (yi=marital satisfaction) in this study is an ordered indicator of levels of satisfaction (µj, where, j=0,1,2,3). Therefore, under the proportional odds assumption, an ordered logit model (yi*=Xi β+ε_i, where, μj-1<yi*≤μ_j) provides the proper setup for the reported regression analysis in this study [51]. One must note that the odds ratios are linearly related to the predictors in the mode and that the parameters (β) are estimated by running the following regression, where, ln (.) is log of the odds:
For the reported statistical analysis in this paper, we used statistical software Stata [52] and [53], which allow for the proper use of weights when the sample has a complex design. The weight variable for 2002, which is included in the NLSY79, was used for the statistical analyses that are reported in Tables 1 and 2.
VARIABLES
Marital satisfaction
Marital satisfaction was measured by the question “Would you say that your marriage is…” “1” very happy, “2” fairly happy, or “3” not too happy. We also experimented with including those who are divorced by adding a coding value of “4” for divorced respondents; thus, suggesting that they were defined as being extremely unhappy. For the analysis, responses to this question were reverse coded, such that higher scores indicated greater marital satisfaction, not marital dissatisfaction. The “not too happy” responses were collapsed with “extremely unhappy” responses because of the small number of responses in the “not too happy” category.
Body mass index
Body Mass Index (BMI), the main independent variable, was calculated by the respondent’s self-reported height and weight measured as follows: weight/height2 in pounds and inches (BMI = [weight in pounds/(height in inches) x (height in inches)] x 703). Respondents’ BMI were categorized as “underweight” (BMI under 18.5), “normal weight” (18.5-24.9), “overweight” (25-29.9) or “obese” (over 30) [54]. The categories of normal weight, overweight and obese were entered separately with indicator variables to account for the possibility that there could be a non-linear relationship between body weight and marital satisfaction.
Depression symptoms
Depression symptoms were calculated by the 9-item version of Center for Epidemiologic Studies Depression scale (CES-D) [55]. These nine items inquire about how often each of nine symptoms is experienced during the past week. Each item is scored from 0-3: “0” rarely, none of the time, one day; “1” some, a little of the time, 1-2 days; “2” occasionally, moderate amount of the time, 3-4 days; or “3” most, all of the time, 5-7 days. The index of depression is an individual’s total score (range: 0-27). Dummy variables were created by taking the first third of the sample responses (scoring a 0 on the CES-D scale), the second tertile (scoring from 1-3) and the third tertile (scoring 4 or more).
Physical health limitation
Physical health limitation was calculated by the respondent’s response to a dichotomous question “Would you be limited in the kind or amount of work you could do on a job for pay because of your health?”
Health status
Health status was assessed by the question, “In general, would you say your health is…” “1” excellent, “2” very good, “3” good, “4” fair or “5” poor. The fair and poor categories were collapsed together as “poor health” because of the small percentage of respondents who rated their health as poor (less than 2%).
The CES-D and the health status items were included in a health module that was administered to respondents when they turned 40. Therefore, the respondents in this sample were asked their health status and CES-D questions between the years of 1998 and 2006.
The CES-D and the health status items were included in a health module that was administered to respondents when they turned 40. Therefore, the respondents in this sample were asked their health status and CES-D questions between the years of 1998 and 2006.
Income
Income quartiles were created from the respondents’ total household income. The four quartiles were under $33,200, between 33,200 and $57,000, between $57,000 and $90,000 and over $90,000.
Number of children
Indicator variables were coded reflecting the number of children the respondent has: zero children; one child; two children; and three or more children.
Length of marriage
Length of marriage was estimated by the variable that calculated current marital status and previous marital transitions. Respondents were asked if their first marriage had never ended, if they were in their second marriage, divorced from their first marriage and not remarried, divorced a second time and not remarried, or in their third marriage. For married respondents in their first marriage, length of marriage was calculated by subtracting the year of their first marriage from 2002 and likewise for respondents in their second and third marriages. For respondents who had been divorced a first or second time, length of marriage was calculated by subtracting the year of the first or second marriage by the year the first or second marriage ended, respectively. Previous research has identified two lengths of marriage that are at the highest risk for divorce: seven years and fourteen years [44-46]. Three categories of length of marriage were created, seven years and under, between seven and fourteen, and fourteen years and over.
Race and ethnicity
Based on the OMB’s revised minimum standards for maintaining, collecting, and presenting data on race and ethnicity, binary variables for two ethnic categories, ‘Hispanic and Latino’ and ‘Not Hispanic and Latino,’ and five racial categories (American Indian or Alaska Native, Asian, Black or African American, Native Hawaiian or Other Pacific Islander, and White) were created.
The dependent variable, marital satisfaction, is a categorical variable; therefore, logistic regression models were fit. We modeled the independent variables and marital satisfaction comparing extremely happy and fairly happy with the referent group extremely unhappy. We modeled four different associations of the variables used in this study. First, we examined the bivariate association of body weight category (normal weight, overweight and obese) and marital satisfaction. Since the directions and significance of the relationships shifted substantially (i.e., more than 10%), we examined how each control variable independently influenced the bivariate relationship (Table 2). Third, we examined whether depression symptoms mediated the relationship between body weight and marital satisfaction. Finally, in order to assess if physical health limitations, health status, income and race and ethnicity moderated the association between body weight and marital satisfaction, interaction terms were created and the interaction terms for each independent variable were added to the full model. We also conducted post hoc analyses to assess the independent relationships among body weight, income and marital satisfaction.
The dependent variable, marital satisfaction, is a categorical variable; therefore, logistic regression models were fit. We modeled the independent variables and marital satisfaction comparing extremely happy and fairly happy with the referent group extremely unhappy. We modeled four different associations of the variables used in this study. First, we examined the bivariate association of body weight category (normal weight, overweight and obese) and marital satisfaction. Since the directions and significance of the relationships shifted substantially (i.e., more than 10%), we examined how each control variable independently influenced the bivariate relationship (Table 2). Third, we examined whether depression symptoms mediated the relationship between body weight and marital satisfaction. Finally, in order to assess if physical health limitations, health status, income and race and ethnicity moderated the association between body weight and marital satisfaction, interaction terms were created and the interaction terms for each independent variable were added to the full model. We also conducted post hoc analyses to assess the independent relationships among body weight, income and marital satisfaction.
RESULTS
The mean BMI in this sample is 27, within the “overweight” category [54]. Two percent of the sample is underweight, 44% normal weight, 29% overweight and 25% obese. (88%) of respondents reported no physical health limitations. The mean CES-D score was approximately a 5, almost 25% of respondents reported being in excellent health, almost 40% in very good health, 25% in good health, and around 10% in fair or poor health (Table 1). The average length of marriage was approximately 12 years (SD=6.56) with 29% of respondents married under seven years, 28% of respondents married between seven and fourteen years and 44% of respondents married over 14 years. The weighted sample indicates that 6% self-identify themselves as Hispanic or Latino; thus, 94% self-identify as ‘Not Hispanic and Latino’ (Table 1). The weighted sample racial categories indicate that sample consist of 4% American Indian or Alaska Native, 1% Asian, 8% Black or African American, less than 1% Native Hawaiian or Pacific Islander, 77% White, and 8% who self-identify as others for their race. As point of comparison, one may note that the US population consists of approximately 75% White, 12% Black and 12% Hispanic [56]. The average income was $72,407 (SD=$66,687). On average, respondents had two children (SD=1.27), with 15% of respondents having no children, 18% having one child, 39% having two children and 27% having three or more children.
| Variables | Mean | Standard Deviation | Range |
| Marital satisfactiona | 2.85 | 1.32 | 1 - 3 |
|
Body weight (BMI)b |
26.81 |
5.94 |
18-74 |
| Incomee ($1000) | 72.406 | 66.81 | 0.00-390.66 |
|
Health statusf Length of marriageg |
2.24 12.14 |
0.98 6.56 |
1-4 0-24 |
| Number of childrenh | 1.91 | 1.27 | 0-10 |
| Ethnic Composition: | |||
| Hispanic and Latino | 0.06 | 0.23 | 0-1 |
| Not Hispanic and Latino | 0.94 | 0.23 | 0-1 |
| Racial Composition: | |||
| American Indian or Alaska Native | 0.04 | 0.20 | 0-1 |
| Asian | 0.01 | 0.10 | 0-1 |
| Black or African American | 0.08 | 0.28 | 0-1 |
| Native Hawaiian or Pacific Islander | 0.00 | 0.4 | 0-1 |
| White | 0.77 | 0.41 | 0-1 |
| Others | 0.08 | 0.27 | 0-1 |
aMarital satisfaction: 1=very unhappy, 2=fairly happy, 3=very happy; bBody in the table is the continuous measure of body mass index - in the analysis, BMI was divided into normal weight (BMI 18.5-25: 43.8% of the sample), overweight (BMI 25-30: 29.3%), and obese (BMI>30: 25%); cDepression symptoms (calculated by the CESD scale) was divided into three equal groups for the analysis (CESD=0, CESD=1-3, or CESD≥4); dPhysical health limitation: 0=No limitation, 1=With limitation; eIncome was divided into quartiles for the final analysis (<$33,200, 33,200-56,999, 57,000-89,999, and >90,000); fHealth status: 1=fair/poor health, 2=good health, 3=very good health, 4=excellent health; gLength of marriage was divided into three groups for analysis: 1=under 7 years, 2=7-14 years, 3=>14 years; *In addition, dummy variables for ethnicity were included in the final analysis (White=84%, Black=8.92%, Hispanic=7.01%).
At first the bivariate model of body mass index divided into weight status and marital satisfaction was run. Compared to normal weight individuals, overweight individuals are 23% less likely to be happy with their marriage (OR, 0.77 [0.62-0.96], p
The addition of depression symptoms (OR, 0.39 [0.30-0.50], p<0.001) to the bivariate model (overweight: OR, 0.76, [0.62-0.96], p
When health status is added into the bivariate model, it confounds the association between BMI and marital satisfaction, rendering no association between being overweight or obese and having lower marital satisfaction. Instead of BMI, health status predicted marital satisfaction (Table 2). Respondents who were in excellent health were 2.23 times more likely to be happy with their marriages than respondents in poor health (OR, 2.23 [1.58- 3.14], p<0.001). Respondents in very good health were 2.53 times more likely to be happy in their marriages than respondents in poor health (OR, 2.53 [1.82-3.51], p<0.001) and respondents in good health were 3 times more likely to be happy with their marriages than respondents in poor health (OR, 3.00 [2.10-4.29], p<0.001).
| A | B | C | D | E | F | G | H | |
| Normal Weight | ||||||||
| Overweight | 0.76* | 0.77* | 0.76* | 0.79* | 0.81 | 0.91 | 0.82 | 0.93 |
| (0.61, 0.95) | (0.63, 0.97) | (0.62, 0.95) | (0.63, 0.99) | (0.65, 1.01) | (0.72, 1.15) | (0.66, 1.02) | (0.73, 1.19) | |
| Obese | 0.72** | 0.72* | 0.70** | 0.69* | 0.76* | 0.93 | 0.82 | 0.95 |
| (0.57, 0.91) | ( 0.57, 0.91) | (0.55, 0.89) | (0.54, 0.88) | (0.60, 0.97) | (0.73, 1.20) | (0.65, 1.05) | (0.73, 1.24) | |
| CESD under 8 | ||||||||
| over 8 | 0.39** | 0.61** | ||||||
| (0.30, 0.51) | (0.45, 0.82) | |||||||
| No Physical Limit | ||||||||
| Physical Limit | 0.62** | 1.19 | ||||||
| (0.46, 0.83) | (0.83, 1.69) | |||||||
| 0 Children | ||||||||
| 1 Child | 0.96 | 0.97 | ||||||
| (0.70, 1.31) | ( 0.68, 1.38) | |||||||
| 2 Children | 1.68* | 1.3 | ||||||
| (1.28, 2.22) | (0.95, 1.77) | |||||||
| ≥3 Children | 1.61* | 1.43 | ||||||
| (1.21, 2.16) | (1.02, 1.99) | |||||||
| Married <7 years | ||||||||
| 7-14 years | 1.42* | 1.06 | ||||||
| (1.12, 1.81) | ( 0.81, 1.38) | |||||||
| Over 14 years | 3.70** | 2.34** | ||||||
| (2.90, 4.72) | (1.77, 3.09) | |||||||
|
Not Hispanic_Latino |
||||||||
|
Hispanic_Latino |
0.81* | 0.75 | ||||||
| (0.65, 1.01) | (0.48, 1.15) | |||||||
| White | ||||||||
| Black | 0.53** | 0.78 | ||||||
| (0.38, 0.75) | (0.53, 1.13) | |||||||
| Native_Indian_Alaskan | 0.84 | 1.17 | ||||||
| (0.53, 1.32) | (0.70, 1.94) | |||||||
| Asian | 1.23 | 1.72 | ||||||
| (0.48, 3.14) | (0.61, 4.78) | |||||||
| Hawaiian_P.I. | 0.61 | 0.82 | ||||||
| (0.9, 3.88) | (0.11, 6.17) | |||||||
| Income<$33,199 | ||||||||
| 3.79** | 3.25** | |||||||
| (2.87, 5.00) | (2.43, 4.32) | |||||||
| $57,000-$89,999 | 8.34** | 6.73** | ||||||
| (6.25, 11.14) | (4.97, 9.10) | |||||||
| >$90,000 | 13.47** | 10.50** | ||||||
| (9.89, 18.36) | (7.59, 14.53) | |||||||
| Poor Health | 2.23* | 1.38 | ||||||
| (1.58, 3.14) | (0.89, 2.13) | |||||||
| Very Good Health | 2.53* | 1.25 | ||||||
| (1.82, 3.51) | (0.84, 1.87) | |||||||
| Good Health | 3.00* | 1.48* | ||||||
| (2.10, 4.29) | (0.99, 2.21) | |||||||
| Constant (3/2) | 0.27/1.01 | 0.18/0.89 | -0.2/0.52 | -0.55/0.22 | 0.18/0/90 | -1.6/-0.73 | -0.77/-0.04 | 0.14/1.07 |
| Chi-square (df) | 2.15 (3) | 2.31 (3) | 31.84 (5) | 57.9 (4) | 2.21 (4) | 44.49 (5) | 7.53 (5) | 122.33 (17) |
(95% confidence interval are provided in the parentheses under the odds ratios)
Bold is reference group; **p<0.001, * p=0.05
Bold is reference group; **p<0.001, * p=0.05
The addition of income to the bivariate model also renders the association between BMI and marital satisfaction null. Income accounted for all of the association between BMI and marital satisfaction (overweight: OR, 0.91 [0.72-1.15], p<0.001; obese: OR, 0.93 [0.73-1.19], p<0.001). When compared to respondents who had an income under $33,200 those individuals with an income between $33,200 and $57,000 are 3.79 times more likely to be happy with their marriage (OR, 3.79 [2.87-5.00], p<0.001), whereas, individuals with an income between $57,000 and $90,000 are 8.34 times more likely to be happy with their marriage (OR, 8.34 [6.25-11.13], p<0.001). Individuals with an income over $90,000 are 13.47 times more likely to be happy with their marriage (OR, 13.47 [9.89-18.36], p<0.001) than individuals who earn less than $33,200. Income has a strong and consistent association with marital satisfaction - the higher the income; the happier individuals are with their marriages.
In the full model (Table 2), there is no association between BMI and marital satisfaction (overweight: OR, 0.93 [0.73-1.28], p>0.05; obese: OR, 0.95 [0.73-1.24], p>0.05) when controlling for depression symptoms, physical health limitations, number of children, length of marriage, race and ethnicity and income. There are independent associations between depression symptoms, being married for over 14 years, being in good health and all categories of income with marital satisfaction. Respondents who scored over eight on the CES-D scale were 38.6% less likely to be happy with their marriage (OR, 0.61 [0.45-0.82], p<0.001) than individuals reporting less than an eight on the CES-D scale. Respondents who were married for over 14 years were 2.34 times more likely to be happy than respondents who had been married for under 7 years (OR, 2.34 [1.77-3.09], p<0.001). Respondents who reported being in good health were almost 1.48 times more likely to be happy with their marriages (OR, 1.48 [0.99-2.20], p<0.05) than respondents who were in poor health. Respondents whose family income was between $33,200 and $56,999 were 3.25 times more likely to be happy with their marriage (OR 3.25 [2.43-4.32], p<0.001) and respondents whose family income was between $57,000 and $89,999 were 6.73 times more likely to be happy with their marriage (OR, 6.73 [4.97-9.10], p<0.001) and respondents who earned over $90,000 were 10.50 times more likely to be happy with their marriages (OR, 10.50 [7.59-14.53], p<0.001) compared to those respondents who earned less than $33,200.
To test the hypothesis that physical health, health status, income, and race and ethnicity would moderate the relationship between body weight and marital satisfaction, interaction terms were created for each level of each independent variable. For example, each level of physical health limitations (with a limitation, or without a limitation), health status (excellent health, very good health, good health and poor health), income (4th quartile, 3rd quartile, 2nd quartile, and 1stquartile), racial, and ethnic categories was multiplied by normal weight, overweight and obese. The interaction terms for each independent variable were then separately added into the full model to assess moderation -i.e., all of the interactions of health status were added into the full model, then removed, and then all of the interactions of income were added into the full model, and likewise for physical health limitation and race and ethnicity. There were no significant interactions (not shown). Our third hypothesis is not supported.
Additionally, in order to assess the independent relationships of body weight and marital satisfaction with income, post hoc models were run. We ran logistic regressions predicting income from body weight (overweight: OR, 0.65 [0.53-0.80], p<0.001; obese: OR, 0.53 [0.43-0.66], p<0.001), predicting marital satisfaction from income (OR, 2.33 [2.12-2.56], p<0.001) and predicting body weight from income (OR, 0.78 [0.72-0.85], p<0.001). Our post hoc analyses revealed that income is independently associated with both body weight and marital satisfaction. Overweight and obese individuals are 35% and 57%, respectively, less likely to have a higher income than normal weight individuals. Respondents with a higher income are 2.33 times more likely to be happy with their marriages than respondents who had a lower income. Finally, respondents with a high income were almost 22% less likely to have high body weight than respondents with a low income.
DISCUSSION
The purpose of this study was to examine the association between body weight and marital satisfaction among a representative sample of US women. Our investigation was informed by social norms and economic theories. Our findings are consistent with current trends in US society and with previous research [54,57,58]. Nearly 60% of our sample was overweight or obese and respondents who reported more depression symptoms were less happy with their marriages. Additionally, respondents who were married for over 14 years were happier with their marriages than respondents married for under 7 years [45,46].
We found a negative relationship between body weight and marital satisfaction that was independent of physical health limitations, depressive symptoms, length of marriage, number of children and race and ethnicity. However, the addition of income rendered the association between body weight and marital satisfaction null suggesting that income, not body weight, is the most important factor in predicting marital satisfaction. It is noteworthy that factors that previous research has indicated as influencing marital satisfaction (i.e., depression symptoms, physical health limitations, length of marriage, number of children and race and ethnicity) did not weaken the association between body mass index and marital satisfaction.
Our additional hypothesis that depression would represent the internalization of societal norms for thinness and mediate the relationship between body weight and marital satisfaction was not supported. We hypothesized that high BMI would be negatively associated with marital satisfaction due to society’s high valuation of being “thin” or attaining a “normal” BMI. We hypothesized that individuals who were overweight would have more depression symptoms and therefore, lower marital satisfaction than their normal weight counterparts. Social norms theory suggested that not living up to society’s expectations by being overweight would engender feelings of depression that would weigh heavily on marital satisfaction. This was not supported. Instead we found that high depression symptoms were related to low marital satisfaction and that high body weight was not related to high depression symptoms.
We also found a complex association of body weight and marital satisfaction with income. Income was found to be independently associated with both body weight and marital satisfaction: the higher one’s body weight, the lower one’s income, and the lower one’s marital satisfaction. This could indicate that contrary to our expectations that high body weight would create feelings of sadness; high body weight is associated with lower income. Because social norms theory was not supported through our findings, some other explanation for the relations among body weight, income, and marital satisfaction is needed.
Our finding that income is the best predictor of marital satisfaction highlights the importance of income in our society. There is nothing inherent in relationships that require money in order to be happy; however, in this consumer-driven society money is positively associated with many positive health and lifestyle outcomes. The lower one’s income the less control one has in one’s time, food intake, physical activity level, and stress levels [31-33].
However, income affects marital satisfaction differently depending on income level. Although there is a consistent and powerful dose effect at each level, it is not necessary to have a very high income to see positive effects on marital satisfaction. Even respondents who reported an income over $34,000 reported happier marriages than those respondents reporting the lowest income level.
In addition to the main findings discussed above, this study revealed an interesting health paradox: those respondents do not link obesity with poor health. The link between overweight/obesity and poor health outcomes is well established [59,60]. In this study, the majority of respondents perceived themselves to be in good health or better, despite 60% of the sample being overweight or obese. This finding could also indicate a disparity in the knowledge of the negative health implications of obesity among the respondents.
Implications for practice
The present findings have practical and clinical implications. Conflict over finances is an important predictor of marital discord and divorce [29,30], however, clinical training programs traditionally do not provide much education and training in helping couples cope with financial issues. The curricula in clinical training programs such as the ones in accredited AAMFT programs commonly do not include coursework on family finances. Our findings suggest that income could be an important area to focus on when assessing and working with individuals and their marriages.
In addition, the associations of body weight and income and income and marital satisfaction suggest that assessment of both body weight and income could be important in clinical settings. Our results suggest that body weight and income should be considered and even directly addressed in therapy.
In addition, the associations of body weight and income and income and marital satisfaction suggest that assessment of both body weight and income could be important in clinical settings. Our results suggest that body weight and income should be considered and even directly addressed in therapy.
CONCLUSION
This study sheds light on the association between body weight and marital satisfaction. Strengths of this study include using a representative sample of the population of the United States. The results of this study indicate that income affects two important areas of women’s lives: body weight and marital satisfaction. In addition to finding that income is the best predictor of marital satisfaction, we found that higher weight is associated with lower income, and lower income with lower satisfaction.
REFERENCES
- Averett SL, Sikora A, Argys LM (2008) For better or worse: relationship status and body mass index. Econ Hum Biol 6: 330-349.
- Bjerkeset O, Romundstad P, Gunnell D (2008) Gender differences in the association of mixed anxiety and depression with suicide. Br J Psychiatry 192: 474-475.
- Fu H, Goldman N (2000) The association between health-related behaviours and the risk of divorce in the USA. J Biosoc Sci 32: 63-88.
- Hayes D, Ross CE (1987) Concern with appearance, health beliefs, and eating habits. J Health Soc Behav 28: 120-130.
- Kallen D, Doughty A (1984) The relationship of weight, the self perception of weight and self esteem with courtship behavior. Marriage & Family Review 7: 93-114.
- Kiecolt-Glaser JK, Jaremka L, Andridge R, Peng J, Habash D, et al. (2015) Marital discord, past depression, and metabolic responses to high-fat meals: Interpersonal pathways to obesity. Psychoneuroendocrinology 52: 239-250.
- Meltzer AL, McNulty JK, Novak S, Butler EA, Karney BR (2015) Marriages are more satisfying when wives are thinner than their husbands. Social Psychological and Personality Science 2: 416-424.
- Sobal J, Rauschenbach B, Frongillo EA (2003) Marital status changes and body weight changes: a US longitudinal analysis. Soc Sci Med 56: 1543-1555.
- Wickrama K, Conger RD, Lorenz FO (1995) Work, marriage, lifestyle, and changes in men’s physical health. J Behav Med 18: 97-111.
- National Longitudinal Survey of Youth (1979). National Longitudinal Survey of Young Women, 1968-2003. Washington DC: Bureau of Labor Statistics, US Department of Labor.
- Millman M, (1980) Such a Pretty Face: Being Fat in America. WW Norton & Company, New York, USA.
- Allon N (1982) The stigma of overweight in everyday life. In: Woldman BB (ed.). Psychological aspects of obesity. New York, USA. Pg no: 130-174.
- White JM, Klein DM, Martin TF (2002) Family Theories. (4thedn), Sage Publications, California, USA.
- Zawawi JA (2014) Relationships between Body Mass Index, Body Image Dissatisfaction and Psychological Distress among Fitness Center Female Users in Zarqa-Jordan. International Journal of Humanities and Social Science 4: 109-130.
- Crocker J, Cornwell B, Major B (1993) The stigma of overweight: affective consequences of attributional ambiguity. J Pers Soc Psycho l 64: 60-70.
- Hebl M, Heatherton, T (1998) The stigma of obesity in women: the difference is black and white. Personality and Social Psychology Bulletin 24: 417-426.
- Hebl MR, Mannix LM (2003) The weight of obesity in evaluating others: a mere proximity effect. Pers Soc Psychol Bull 29: 28-38.
- Rehman US, Gollan J, Mortimer AR (2008) The marital context of depression: research, limitations, and new directions. Clin Psychol Rev 28: 179-198.
- Zhao G, Ford ES, Dhingra S, Li C, Strine TW, et al. (2009) Depression and anxiety among US adults: associations with body mass index. Int J Obes (Lond) 33: 257-266.
- Lipowicz A, Gronkiewicz S, Malina RM (2002) Body mass index, overweight and obesity in married and never married men and women in Poland. Am J Hum Biol 14: 468-475.
- Sobal J, Rauschenbach BS, Frongillo EA Jr (1992) Marital status, fatness and obesity. Soc Sci Med 35: 915-923.
- Klos LA, Sobal J (2013) Marital status and body weight, weight perception, and weight management among US adults. Eat Behav 14: 500-507.
- Umberson D, Liu H, Powers D (2009) Marital status, marital transitions, and body weight. J Health Soc Behav 50: 327-343.
- Verbrugge LM (1979) Marital status and health. Journal of Marriage and the Family 41: 267-285.
- Sobal J (1984) Marriage, Obesity and Dieting. Marriage Fam Rev 7: 115-139.
- Sobal J, Nicolopoulos V, Lee J (1995) Attitudes about overweight and dating among secondary school students. Int J Obes Relat Metab Disord 19: 376-381.
- Berry RE, Williams FL (1987) Assessing the Relationship between Quality of Life and Marital and Income Satisfaction: A Path Analytic Approach. Journal of Marriage and the Family 49: 107 -116
- Brown A, Siahpush M (2007) Risk factors for overweight and obesity: results from the 2001 National Health Survey. Public Health 121: 603-613.
- Kerkmann BC, Lee TR, Lown JM, Allgood SM (2000) Financial management, financial problems and marital satisfaction among recently married university students. The Journal of the Association for Financial Counseling and Planning Education 11: 55-64.
- Lawrence FC, Thomasson RH, Wozniak PJ, Prawitz AD (1993) Factors relating to spousal financial arguments. Financial Counseling and Planning 4: 85-93.
- Adler NE, Ostrove JM (1999) Socioeconomic status and health: what we know and what we don’t. Ann N Y Acad Sci 896: 3-15.
- Lantz PM, House JS, Lepkowski JM, Williams DR, Mero RP et al. (1998) Socioeconomic factors, health behaviors, and mortality: results from a nationally representative prospective study of US adults. JAMA 279: 1703-1708.
- Williams RB (1998) Lower socioeconomic status and increased mortality: early childhood roots and the potential for successful interventions. JAMA 279: 1745-1746.
- Coyne JC, DeLongis A (1986) Going beyond social support: the role of social relationships in adaptation. J Consult Clin Psychol 54: 454-460.
- Kiecolt-Glaser JK, Newton TL (2001) Marriage and health: his and hers. Psychol Bull 127: 472-503.
- Cornelisse-Vermaat JR, Antonides G, van Ophem JAC, van Den Brink HM (2006) Body Mass Index, Perceived Health, and Happiness: Their Determinants and Structural Relationships. Soc Indic Res 79: 143-158.
- Barnett RC, Davidson H, Marshall NL (1991) Physical symptoms and the interplay of work and family roles. Health Psychol 10: 94-101.
- Ganong LH, Coleman M (1991) Remarriage and health. Res Nurs Health 14: 205-211.
- Medalie JH, Stange KC, Zyzanski SJ, Goldbourt U (1992) The importance of biopsychosocial factors in the development of duodenal ulcer in a cohort of middle-aged men. Am J Epidemiol 136: 1280-1287.
- Roth-Roemer S, Kurpius S (1996) Beyond marital status: An examination of marital quality and well-being among women with rheumatoid arthritis. Women’s Health: Research on Gender, Behavior and Policy 2: 195-205.
- Prigerson HG, Maciejewski PK, Rosenheck RA (1999) The effects of marital dissolution and marital quality on health and health service use among women. Med Care 37: 858-873.
- Booth A, Johnson D (1988) Premarital cohabitation and marital success. Journal of Family Issues 9: 255-272.
- Wilson CM, Oswald AJ (2005) How does marriage affect physical and psychological health? A survey of the longitudinal evidence. University of Warwick Press, UK.
- Cherlin AJ (1992) Marriage, divorce, remarriage. Harvard University Press, Cambridge, USA.
- English S, Feng D, Pearson S, Reifman A, Stelle C, et al. (2003) Marital quality over the life course: A hierarchical linear model of duration and cohort effects. The Gerontologist 43: 396-396.
- Gottman JM, Levenson RW (2002) A two-factor model for predicting when a couple will divorce: exploratory analyses using 14-year longitudinal data. Fam Process 41: 83-96.
- Guttmann J, Lazar A, (2004) Criteria for marital satisfaction: Does having a child make a difference? Journal of Reproductive and Infant Psychology 22: 147-155.
- Twenge JM, Campbell WK, Foster CA (2003) Parenthood and Marital Satisfaction: A Meta-Analytic Review. Journal of Marriage and Family 65: 574-583.
- Flegal KM, Carroll MD, Ogden CL, Johnson CL (2002) Prevalence and trends in obesity among US adults, 1999-2000. JAMA 288: 1723-1727.
- Liu RH, Wharton S, Sharma AM, Ardern CI, Kuk JL (2013) Difference in weight loss based on ethnicity, age and comorbidity status in a publicly funded adult weight management centre: 1-year results. Clinical Obesity 3: 21-31.
- Greene WH (2012) Econometric Analysis. (7thedn), Pearson Education, Boston, USA.
- Greene WH (2012) Econometric Analysis. (7thedn), Pearson Education, Boston, USA.
- de la Morena F, Santander C, Esteban C, de Cuenca B, García JA, et al. (2013) Usefulness of applying lidocaine in esophagogastroduodenoscopy performed under sedation with propofol. World J Gastrointest Endosc 5: 231-239.
- Silper BF, Madureira AM, Kaur M, Burnett TA, Cerri RL (2015) Short communication: Comparison of estrus characteristics in Holstein heifers by 2 activity monitoring systems. J Dairy Sci 98: 3158-3165.
- Center for Disease Control (2007) Statistics related to overweight and obesity. Retrieved on April 7, 2008.
- Santor DA, Coyne JC (1997) Shortening the CES-D to improve its ability to detect cases of depression. Psychological Assessment 9: 233-243.
- US Census Bureau (2015) Population Estimates. USA.
- Dehle C, Weiss RL (1998) Sex difference in prospective associations between marital quality and depressed mood. Journal of Marriage and the Family 60: 1002-1011.
- Schafer RB, Wickrama KAS, Keith PM (1998) Stress in marital interaction and change in depression: A longitudinal analysis. Journal of Family Issues 19: 578-594.
- Finkelstein EA, Brown DS, Evans WD (2008) Do obese persons comprehend their personal health risks? Am J Health Behav 32: 508-516.
- Williams DR (2002) Racial/ethnic variations in women’s health: the social embeddedness of health. Am J Public Health 92: 588-597.
Citation: Mokhtari M, Pollock ED (2015) Weight, Mental Health, Income and Marital Satisfaction: Evidence from the National Longitudinal Survey of Youth. J Obes Weight Loss 1: 001.
Copyright: © 2015 Manouchehr Mokhtari, et al. This is an open-access article distributed under the terms of the Creative Commons Attribution License, which permits unrestricted use, distribution, and reproduction in any medium, provided the original author and source are credited.
Journal Highlights
© 2026, Copyrights Herald Scholarly Open Access. All Rights Reserved!