A Phylogenetic Study among Portuguese Cattle Breeds Using Microsatellites
*Corresponding Author(s):
Mateus JCDepartamento De Zootecnia, Escola De Ciências Agrárias E Veterinárias , Universidade De Trás-os-Montes E Alto Douro, Vila Real, Portugal
Tel:+351 259350429,
Email:jmateus@utad.pt
Abstract
Genotype data from 30 microsatellites were used to assess the relationships among 12 native Portuguese cattle breeds and the Brazilian Caracú. Phylogenetic studies and calculation of genetic distances helped identify primary European and African evolutionary lineages of the Brown Concave and Red Convex cattle breeds. The Brown Concave cluster was supported by 100% and 91% of the bootstraps. The Red Convex group was established by 99% and 62% of the bootstraps performed. Another cluster with great statistical support established by the genetic distance tested in this work was the Barrosã and Cachena group. This cluster was supported by 99% of the bootstraps. However, the grouping of these two breeds with the other members of the Brown Concave group does not have large statistical support. In fact, the main genetic distances that separate these two breeds from Arouquesa, Marinhoa and Mirandesa (Brown Concave branch) were larger than the main genetic distances for the group formed by the Red Convex breeds of African origin. In this context, it can be admitted that the cattle corresponding to this group would have to be settled in the Iberia Peninsula probably during the long Moorish occupation or before that. However, the less robust results were obtained in the elucidation of the evolutionary process of the two breeds belonging to the Black Orthoid group. The greater genetic closeness found in the present work between the breeds of the Black Orthoid group and the Red Convex group can imply an African origin for the first evolutionary group.
Keywords
INTRODUCTION
The origins of cattle in Europe, particularly the Iberian Peninsula, can be traced to the Fertile Crescent [4-7]. Migrations of peoples through two main routes [8,9] share a common axis - The Mediterranean Sea. The northern route, also known as the route of the Danube [8] moved from Asia Minor towards the west and after crossing the Bosphorus into Central Europe and then went to the lake areas of Switzerland, the British Isles and the Iberian Peninsula. The other route, designated southern route or Mediterranean [8] is taking advantage of the same point of origin, headed west toward Egypt and travelled throughout North Africa along the Mediterranean coast having subsequently, reached the Iberian Peninsula and Europe after crossing the waters of the Strait of Gibraltar. We believe that the Portuguese cattle breeds are current representatives of these two migration routes. Thus, the evolutionary branches Brown Concave and Red Convex will be representatives of European and North African expansions, respectively [8,10,11,]. To confirm these origins, a study of mtDNA sequence polymorphisms clearly suggested a major influence of the African on the breeds of southern Portugal belonging to the Red Convex group [10,12]. The third and controversial evolutionary group, the Black Orthoid, was considered a direct descendant of ancient wild cattle (Bos taurus ibericus) that existed in the Iberian Peninsula before the arrival of other breeds [2]. Probably, this evolutionary branch has evolved from the long horns of Hamitic cattle domesticated and introduced by North African Berbers who invaded the Iberian Peninsula in prehistoric times [9,10,13]. The recent discovery of mtDNA haplotypes of African origin in several varieties of Spanish Fighting Bulls [14], and more recently in the Portuguese Brava de Lide [12] could substantiate this hypothesis. The main objectives of this work were to study the microevolutionary process of the Portuguese native cattle breeds and attempt to clarify the phylogenetic relationships between them.
MATERIAL AND METHODS
Animals
a) Choose exclusively animals registered in herd book of the breed;
b) Select animals in order to obtain a representative sample of the dispersion area of the breed;
c) Avoid any kind of relationship between animals selected at least until the third generation, and for that we used the information in the pedigrees provided by the respective breed associations;
d) Whenever possible we tried to maintain a ratio of 50% of males and 50% of females in the selected sample.
We also analysed a sample of 50 animals belonging to the Brazilian breed Caracú, descendant of Iberian cattle brought to Brazil by Portuguese settlers until the mid-sixteenth century. The inclusion of this breed which allowed us to analyse the genetic proximity between the Portuguese breeds and what is considered one of the few breeds descent of Iberian cattle living in Brazil [15]. Phylogeny studies (the utility had to serve as outgroup) enable phylogenetic trees with a common ancestral origin. Table 1 summarizes populations of samples under study.
|
Country |
Breed |
Breed Code |
Evolutionary Group |
DNA Samples |
||
|
? |
? |
Total |
||||
|
Portugal |
Alentejana |
ALT |
Red Convex |
26 |
24 |
50 |
|
Portugal |
Arouquesa |
ARQ |
Brown Concave |
24 |
26 |
50 |
|
Portugal |
Barrosá |
BRS |
Brown Concave |
27 |
23 |
50 |
|
Portugal |
Brava de Lide |
BRV |
Black Orthoid |
15 |
25 |
40 |
|
Portugal |
Cachena |
CCH |
Brown Concave |
10 |
40 |
50 |
|
Portugal |
Garvonesa |
GRV |
Red Convex |
2 |
28 |
30 |
|
Portugal |
Minhota |
MNT |
Red Convex |
25 |
25 |
50 |
|
Portugal |
Marinhoa |
MRH |
Brown Concave |
25 |
25 |
50 |
|
Portugal |
Mertolenga |
MRT |
Red Convex |
25 |
25 |
50 |
|
Portugal |
Maronesa |
MRN |
Black Orthoid |
23 |
27 |
50 |
|
Portugal |
Mirandesa |
MRD |
Brown Concave |
25 |
25 |
50 |
|
Portugal |
Ramo Grande |
RGD |
Red Convex |
4 |
11 |
15 |
|
Brasil |
Caracú |
CRC |
- |
- |
50 |
|
Microsatellites markers and PCR parameters
Data analysis
Multivariate analysis of correspondences
Phylogenetic analysis
The phylogenetic reconstruction between the populations studied was done from genetic distance DAproposed by Nei et al. [24]. The phylogenetic tree was constructed from the matrix of genetic distances according to the Neighbour-Joining algorithm [25] implemented in the program Populations [26]. The bootstrapping procedure described by Weir [27] was used to ascertain the robustness of the tree obtained. The tree was later viewed and edited for the text format using the program treeview [28]. After defining a priori groups of populations using information on geographical distribution, branches and evolutionary clusters obtained by the phylogenetic reconstruction, a hierarchical analysis of variance was carried out, which distributes the total variance into covariance components associated with differences inter-individual and / or inter-population. These components of covariance were then used to calculate fixation indices whose level of significance was tested by a non random permutations method described by Excoffier et al. [29]. This analysis was performed using AMOVA module implemented by the program ARLEQUIN [30].
RESULTS
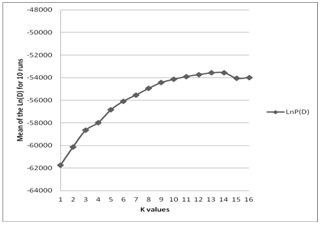 Figure 1: Average value of the LnP (D) for ten runs without information on the populations of the origins of animals.
In figure 2, we can observe the dispersion of breeds according to the first ree axes that explain this dispersion. Obviously, the first three axes explain 44.15% of the total inertia observed between the breeds. The first axis explains 19.56% of the total dispersion and separates the Caracú from the other Portuguese breeds. It was not surprising that the contribution of this breed to the total inertia explained by the first axis was 95.8% [31]. Conversely, the second axis explains 14.82% of the total inertia, clearly separates the Mirandesa Marinhoa from the other Portuguese breeds. The contribution of these two breeds to the total inertia explained by the second axis was 78.7% and 16.4%, [31] respectively, for Mirandesa and Marinhoa breeds. Finally, the third axis explains 9.77% of total dispersion observed between the study populations, clearly separated the breeds Cachena, Barrosã, Arouquesa from the breeds Minhota, Ramo Grande, Garvonesa, Alentejana and Mertolenga, while breeds Maronesa and Brava de Lide appeared to occupy an intermediate position between these two groups. The breeds that contributed most to the total inertia explained by this axis were the Alentejana and Garvonesa belonging to the Red Convex branch and breeds Barrosã and Cachena belonging to evolutionary Brown Concave group [31].
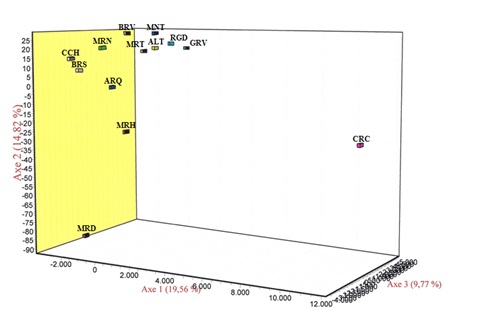 Figure 2: Dispersion of breeds according to the three principal axes defined by the factorial correspondence analysis.
|
ALT |
ARQ |
BRS |
BRV |
CRC |
GRV |
MNT |
MRH |
MRN |
MRT |
MRD |
CCH |
|
|
ALT |
||||||||||||
|
ARQ |
0,1302 |
|||||||||||
|
BRS |
0,1457 |
0,0989 |
||||||||||
|
BRV |
0,1819 |
0,1444 |
0,1687 |
|||||||||
|
CRC |
0,2505 |
0,2068 |
0,2374 |
0,2605 |
||||||||
|
GRV |
0,1166 |
0,1523 |
0,1758 |
0,1956 |
0,2493 |
|||||||
|
MNT |
0,1562 |
0,1153 |
0,1492 |
0,2004 |
0,2339 |
0,1698 |
||||||
|
MRH |
0,1576 |
0,1156 |
0,1539 |
0,1982 |
0,2573 |
0,1816 |
0,1598 |
|||||
|
MRN |
0,1456 |
0,1164 |
0,1289 |
0,1855 |
0,2373 |
0,1914 |
0,1635 |
0,1793 |
||||
|
MRT |
0,1117 |
0,1028 |
0,1218 |
0,1723 |
0,2111 |
0,1387 |
0,1228 |
0,1407 |
0,1298 |
|||
|
MRD |
0,2115 |
0,1392 |
0,1840 |
0,2553 |
0,2897 |
0,2353 |
0,2269 |
0,1267 |
0,2146 |
0,1987 |
||
|
CCH |
0,1504 |
0,0978 |
0,0794 |
0,1808 |
0,2327 |
0,1732 |
0,1298 |
0,1510 |
0,1363 |
0,1126 |
0,1918 |
|
|
RGV |
0,2086 |
0,1802 |
0,2304 |
0,2255 |
0,2677 |
0,2355 |
0,1855 |
0,2043 |
0,2009 |
0,1816 |
0,2874 |
0,2165 |
Figure 3 shows the phylogenetic tree constructed from genetic distance DA. Here, we can observe three clusters with high support of the 5000 bootstraps performed. One of these clusters was made by Barrosã and Cachena breeds with a support of 99% of bootstraps performed. The second cluster was formed by the Mirandesa, Marinhoa and Arouquesa breeds with 100% of bootstraps for the cluster formed by the first two breeds and 91% for the cluster of Arouquesa breed to the cluster formed by the other two breeds. The third cluster was established by the Alentejana, Garvonesa and Mertolenga breeds with 99% support for the cluster formed by the Alentejana and Garvonesa and 62% for the cluster of Mertolenga. Also worth mentioning is the relatively high support for the cluster obtained between the Minhota and Ramo Grande breeds (41% of bootstraps). Both the cluster of the Maronesa and Brava de Lide had reduced support from the bootstraps performed.
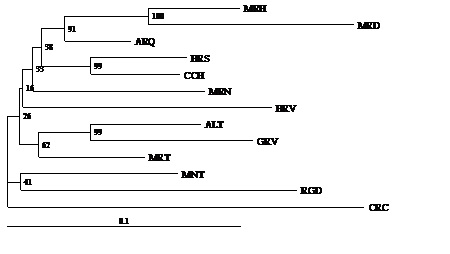 Figure 3: Dendrogram obtained for the populations under study by the Neighbour-Joining method applied to the DA genetic distance obtained from the allele frequencies of 30 microsatellites. The values in the clusters represent the percentage of 5000 bootstraps. The Caracu was used as outgroup.
Breeds were grouped in the tree according to the evolutionary groups they belong to. Thus, at the top of the tree we found the breeds belonging to evolutionary branch Brown Concave while at the bottom are breeds belonging to the Red Convex evolutionary group. Between these two main branches, we found representatives of both breeds belonging to the Black Orthoid evolutionary group.
It was interesting to see how populations have been separated as K increased. Thus for K = 2, the first populations to be separated from other populations were Mirandesa and Marinhoa (Figure 4A), which confirmed the genetic proximity of these two breeds, already cited in the present work. The outcome of runs for K = 3 was the separation of Caracú breed (Figure 4B) from the remaining populations. This breed remains as a single breed until the last tested value of K. In turn the last breeds to be separated are precisely the Barrosã and Cachena breeds, confirming their genetic identity. Note that when K = 12 (Figure 4C) breeds Barrosã and Cachena are grouped in the same cluster but for K = 13 (Figure 4D) they are separated for different clusters The most frequent result for K = 4 (Figure 4E) was the separation of the breeds belonging to the Red Convex evolutionary group from the remaining populations, which reinforced the theory of their common origin. The Black Orthoid evolutionary group were separated from other populations belonging to the Brown Concave evolutionary group for K = 5. It should be noted in figure 4F that the Maronesa and Brava de Lide breeds formed a cluster separated from the remaining populations, which is consistent with our proposal that these two breeds had a common origin. These breeds were finally separated for K = 6 (Figure 4G), keeping all other populations grouped as follows: Caracú isolated from the remaining breeds; the breeds of the Red Convex evolutionary branch grouped in the same cluster, and the breeds of the Brown Concave evolutionary group divided into two clusters the first constituted by a set that are more homogeneous and represented by the Mirandesa and Marinhoa breeds, the second comprised a more heterogeneous group which included the Arouquesa, Barrosã and Cachena breeds.
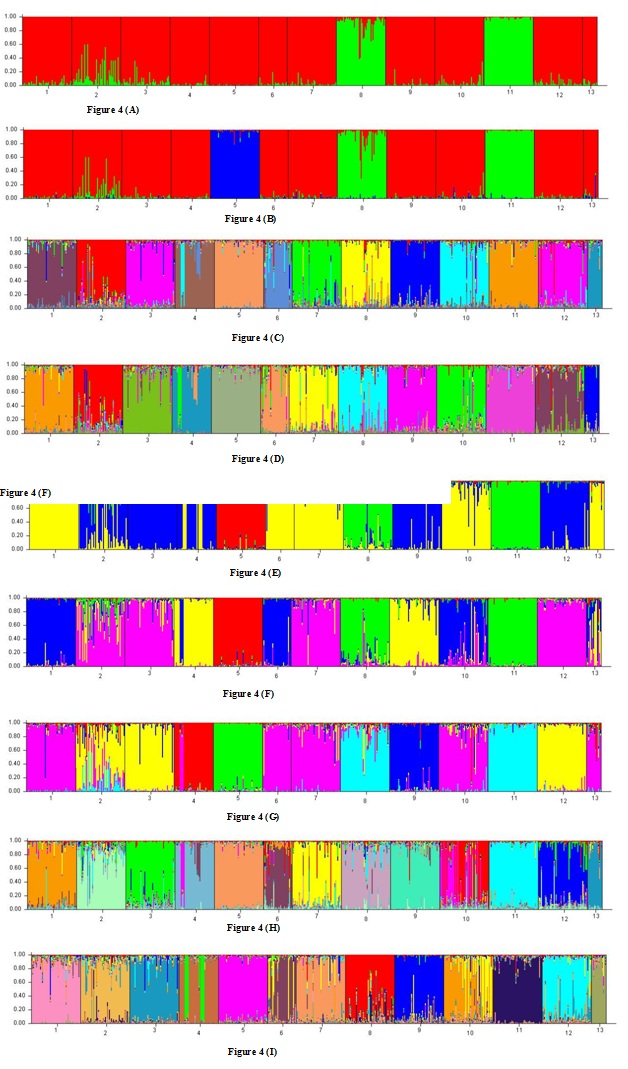 Figure 4: Clusters obtained for the various runs performed with the program structure: A) K = 2; B) K = 3, C) K = 12, D) K = 13, E) K = 4, F) K = 5, G) K = 6, H) K = 14, I) K = 15.
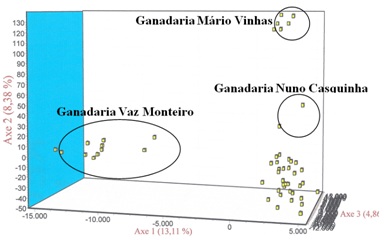 Figure 5: Distribution of animals from the Brava de Lide breed resulting from the factorial correspondence analysis performed only with the individuals of this population.
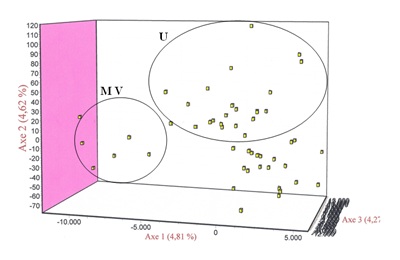 Figure 6: Distribution of animals from the breed Mertolenga resulting from the factorial correspondence analysiss made only with the individuals of this population. Note the tendency of animals of the variety Malhado de Vermelho (MV) have to move to the right side while the animals of ecotype Unicolor (U) tend to occupy the upper part of the space defined by the three main components of the AFC.
The values of variance analysis of the groups defined based on information known a priori are presented in table 3. The largest variation was obtained when the breeds were grouped taking into account the cluster obtained by phylogenetic reconstruction. For all the structures tested were obtained highly significant P values.
|
Structure |
Source of Variation |
% of Variation |
Fixation indexes |
|
Without Structure |
Among Populations |
8,34 |
FST = 0,08335 (P = 0,00000) |
|
Within Populations |
91,66 |
||
|
Geographical |
Among Groups |
1,71 |
FCT = 0,017101 (P = 0,00003) |
|
Among populations within groups |
7,26 |
FSC = 0,07383 (P = 0,00000) |
|
|
Within Populatons |
91,04 |
||
|
Morphology |
Among Groups |
2,44 |
FCT = 0,02440 (P = 0,00000) |
|
Among populations within groups |
6,27 |
FSC = 0,06427 (P = 0,00000) |
|
|
Within Populatons |
91,29 |
||
|
Cluster |
Among Groups |
2,94 |
FCT = 0,02939 (P = 0,00000) |
|
Among populations within groups |
5,67 |
FSC = 0,05843 (P = 0,00000) |
|
|
Within Populatons |
91,39 |
The following groups were formed. Geographical structure (Mirandesa, Maronesa, Barrosã, Arouquesa, Marinhoa, Minhota) (Fighting Bull, Mertolenga, Alentejana, Garvonesa) (Ramo Grande) (Caracu). Morphological structure (Mirandesa, Marinhoa, Arouquesa) (Barrosã, Cachena) (Maronesa, Fighting Bull), (Alentejana, Garvonesa, Mertolenga, Minhota, Ramo Grande), (Caracu). Clusters structure (Mirandesa, Marinhoa, Arouquesa) (Barrosã, Cachena) (Maronesa) (Fighting Bull) (Alentejana, Garvonesa, Mertolenga) (Minhota, Ramo Grande), (Caracu).
DISCUSSION AND CONCLUSION
The phylogenetic reconstruction, relatively high bootstraps values were obtained when compared with other phylogenetic studies performed with microsatellites [35-37]. Based on historical knowledge and morphological phylogenetic tree obtained with DA distance proved to be consistent with the expected relationships between the breeds studied, which confirmed the accuracy of this genetic distance in obtaining the correct topology, as shown by Takezaki and Nei [37,38]. Moreover, in this study, we were able to identify with considerable statistical support the two major evolutionary branches of Portuguese native cattle breeds to the corresponding European and African expansions, the groups Brown Concave and Red Convex respectively. In fact the tree obtained with DA genetic distance, the Brown Concave and Red Convex were clearly grouped. Within the group Brown Concave breeds Mirandesa Marinhoa were the closest pair and were grouped together with 100% of bootstraps performed. This result is consistent with historical details that describe the Marinhoa as a breed derived from Mirandesa probably crossed with Minhota breed, which was selected to work in heavy traction alluvial lands of the north coast of the country [10,40]. The bootstrap values for the cluster of Arouquesa breed to the other members of this group was high (91%). We also believe that the ecological dismemberment of Arouquesa within the group of breeds that make up the Brown Concave group has been before that the breakup of Marinhoa, having the animals of that breed arrived in Portugal in the form of domesticated animals, while the breakdown of the breed Marinhoa has occurred after the arrival of domesticated cattle to the Portuguese territory. All evidence of this study seems to indicate that the breed Mirandesa is the most ancient representative of this evolutionary branch. Notice the great separation of this breed from the remaining Portuguese breeds averaging 0.2065 for the genetic distance used in this study. Similar results were reported for this breed by Cañón et al. [41] and Ginja et al. [42]. Several aspects related to the history, culture, the morphology of the breed itself, and its production system can justify these result. The breed Mirandesa because of his corpulence - morphological type - (1st or 2nd among the Portuguese breeds) did not justify the crossing with other Portuguese breeds. Moreover, the people of Miranda (Mirandês) have always been very socially closed to outside influences as well as being conservative in its traditions. To understand this, just check that they were able to maintain their own language, the Mirandês, until today although the official language is Portuguese. Therefore, these social and anthropological aspects would obviously reflect in the animal production system, especially as regards the selection of a particular morphological type of animal and non introgression of animals of other breeds. Furthermore the fact that the Mirandesa breed have been the first to have a center for breeding and animal selection, to have recourse to Artificial Insemination (AI) besides having been one of the first breeds to establish a herd book in the Iberian Peninsula. All these aspects have contributed to the genetic isolation of this population relative to the others Portuguese breeds. The European origin of this evolutionary group may be compromised by having been found mtDNA haplotypes of African origin in Arouquesa and Mirandesa breeds [12], but the small number of animals with this haplotype leads us to conclude that they may have been acquired already here in Portugal through the Portuguese crosses with breeds of African origin (eg., Cachena, Barrosã, Alentejano).
Another cluster with high statistical support provided by the genetic distance tested in this study was the group formed by Barrosã and Cachena breeds. Indeed, this cluster was supported by 99% of bootstraps performed in this work. This cluster was probably the most anticipated, as the current population recognized as Cachena is in morphological and genetic terms, a variety of Barrosã [43]. The grouping of these two breeds with the other members of the Brown Concave branch didn’t have large statistical support (38% of the bootstraps performed). It is true that the majority of Portuguese authors advocate an African origin for the breeds Barrosã and Cachena [9,43-47]. In fact the average DA genetic distance that separated these two breeds from the breeds Arouquesa, Marinhoa and Mirandesa (Brown Concave branch) were higher than average genetic distances for the group formed by the branch of the Red Convex breeds of African origin (0.1462 vs 0.1448). In this context, it may be assumed that the cattle that correspond to this group have been installed in Iberia, probably during the long Arab occupation or prior to this [11,43]. Recently Ginja et al. [12], showed some frequency of mtDNA haplotype of African origin among these two breeds confirming its origin in North Africa. Therefore we propose the creation of a new evolutionary group; between the already existing for Portuguese cattle that includes only these two breeds and which we will designate Brown Concave with Very Long Horns.
The results obtained by phylogenetic reconstruction for Breeds that make up the Red Convex branch were less robust than the results obtained for the Brown Concave group. Breed Garvonesa was described as having been derived from Alentejana [10,48], therefore the grouping of these two breeds in the same cluster has been established for 99% of bootstraps for distance studied in this work. The breed Alentejana and the Spanish Retinta are considered the same breed and its genetic proximity was checked by Cañon et al., and Beja-Pereira et al. [1,40]. The breed Mertolenga consists of a very heterogeneous population of animals and will have had its origin in the breed Berrenda en Colorado of Andalucia subsequently suffered crossbreeding of Alentejana, Brava de Lide and Retinto [10]. In accordance with its origins, the breed is grouped with the breeds Alentejana and Garvonesa although statistical support for this cluster was lower (62%). The other two breeds of the branch Red Convex, the Minhota and Ramo Grande breeds were grouped together and this cluster was supported by 41% of bootstraps. Two theories can be advanced to explain this result: 1) The cattle breed Minhota may have actually been the origin of cattle Ramo Grande of Azores; note on the morphological similarities between these two populations of cattle or, 2) the successive crossbreeding that these breeds were subjected to throughout their history with yellow breeds of central Europe, notably the breed Gelbieh in the case of Minhota (Lenstra personal communication.; Machado, 2000)[48]) and Limousin in the case of Ramo Grande [49,50] may have allowed, as a result, the grouping of these two breeds. The morphological similarities found between these two breeds lead us to believe more in the first of these two theories.
The less robust results were obtained in the clarification of the evolutionary process of the two breeds belonging to evolutionary group Black Orthoid. These breeds have appeared in successive clusters on the tree established with the distance analyse in this work. In turn, the statistical support for his cluster was considerably lower. In morphological terms, breed Maronesa fits perfectly in the Black Orthoid evolutionary group [51]. The entry of blood from breeds Mirandesa and Barrosã may have occurred, especially so in geographical areas of dispersion where these two breeds coincide with the distribution area of Maronesa [43].
Regarding the origin of this evolutionary group all the evidence points to its probable origin in North Africa [10,12,14]. The recent discovery of mtDNA haplotypes of African origin in several varieties of Spanish Fighting Bull [14] and more recently among individuals of Portuguese breed Brava de Lide [12] seemed to support this theory. Indeed, the average DA genetic distances obtained between the Maronesa and Brava de Lide for groups of breeds that form the evolutionary group Brown Concave of European origin and breeds that make up the Red Convex evolutionary group of African origin, were 0.2380 and 0.2218, respectively. This greater genetic proximity between the breeds of Black Orthoid branch and Red Convex can also assume an African origin for the first evolutionary group.
For the analysis of molecular variance, all the tested structures showed a highly significant variance between the groups formed (Table 3), although the percentage of variance explained was minimal in the geographical structure and maximum when the structure was based on the groups formed by the clusters resulting from the phylogenetic reconstruction (1.71 vs. 2.94) (Table 3). Removing Minhota, a breed that belongs to evolutionary group Red Convex that characterizes the breeds of the south from the North group, we obtained a significant increase in the percentage change in the geographical structure (from 1.71 to 1.96 with a P = 0.00001) (result not showed). The percentage change showed an even more significant increase, indicating a value of 2.89 (P = 0.00001) (result not showed) when the breeds Maronesa and Brava de Lide respectively two breeds belonging to the evolutionary group Black Orthoid the first belonging to the northern group of breeds and the second to the Southern, were taken from geographical structure. These results demonstrated a great match with those obtained by phylogenetic analysis where the two main origins of Portuguese cattle were identified as well as with our expectations when we considered the Black Orthoid evolutionary branch as occupying an intermediate position between the Brown Concave and Red convex evolutionary branches.
As for Caracú, descended from Iberian cattle brought to Brazil by Portuguese settlers in the mid-fifteenth century, it doesn’t appear to be very close to Portuguese breeds. The average genetic distances between this breed and Portuguese breeds were 0.2445 for DA. Mateus et al. [16], showed that a population of Charolais from the USA was closest to Portuguese breeds that were Caracú. Geographic isolation for over 400 years and the entry of blood from other breeds can probably explain this divergence.
In conclusion, we can say that the results of work carried out with 30 microsatellites could identify with some robustness the main evolutionary branches existing among Portuguese cattle breeds. Furthermore, this analysis also uncovered subtle aspects related to the substructure of the populations, as demonstrated for the cases analyzed of the Brava de Lide and Mertolenga breeds. Indeed, the AFC confirmed the existing of a substructure between these two breeds. For the breed Brava Lide this substructure is consistent with his breeding system based on reproductive isolation made at the level of the bull farmers [32]. This was demonstrated by the four clusters formed by the AFC, one of which corresponded to what is considered by experts in bullfighting the most Portuguese of the Portuguese bull farmers, the ganadería Vaz Monteiro. Special attention should be given to animals of this ganadería if we do not want to miss a valuable genetic resource which is the true Portuguese Brava de Lide breed.
FUNDING
ACKNOWLEDGEMENT
REFERENCES
- Beja-Pereira A, Alexandrino P, Bessa I, Carretero Y, Dunner S, et al. (2003) Genetic Characterization of southwestern European bovine breeds: A historical and biogeographical reassessment with a set of 16 microsatellites. J Hered 94: 243-250.
- Sanchez-Belda A (1984) Razas bovinas Españo In: Publicaciones de Extensión Agraria, Madrid, Spain.
- Alves VC (2004) Evolução Filogenética dos Bovinos Autóctones Portugueses. Livro de Resumos das II Jornadas Técnicas de Raças Bovinas Autóctones, 5 e 6 de Maio de 2004, Escola Superior Agrária de Castelo Branco, Portugal.
- Loftus RT, Machugh DE, Bradley DG, Sharp PM, Cunningham P (1994) Evidence for two independent domestications of cattle. Proc Natl Acad Sci U S A 91: 2757-2761.
- Bradley DG, Machugh DE, Cunningham P (1996) Mitochondrial diversity and the origins of African and European cattle. Proceedings of the National Academy of Sciences of the U S A 93: 5131-5135.
- MacHugh DE, Shriver MD, Loftus RT, Cunningham P, Bradley DG (1997) Microsatellite DNA variation and the evolution, domestication and phylogeography of taurine and zebu cattle (Bos taurus and Bos indicus). Genetics 146: 1071-1086.
- Loftus RT, Ertrugrul O, Harba AH, El-barodys MA, Machugh DE, et al. (1999) A microsatellite survey of cattle from a centre of origin: The Near East. Mol Ecol 8: 2015-2022.
- Cymbron T, Freeman AR, Isabel Malheiro M, Vigne JD, Bradley DG (2005) Microsatellite diversity suggests different histories for mediterranean and northern european cattle populations. Proc Biol Sci 272: 1837-1843.
- Ginja C, Telo DA Gama L, Penedo MC (2009) Y chromosome haplotype analysis in Portuguese cattle breeds using SNPs and STRs. J Hered 100: 148-157.
- Felius M (1995) Cattle breeds-an encyclopedia. Doetinchem, Netherlands.
- Cymbron T, Loftus RT, Malheiro MI, Bradley DG (1999) Mitochondrial sequence variation suggests an african influence in Portuguese cattle. Proc Biol Sci 266: 597-603.
- Ginja C, Penedo MC, Melucci L, Quiroz J, Martínez López OR, et al. (2010) Origins and genetic diversity of New World Creole cattle: Inferences from mitochondrial and Y chromosome polymorphisms. Anim Genet 41: 128-141.
- Anderung C, Bouwman A, Persson P, Carretero JM, Ortega AI, et al. (2005) Prehistoric contacts over the Straits of Gibraltar indicated by genetic analysis of Iberian Bronze Age cattle. Proc Natl Acad Sci U S A 102: 8431-8435.
- Cortés O, Dunner S, García-Atance MA, García D, Cañón J (2007) Matrilíneas en la formación del ganado bovino de lidia. Arch Zootec 56: 397-402.
- Egito AA, Paiva SR, Albuquerque MSM, Mariante AS, Almeida lD, et al. (2007) Microsatellite based genetic diversity and relationships among ten Creole and commercial cattle breeds raised in Brazil. BMC Genetics 8: 83.
- Mateus JC, Penedo MC, Alves VC, Ramos M, Rangel-Figueiredo T (2004) Genetic diversity and differentiation in Portuguese cattle breeds using microsatellites. Anim Genet 35: 106-113.
- Benzécri JP (1973) Analyse des données. Tome 2: Analyse des correspondances, Dunod, Paris.
- Lebart L, Morineau A, Warwick KM (1984) Multivariate descriptive statistical analysis. Wiley, New York, USA.
- Guinand B (1996) Use of a multivariate model using allele frequency distributions to analyse patterns of genetic differentiation among populations. Biological Journal of the Linnean Society 58: 173-195.
- Laloë D, Moazami-Goudarzi K, Zafindrajaona PS (1999) Analyse des correspondances et biodiversité dans les races domestiques, Société française de biométrie, 20 Mai, Grenoble,
- Belkhir K, Borsa P, Goudet J, Chikhi L, Bonhomme F, et al. (1998) GENETIX, logiciel sous Windows TM pour la génétique des populations. Laboratoire Génome et Populations, CNRS UPR 9060, Université de Montpellier II, Montpellier, France.
- Pritchard JK, Stephens M, Donnelly P (2000) Inference of population structure using multilocus genotype data. Genetics 155: 945-959.
- Pritchard JK, Wen W (2003) Documentation for structure software: Ver¬sion 2.2.
- Nei M, Tajima F, Tateno Y (1983) Accuracy of estimated phylogenetic trees from molecular data. II. Gene frequency data. J Mol Evol 19: 153-170.
- Saitou N, Nei M (1987) The neighbor-joining method: A new method for reconstructing phylogenetic trees. Mol Biol Evol 4: 406-425.
- Langella O (2002) Populations - Logiciel de génétique des populations (distances entre individus ou populations, arbres phylogénétiques) - version 1.2.28.
- Weir BS (1996) Genetic data analysis II. Sinauer Associates, Sunderland, Massachusetts, USA, Pg no: 445.
- Page RD (1996) Treeview: An application to display phylogenetic trees on personal computers. Comput Appl Biosci 12: 357-358.
- Excoffier L, Smouse PE, Quattro JM (1992) Analysis of molecular variance inferred from metric distances among DNA haplotypes: Application to human mitochondrial DNA restriction data. Genetics 131: 479-491.
- Schneider S, Roessli D, Excoffier l (2000) Arlequin version 2.000. A software for population genetics data analysis. Genetics and Biometry Laboratory, University of Geneva, Switzerland.
- Mateus JC (2008) Estudo DA diversidade genética e filogenia das raças de bovinos autóctones Portuguesas. Universidade de Trás-os-Montes e Alto-Douro, Vila Real, Portugal.
- Mateus JC, Russo-Almeida PA (2014) Exploring the genetic diversity and substructure of the Portuguese cattle breed “Brava de Lide” using microsatellites. Animal Genetic Resources 55: 9-17.
- Pereira MC, Mercadante MEZ, Albuquerque LG, Razook AG (2005) Estimativa de ganho genético a partir de diferenciais de seleção e parâmetros populacionais em um rebanho caracú. R Bras Zootec 34: 2245-2252.
- Rouse JE (1977) The criollo, spanish Cattle in the americas. University of Oklahoma Press, Norman, USA.
- Cañón J, Checa ML, Carleos C, Vega-Pla JL, Dunner S, et al. (2000) The genetic structure of Spanish Celtic horse breeds inferred from microsatellite data. Animal Genetics 31: 39-48.
- Martínez AM, Delgado JV, Rodero A, Vega-Pla JL (2000) Genetic structure of the Iberian pig breed using microsatellites. Anim Genet 31: 295-301.
- Moazami-Goudarzi K, Laloë D, Furet JP, Grosclaude F (1997) Analysis of genetic relationships between 10 cattle breeds with 17 microsatellites. Animal genetics 28: 338-345.
- Takezaki N, Nei M (1996) Genetic distances and reconstruction of phylogenetic trees from microsatellites DNA. Genetics 144: 389-399.
- Takezaki N, Nei M (2008) Empirical tests of the reliability of phylogenetic trees constructed with microsatellite DNA. Genetics 178: 385-392.
- Santos P (2006) Raças autóctones de Portugal. A raça bovina Marinhoa. Caderno Técnico do Boletim Informativo DA Confederação Nacional de Agricultura.
- Cañón J, Alexandrino P, Bessa I, Carleos C, Carretero Y, et al. (2001) Genetic diversity measures of local European beef cattle breeds for conservation purposes. Genetics Selection Evolution 33: 311-332.
- Ginja C, Telo DA Gama L, Penedo MC (2010) Analysis of STR Markers Reveals High Genetic Structure in Portuguese Native Cattle. J Hered 101: 201-210.
- Leite JV (2004) Raça bovina Cachena. Livro de Resumos das II Jornadas Técnicas de Raças Bovinas Autóctones, 5 e 6 de Maio de 2004, Escola Superior Agrária de Castelo Branco, Castelo Branco, Portugal.
- Alves VC, Teixeira P (2004) Raça Bovina Maronesa. Livro de Resumos das II Jornadas Técnicas de Raças Bovinas Autóctones, 5 e 6 de Maio de 2004, Escola Superior Agrária de Castelo Branco, Castelo Branco, Portugal.
- Beja-Pereira A, Almeida NF (2001) Origem e história DA raça Barrosã. In: Raça Barrosã (ed.). AMIBA - Assiociação de Criadores DA Raça Barrosã, Braga, Portugal.
- Garcia MLG, Rosário JP, Antunes TM (1981) Raça bovina Barrosã. In: Bovinos em Portugal, Direcção Geral dos Serviços Veterinários. Lisboa, Portugal.
- Valle JM (1949) Gado Bissulco. In: Colecção a Terra e o Homem, Livraria Sá DA Costa, Lisboa.
- Lampreia A, Banza JA (2004) Raça bovina Garvonesa. Livro de Resumos das II Jornadas Técnicas de Raças Bovinas Autóctones, 5 e 6 de Maio de 2004, Escola Superior Agrária de Castelo Branco, Castelo Branco,
- Machado MA (2000) Galega/Minhota. In: Garcia JEY (ed.). Catálogo de razas autóctonas de Castilha y León (España)-Región Norte de Portugal. I: Especies bovina y equina. Fundação Rei Afonso Henriques, Serie monografias y estudios, Gráficas Varona, Salamanca, España. Pg no: 117-129.
- Cordeiro R (2008) A raça Ramo Grande. Conheça melhor esta raça. Revista o Jovem Agricultor, Ponta Delgada, Portugal.
- Pavão AL, Faria (2004) Raça bovina Ramo Grande. Livro de Resumos das II Jornadas Técnicas de Raças Bovinas Autóctones, 5 e 6 de Maio de 2004, Escola Superior Agrária de Castelo Branco, Castelo Branco, Portugal.
- Alves VC (2000) Maronesa. In: Garcia JEY (ed.). Catálogo de razas autóctonas de Castilha y León (España) - Región Norte de Portugal. I: Especies bovina y equina. Fundação Rei Afonso Henriques, Serie monografias y estudios, Gráficas Varona, Salamanca, Spain. Pg no: 103-116.
Citation: Mateus JC, Russo-Almeida P, Rangel-Figueiredo T (2018) A Phylogenetic Study among Portuguese Cattle Breeds Using Microsatellites. J Anim Res Vet Sci 2: 005.
Copyright: © 2018 Mateus JC, et al. This is an open-access article distributed under the terms of the Creative Commons Attribution License, which permits unrestricted use, distribution, and reproduction in any medium, provided the original author and source are credited.