Contamination Levels of Toxic Metals in Marketed Vegetable (Amaranthus Viridis) at Kinshasa, Democratic Republic of the Congo
*Corresponding Author(s):
John W PotéFaculty Of Science, Department Of Chemistry, University Of Kinshasa, Kinshasa XI, Congo, The Democratic Republic Of The
Tel:+41 223790321,
Email:john.pote@unige.ch
Abstract
Graphical Abstract
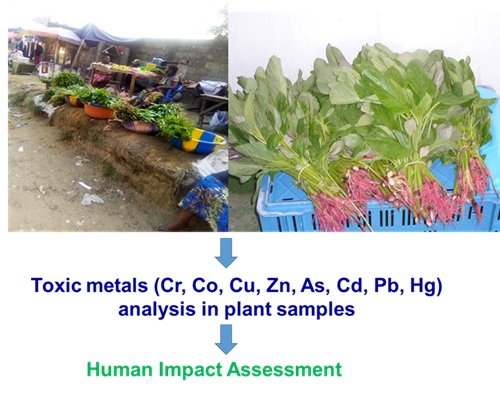
The contamination of food chain by toxic metals constitutes a major concern worldwide because of human health potential risks. Amaranthus viridis (A. viridis) is one of the most consumed vegetables in South Asian and Sub-Saharan African countries. However, the accumulation of pollutants, such as toxic metals in this plant is still little investigated. Consequently, this research investigates the level of toxic metals in A. viridis collected from four major markets of Kinshasa, Capital City of the Democratic Republic of the Congo, according to the seasonal variation in order to determine potential health risk for the consumers. The results revealed high metal concentrations in edible leaf vegetables during both dry and wet seasons. Metal concentration reaching the values (in mg kg-1) of 3.6(Cr), 1.5(Co), 29.7(Cu), 348.2(Zn), 1.7(As), 1.5(Cd), 18.3(Pb) and 0.2(Hg). Except for Cu, the analyzed metal concentrations in leafy vegetables exceeded the permissible levels set by Food and Agriculture Organization/World Health Organization (FAO/WHO) for human consumption. Given the level of toxic metals in A. viridis leaf according to the regulation of FAO/WHO, human health consequences are likely to occur on continuous vegetable consumption. Our results recommend implementation of measures and efforts to improve the quality of this most consumed vegetable in order to minimize potential health risk for the consumers.
Keywords
Amaranthus viridis; Food analysis; Food consumption; Food quality; Human health risk assessment; Toxic metals; Vegetable contamination
INTRODUCTION
The vegetable is an essential part of the healthy human diet considered as a source of many vital nutrients to maintain normal physiological functions, antioxidants, dietary fiber metabolites and prevention of several diseases [1-3]. Vegetables also attract a wide range of pests and are affected by diseases, and therefore need intensive pest management [4-6]. Toxic metals can be accumulated in vegetables and transferred to humans through food consumption, leading to potential human-associated health risks. Therefore, the impact of contamination of vegetable by toxic metals has been intensively and worldly investigated by several researches. Many studies have been performed to assess the accumulation of organic and inorganic pollutants in different edible vegetable species because of their importance in the human diet for the prevention of consumer risks [7-11]. Toxic metal accumulation occurs mostly in edible parts of plants such as leaf and root, which may finally result in a reduction of crop quality and present a threat for human and animal health. Consumption of foodstuffs contaminated by toxic metals leads to their accumulation in the human body. It can cause several diseases including cancer, anaemia, infertility to males, cardiovascular, nervous, kidney and lung disease [5,6,12,13]. Even at low concentration, the consumption of vegetable contaminated by toxic metals can originate potentially health-threatening effects [6,14]. It is therefore crucial and recommended to consume non-contaminated vegetable by organic pollutants and toxic metals to avoid the potential human health risks.
Amaranthus sp. have significant colorific value, contain high mineral levels and important sources of copper, iron, zinc phosphorus, manganese, magnesium, and vitamin C [15,16]. The plants are mainly cultivated in peri-urban market gardening under tropical conditions (south of Asian and sub-Saharan African countries) in the field potentially contaminated by heavy metals [3,17-21]. Many of these studies demonstrated the potential of toxic metal accumulation in Amaranthus sp. and recommended further studies to assess the toxic metal levels linked to the consumption of part of the plant and over vegetables cultivated in urban areas of developing countries under tropical conditions to prevent potential health exposures to consumers. For instance, due to inadequate infrastructure in wastewater treatment facilities in developing countries and the use of urban wastewaters for vegetables growth in urban regions, toxic metal concentrations in urban vegetables are generally higher than WHO recommended levels [6,22].
Kinshasa is the capital and largest city of the Democratic Republic of the Congo, with an estimated population of about 13 million inhabitants and covering 9’965 km².For such high population density, the urban agriculture plays a central economic and socioeconomic development role in the daily life of the population and assures more than 70% of consumed fresh foodstuffs supply of the city. After cassava leaf, A. viridis has been identified to be a second most consumed leaf vegetable in the DRC [2].The agriculture is mainly performed in the urban municipalities in many cases along the rivers (watersheds) and near the heavily busy roads [19]. Worryingly, the use of urban wastewaters in irrigation is common in the vicinity of Kinshasa. Contaminated agricultural soil and atmospheric depositions significantly contribute to the accumulation of toxic metals in vegetables [9,23-26].To our best knowledge, studies on toxic metal contamination of vegetables commercialized in different Kinshasa markets has not been reported so far. Consequently, the aim of the present work is to determine the levels of toxic metals including Cr, Co, Cu, Zn, As, Cd, Pb and Hg in A. viridus leaves from 4 main vegetable markets of Kinshasa City. The evaluation of human health risks was performed by comparing the metal concentrations in A. viridis with the permissible levels for human consumption set by Food and Agriculture Organization and World Health Organization [27].
MATERIALS AND METHODS
Study site and sampling procedure
This study was carried out in four main vegetable markets located in different municipalities of Kinshasa, the capital city of the Democratic Republic of the Congo (Figure 1). These randomly chosen markets, arbitrary named A, B, C and D, are major central distribution points (Figure 2 (A,B)) of vegetables produced in Kinshasa and surrounding provinces (Kongo Central, Kwilu, Kwango and Mai-Ndombe). The A. viridis sold in these markets are mainly produced in several gardening markets located in peri-urban areas of great towns.
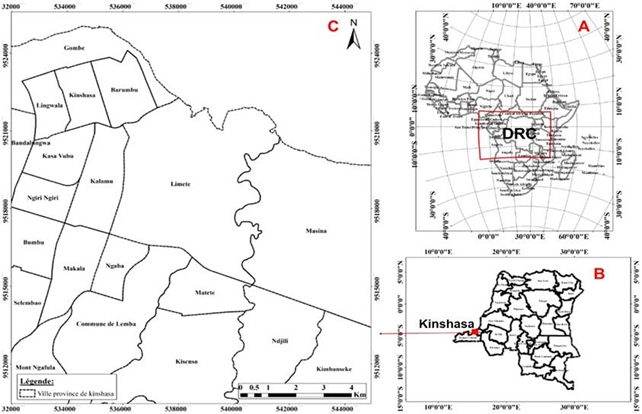 Figure 1: Adapted map showing: A: Location of the Democratic Republic of the Congo (DRC) in Africa continental map; B: Location of Kinshasa City in the Democratic Republic of the Congo and C: The municipalities of Kinshasa (which are located investigated markets).
 Figure 2: Photos taken by Georgette Ngweme in February 2019, indicating; 2 (A,B): Amaranthus viridis in sale at Market B, 2 (B,C): Amaranthus viridis samples from Markets A and B, respectively.
The sampling took place in February 2019 (wet season) and August 2019 (dry season). For each market and during each season, samples were taken in triplicate from 3 randomly selected sellers (e.g. Figure 2 (C,D)). Each replicate consisted in about 500g of leafy vegetables homogenized to form a composite sample. After collection, samples were stored in an icebox and transported to the laboratory within 24h. After preliminary treatments (washing with deionized water and weighted),samples were frozen and sent to the Department F.-A. Forel (University of Geneva, Switzerland) for analysis.
Digestion of plant samples
The digestion of leafy vegetables was performed as described by Larras et al. [28]. Briefly, plant samples were washed with deionized water, lyophilized for 12 hours (water content was calculated)weighted and ground with liquid nitrogen. About 0.5g of ground plant samples were digested with 8mL of HNO3 (65%, Suprapur®, Merck KGaA, Darmstadt Germany) and 2mL of H2O2 (30%, Merck KGaA, Darmstadt Germany) for 16h at 105°C. The supernatant was centrifuged at 20oC during 15 minutes at 4000rpm anddiluted 50 times with 1% HNO3 (Suprapur®, Merck KGaA, Darmstadt Germany) for ICP-MS analysis.
Metals analysis in plant samples by ICP-MS
The concentration of toxic metals(Cr, Co, Ni, Cu, Zn, As, Cd, and Pb) in digested plant samples were measured by ICP-MS (Agilent, model 7700 series, Santa Clara, CA, USA). A collision/reaction cell and interference equations were performed for the correction of spectral interferences. The ICP multi-element standard solution Merck IV, 1000mgL−1 (Merck IV, KGaA, Darmstadt Germany) was used for the preparation of calibration solution at different concentrations (0, 0.2, 1, 5, 10, 20, 50 and 100μgL−1). The Arsenic (As) was prepared from a mono element solution 1000mgL−1 (Merck KGaA, Darmstadt Germany). Metal concentrations in plant samples were expressed in mgkg-1 dry weight.
Mercury analysis in plant samples
The analysis of Hg in plant samples was performed using the Atomic Absorption Spectrophotometer for mercury determination (Advanced Mercury Analyser (AMA 254, Altecs.r.l.) Czech Rep.) as previously described by Larras et al. [28] and Roos-Barraclough et al. [29]. The limit of detection (3 x SD blank) was 0.005mgkg-1 and the reproducibility better than 3%. The Hg concentration is expressed in mgkg-1 of dry weight.
Quality control and statistical analysis
The accuracy of the method was checked by analysis of the certified reference material (CRM-482, EU Commission-JRC, Geel, Belgium), prepared and analyzed in the same conditions as the plant samples, for both ICP-MS and AMA analyses. Statistical treatment of data (ANOVA followed to Bartlett’s Test and in case of non-applicability, Kruskal-Wallis test) has been realized using Epi Info version 3.5.4 in order to compare the averages concentrations between metal species. The Pearson correlation was performed using SPSS Statistics version 20.
RESULTS AND DISCUSSION
Quality control and certified reference material values of metal concentrations
For ICP-MS analysis, the Limit of Detection (LOD) was calculated as 3 times standard deviation of the blanks and was less than 0.001μgL−1 for all analyzed elements. The total variation coefficients of triplicate sample measurements were below 2% and chemical blanks for the procedure were less than 1% of the sample signals. The obtained values of analyzed metals by ICP-MS and AMA for the reference material CRM-482 were in the certified range. The results are reported in table 1. The recovery values ranged from 91.1 to 98.3% for ICP-MS analysis and 95.8% for Hg analysis by AMA. The good recoveries of metal concentrations from certified reference material CRM-482 demonstrated the precision of the used protocol for leafy vegetables analysis.
|
Metal |
Certified Value |
Measured Value (n=3) |
Recovery (%) |
|
Cr |
4.12±0.15 |
3.85±0.30 |
93.44 |
|
Ni |
2.47±0.07 |
2.26±0.51 |
91.49 |
|
Cu |
7.03±0.19 |
6.91±1.04 |
98.29 |
|
Zn |
100.6±2.0 |
96.80±4.63 |
96.22 |
|
As |
0.85±0.07 |
0.78±0.09 |
91.76 |
|
Cd |
0.56±0.02 |
0.51±0.06 |
91.07 |
|
Pb |
40.9±1.40 |
38.7±0.34 |
94.62 |
|
Hg |
0.48±0.06 |
0.46±0.03 |
95.83 |
Table 1: Certified and observed values of metal concentrations of reference material CRM-482 (in mgkg-1 dry weight).
Metal concentration in leafy vegetables
The toxic metals (Cr, Co, Cu, Zn, As, Cd, Pb and Hg) concentrations in A. viridis are shown in table 2. Metal levels in A. viridis were compared with international regulation for human consumption set by the Food and Agriculture Organization and World Health Organization [27], in order to evaluate consumer human health risks (Figure 3). Except for Cu, metal concentrations from all investigated markets exceeded the maximum level recommended by Joint FAO/WHO Expert Committee on Food Additives (Figure 2 (A,B)) [27]. The toxic metals concentration in leafy vegetables was found to be varied significantly according to sampling sites and seasonal variation (p < 0.05). According to the PCA, season were responsible of quantity variations (Figure 4A) whereas sampling sites, where responsible of quality variations of leafy metal contamination (Figure 4B). These differences in A.virdis contamination could be attributed to the continuous use of untreated urban wastewaters in irrigation from nearby canals and drains and their intrinsic characteristics .In general, metal levels in leaves during the dry season were higher than during the wet season. Taking all markets and season together, the relative order of average concentrations of analyzed toxic metals in A. viridis leaves was: Zn>Cu>Pb>Cr>As>Cd>Co>Hg. Similarly, in a previous study the same tendency was observed in Amaranthus Hybridusin [18]. Maximum concentration for all metals was observed in the leafy vegetables from Market D during the dry season, with values (in mgkg-1) of 348.2 (Zn), 29.7 (Cu), 18.3 (Pb), 3.4 (Cr), 1.7 (As), 1.6 (Cd), 1.5 (Co) and 0.19 (Hg). According to our short survey, more than 80% of A. viridis sold in this market are produced in two main gardening markets located near heavily trafficked roads and use many pesticides, fertilizers and highly contaminated water for irrigation to produce A. viridis [30,31]. Emissions from the heavy traffic on roads contain toxic metals including Pb, Cd, Zn and Ni which are present in the fuel as anti-knock agents and susceptible to contaminate the vegetables [32,33]. The use of wastewater, pesticide and micronutrient fertilizers in agriculture can be considered as one of the main sources of vegetable contamination by toxic metals [8,9,34,35].
|
Market A |
|
Cr |
Co |
Cu |
Zn |
As |
Cd |
Pb |
Hg |
||||||||
|
|
ppm |
±SD |
ppm |
±SD |
ppm |
±SD |
ppm |
±SD |
ppm |
±SD |
ppm |
±SD |
ppm |
±SD |
ppm |
±SD |
|
|
A1 |
2.12 |
0.71 |
1.01 |
0.30 |
9.23 |
3.91 |
133.23 |
29.31 |
0.62 |
0.09 |
0.64 |
0.08 |
3.34 |
0.70 |
0.03 |
0.01 |
|
|
A2 |
0.38 |
0.13 |
0.22 |
0.05 |
8.35 |
2.67 |
165.58 |
36.43 |
0.89 |
0.13 |
0.45 |
0.06 |
6.34 |
1.33 |
0.05 |
0.02 |
|
|
A3 |
1.93 |
0.55 |
0.18 |
0.04 |
1.46 |
0.31 |
99.57 |
21.91 |
0.37 |
0.06 |
0.55 |
0.07 |
1.76 |
0.58 |
0.03 |
0.01 |
|
|
A4 |
3.57 |
0.91 |
1.32 |
0.07 |
9.98 |
2.55 |
216.32 |
47.59 |
1.03 |
0.15 |
0.86 |
0.11 |
9.28 |
1.95 |
0.08 |
0.03 |
|
|
A5 |
2.44 |
0.84 |
1.28 |
0.06 |
11.5 |
3.68 |
194.48 |
42.79 |
0.98 |
0.15 |
0.92 |
0.13 |
8.15 |
1.71 |
0.06 |
0.02 |
|
|
A6 |
3.17 |
0.65 |
1.3 |
0.08 |
12.3 |
2.50 |
186.21 |
34.20 |
1.07 |
0.11 |
0.78 |
0.17 |
11.04 |
2.03 |
0.09 |
0.02 |
|
|
Market B |
B1 |
0.77 |
0.48 |
0.19 |
0.04 |
7.76 |
2.48 |
163.87 |
36.05 |
0.24 |
0.11 |
0.37 |
0.05 |
4.98 |
1.05 |
0.02 |
0.01 |
|
B2 |
2.41 |
0.65 |
0.17 |
0.25 |
12.38 |
3.96 |
88.56 |
19.48 |
1.22 |
0.18 |
0.44 |
0.05 |
7.14 |
1.50 |
0.04 |
0.01 |
|
|
B3 |
0.96 |
0.26 |
0.33 |
0.08 |
13.42 |
4.29 |
154.56 |
34.00 |
0.85 |
0.13 |
0.76 |
0.09 |
2.68 |
0.56 |
0.01 |
0.00 |
|
|
B4 |
2.82 |
0.49 |
1.27 |
0.06 |
15.75 |
2.80 |
209.61 |
46.11 |
1.33 |
0.20 |
1.04 |
0.13 |
12.34 |
2.59 |
0.07 |
0.02 |
|
|
B5 |
2.53 |
0.68 |
1.35 |
0.08 |
14.73 |
4.71 |
215.45 |
47.40 |
1.41 |
0.21 |
0.94 |
0.12 |
11.26 |
2.36 |
0.06 |
0.02 |
|
|
B6 |
2.64 |
0.78 |
1.33 |
0.04 |
15.28 |
3.16 |
241.62 |
38.74 |
1.28 |
0.15 |
1.12 |
0.14 |
10.75 |
1.95 |
0.09 |
0.03 |
|
|
Market C |
C1 |
1.34 |
0.36 |
0.42 |
0.10 |
6.44 |
2.06 |
123.74 |
27.22 |
0.76 |
0.11 |
0.35 |
0.04 |
6.22 |
1.31 |
0.03 |
0.01 |
|
C2 |
0.23 |
0.11 |
0.24 |
0.06 |
9.75 |
3.12 |
174.27 |
38.34 |
1.17 |
0.18 |
0.46 |
0.06 |
2.74 |
1.21 |
0.01 |
0.00 |
|
|
C3 |
0.86 |
0.23 |
0.51 |
0.12 |
10.27 |
3.29 |
154.42 |
33.97 |
0.92 |
0.14 |
0.42 |
0.05 |
3.91 |
0.82 |
0.04 |
0.01 |
|
|
C4 |
2.11 |
0.57 |
0.56 |
0.06 |
13.67 |
4.37 |
234.61 |
51.61 |
1.23 |
0.18 |
0.94 |
0.12 |
15.22 |
3.20 |
0.09 |
0.03 |
|
|
C5 |
2.47 |
0.40 |
0.67 |
0.11 |
19.41 |
3.01 |
255.17 |
56.14 |
1.42 |
0.21 |
0.78 |
0.10 |
8.23 |
1.94 |
0.07 |
0.02 |
|
|
C6 |
2.41 |
0.28 |
0.59 |
0.05 |
14.36 |
2.32 |
196.28 |
32.82 |
1.33 |
0.18 |
0.84 |
0.16 |
14.77 |
2.38 |
0.09 |
0.02 |
|
|
Market D |
D1 |
2.12 |
0.84 |
0.32 |
0.07 |
24.57 |
7.86 |
135.32 |
29.77 |
1.25 |
0.19 |
0.87 |
0.11 |
7.88 |
1.65 |
0.08 |
0.03 |
|
D2 |
1.41 |
0.92 |
1.16 |
0.40 |
15.22 |
3.99 |
221.45 |
48.72 |
0.96 |
0.14 |
0.72 |
0.09 |
3.87 |
1.07 |
0.06 |
0.02 |
|
|
D3 |
2.22 |
0.60 |
1.13 |
0.26 |
25.17 |
8.05 |
222.46 |
48.94 |
1.34 |
0.20 |
0.88 |
0.11 |
8.52 |
1.79 |
0.04 |
0.01 |
|
|
D4 |
3.43 |
0.39 |
1.25 |
0.06 |
29.73 |
6.31 |
348.23 |
76.61 |
1.58 |
0.24 |
1.56 |
0.19 |
14.37 |
3.02 |
0.12 |
0.04 |
|
|
D5 |
2.37 |
0.64 |
1.49 |
0.11 |
25.29 |
4.89 |
316.62 |
69.66 |
1.74 |
0.26 |
1.35 |
0.17 |
18.28 |
3.84 |
0.09 |
0.03 |
|
|
D6 |
2.61 |
0.85 |
1.38 |
0.28 |
27.63 |
3.73 |
258.47 |
34.83 |
1.62 |
0.33 |
1.45 |
0.65 |
17.24 |
2.68 |
0.19 |
0.09 |
|
Table 2: Toxic metal concentrations (ppm: mgkg-1 dry weight) in A. viridis leaves from 4 markets.
Note: A1-A3 and A4-A6: Sampling from market A during the wet and dry season respectively.
B1-B3 and B4-B6: Sampling from market B during the wet and dry season respectively.
C1-C3 and C4-C6: Sampling from market C during the wet and dry season respectively.
D1-D3 and D4-D6: Sampling from market D during the wet and dry season respectively.
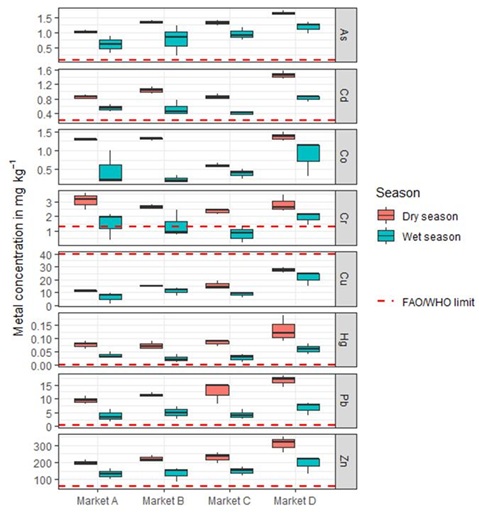 Figure 3: The concentration of analyzed toxic metals in Amaranthus viridis from four investigated markets comparing to regulation for human consumption set by the Food and Agriculture Organization (FAO) and World Health Organization (WHO).
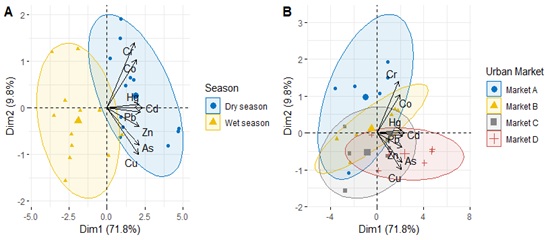 Figure 4: PCA analysis of analyzed metals in Amaranthus viridis according to season (4A) and urban markets (4B).
Significant variation (p<0.05) of Zn, Pb, Cd and As concentrations were observed in leafy vegetables with the values (in mgkg-1) ranged between 88.6-348.2, 1.8-18.3, 0.24-1.7 and 0.4-16 for Zn, Pb, As and Cd, respectively. These values are about 1.5 to 5.8, 3.0 to 61.0, 2.4 to 17 and 2-8 higher than that of the FAO/WHO maximum permissible level for Zn (60 mgkg-1), Pb (0.3 mgkg-1), As (0.1) and Cd (0.2), respectively (Figure 3). The values of Zn observed in this study were higher than the values of 78.45±7.48mgkg-1 reported by Islam et al. [20], in A. viridis produced in Dhaka city, Bangladesh. However, the concentration of Pb and Cd obtained in leafy vegetables of this research was lower than 68 to 152mgkg-1 and 0.5 to 4.9, respectively reported by Atayese et al. [33], in A. viridis produced along major highways in Lagos, Nigeria. Concerning Pb, As and Cd, concentrations where higher than those found by Islam et al. [20], who reported the values of 2.54±0.56, 0.19±0.04, 0.15±0.03mgkg-1 for Pb, As and Cd, respectively in A. viridis but lower than those reported by Azi et al. [3], in A. viridis grown in Abakaliki, Nigeria (i.e. 8.2-12.0, 6.4-8.5 and 0.8-0.9 for Pb, As and Cd, respectively).
The concentration of Cr in leafy vegetables from investigated markets exceeded the permissible levels for human consumption set by FAO/WHO of 1.3mgkg-1 during the dry season. Except for the market D, the Cr values during wet season were within the recommended maximum acceptable levels proposed by FAO/WHO. The values (in mgkg-1) ranged from 0.2-2.2 and 2.1-3.4 in the wet and dry season, respectively. The level of Cr in this study was higher than 0.1mgkg-1 reported by Azi et al. [3] and similar to that reported by Islam et al. [20], with the value of 2.28±0.6mgkg-1.
Even at low concentration, Hg is very dangerous to humans because of its extreme toxicity and ability for biomagnification and bioaccumulation in food chains [36,37]. The Hg concentration obtained in this investigation ranged between 0.01 and 0.19mgkg-1. These values exceeded 10 to 190 times than the permissible levels for human consumption set by FAO/WHO of 0.001mgkg-1 (1µgkg-1). Despite, the Hg levels are lower than 3.8-14.0mgkg-1 in A. viridis leaves as reported by Azi et al. [3]. Our present results were concordant with the range values of 0.003-0.046mgkg-1 obtained by Li et al. [37], in Amaranth leaves.
The concentration of Cu in A. viridis leaves for all samples ranged between 1.5 and 29.7mgkg-1. These values are under the permissible levels for human consumption set by FAO/WHO of 40mgkg-1 (Figure 3). The Cu values observed in this study is similar to that observed by Islam et al. [20] and lower than 123.5mgkg-1 as reported by Chabukdhara et al. [25]. The Co concentration ranged from 0.18-1.5mgkg-1. These values are under the permissible levels for human consumption, according to the value of 50mgkg-1, reported by Chiroma et al. [38].
The cultivation of A. viridis in DRC is mainly performed in the peri-urban municipalities, in many cases alongside rivers and/or heavily trafficked roads [19]. The agricultural activities including, frequent use of pesticides, fungicides fertilizers which contain metals as a natural impurity [35,39]. Additionally, in many cases, urban agriculture is using the contaminated water for irrigation [31,40-43]. These aspects can be considered as main sources of leafy vegetables contamination by toxic metals.
Metal correlation in leafy vegetables
Metal correlation in leafy vegetables was analyzed by PCA (Figure 4). Pearson correlation analysis showed a strong and positive correlation between As and Cu (r=0.81, p<0.001) and Hg, Cd and Pb (r>0.80, p<0.001), indicating their common source and transport pathway from agricultural practices and road traffic deposition respectively.
In leafy samples from the market D, where peri-urban gardens are known to be affected by heavily trafficked roads. The concentrations of Cr, Cu, Cd and Pb were significantly correlated, indicating the impact of traffic. Cd had a stronger positive correlation with Pb (r=0.92, p < 0.001) (Table 3), implying road traffic deposition on the surrounding environment and subsequent accumulation on plants. There was a significant correlation observed between Co and Zn, suggesting that that application of chemical fertilizers and its impact on the leafy vegetable.
|
Cr |
Co |
Cu |
Zn |
As |
Cd |
Pb |
Hg |
|
|
Cr |
1.00 |
0.26 |
0.92* |
0.66 |
0.75 |
0.86* |
0.69 |
0.54 |
|
Co |
|
1.00 |
0.13 |
0.82* |
0.51 |
0.56 |
0.58 |
0.33 |
|
Cu |
|
|
1.00 |
0.44 |
0.82* |
0.79 |
0.74 |
0.54 |
|
Zn |
|
|
|
1.00 |
0.67 |
0.79 |
0.68 |
0.35 |
|
As |
|
|
|
|
1.00 |
0.90* |
0.98** |
0.58 |
|
Cd |
|
|
|
|
|
1.00 |
0.92** |
0.77 |
|
Pb |
|
|
|
|
|
|
1.00 |
0.69 |
|
Hg |
|
|
|
|
|
|
1.00 |
Table 3: Pearson correlation matrix of toxic metals content in A. viridis leaves from market A.
Note: *Correlation is significant at the 0.05 level.
**Correlation is significant at the 0.01 level.
CONCLUSION
The present research constitutes the first assessment of toxic metals in A. Viridus selling in Kinshasa markets. The leafy vegetables contain the high values of most investigated toxic metals. Our results demonstrated that, except Cu, the toxic metals including Cr, Co, Zn, As, Cd, Pb and Hg present the values which were several folds higher than the international regulation for human consumption set by the Food and Agriculture Organization (FAO) and World Health Organization (WHO). Such elevated levels of toxic metals in A.virdis could cause a potential impact on human health on regular consumption. The accumulation of toxic metals could be due to the use of contaminated irrigation water, chemicals used to combat and prevent vegetable diseases, and the vehicle and motorcycle emissions around crop fields. Therefore, this study warrants proper control measures to prevent the sources of the metals into the irrigation water. Correlation analysis indicated that combined sources, including wastewater from channels, fertilizer application, and atmospheric deposition, are identified as sources of toxic metals. Finally, our research heavily recommends further studies for the assessment of toxic metals and other micro pollutants in vegetables, fruits and cereals selling in different markets of Kinshasa, identify the sources of contamination and comprehensive evaluation of consumer human health risks.
ACKNOWLEDGMENT
We are grateful to financial support from the Forel Department to Georgette Ngweme during her training at University of Geneva and the Open Access Publication Funds of University of Geneva.
COMPLIANCE WITH ETHICAL STANDARDS
We confirm that the field studies did not involve endangered and protected species. The funders had no role in study design, data collection and analysis, decision to publish, or preparation of the manuscript.
CONFLICT OF INTEREST
The authors declare no conflict of interest.
REFERENCES
- Boeing H, Bechthold A, Bub A, Ellinger S, Haller D, et al. (2012) Critical review: Vegetables and fruit in the prevention of chronic diseases. Eur J Nutr 51: 637-663.
- FAO Horticulture feeds Democratic Republic of Congo cities.
- Azi F, Odo MO, Okorie PA, Njoku HA, Nwobasi VN, et al. (2018) Heavy metal and microbial safety assessment of raw and cooked pumpkin and Amaranthus viridis leaves grown in Abakaliki, Nigeria. Food Sci Nutr 6: 1537-1544.
- Dinham B (2003) Growing vegetables in developing countries for local urban populations and export markets: Problems confronting small-scale producers. Pest Manag Sci 59: 575-582.
- WHO/FAO (2003) Diet nutrition and the prevention of chronic diseases: Report of a joint WHO/FAO expert consultation, WHO Technical Report Series, No. 916 (TRS 916). WHO, Geneva, Switzerland.
- FAO/WHO (2004) Fruit and vegetables for health : Report of the Joint FAO/WHO Workshop on Fruit and Vegetables for Health, 1-3 September 2004, Kobe, Japan.
- Assadian N, Esparza L, Fenn La, Ali AS, Miyamoto S, et al. (1998) Spatial variability of heavy metals in irrigated alfalfa fields in the upper Rio Grande River basin. Agric Water Manag 36: 141-156.
- Chen ZF, Zhao Y, Zhu Y, Yang X, Qiao J, et al. (2010) Health risks of heavy metals in sewage-irrigated soils and edible seeds in Langfang of Hebei province China. J Sci Food Agric 90: 314-320.
- Ali MH, Al-Qahtani KM (2012) Assessment of some heavy metals in vegetables cereals and fruits in Saudi Arabian markets. Egypt J Aquat Res 38: 31-37.
- Marzec Z, Koch W, Marzec A, Zukiewicz-Sobczak A (2014) Dietary exposure to cadmium lead and nickel among students from south-east Poland. Ann Agric Environ Med 21: 825-828.
- Lü H, Cai QY, Jones KC, Zeng QY, Katsoyiannis A (2014) Levels of organic pollutants in vegetables and human exposure through diet: A review. Crit Rev Environ Sci Technol 44: 1-33.
- Suami RB, Sivalingam P, Kabala CD, Otamonga JP, Mulaji CK, et al. (2018) Concentration of heavy metals in edible fishes from Atlantic Coast of Muanda Democratic Republic of the Congo. J Food Compost Anal 73: 1-9.
- Manzoor J, Sharma M, Wani KA (2018) Heavy metals in vegetables and their impact on the nutrient quality of vegetables: A review. J Soil Sci Plant Nutr 41: 1744-1763.
- FAO/WHO (1995) Evaluation of certain food additives and contaminants: Forty-fourth report of the Joint FAO/WHO Expert Committee on Food Additives. World Health Organization, Geneva, Switzerland.
- Sharma N, Gupta P, Rao CV (2012) Nutrient content mineral content and antioxidant activity of Amaranthus viridis and Moringa oleifera leaves. R J Med Plants 6: 253-259.
- Mota C, Nascimento AC, Santos M, Delgado I, Coelho I, et al. (2016) The effect of cooking methods on the mineral content of quinoa (Chenopodium quinoa) amaranth (Amaranthus sp.) and buckwheat (Fagopyrum esculentum). J Food Compost Anal 49: 57-64.
- Akinola A, Eresama P (2009) Economics of Amaranthus production under tropical conditions. Int J Veg Sci 16: 32-43.
- Oluwatosin GA, Adeoyolanu OD, Ojo AO, Are KS, Dauda TO, et al. (2009) Heavy metal uptake and accumulation by edible leafy vegetable (Amaranthus Hybridus L.) grown on urban valley bottom soils in Southwestern Nigeria. Soil Sediment Contam 19: 1-20.
- Musibono D, Biey E, Kisangala M,Nsimanda CI, Munzundu BA, et al. (2011) Urban agriculture as a response to unemployment in Kinshasa, Democratic Republic of Congo 11.
- Islam MS, Hoque, M (2014) Concentrations of heavy metals in vegetables around the industrial area of Dhaka city Bangladesh and health risk assessment. Int Food Res J 21: 2121-2126.
- Bashri G, Parihar P, Singh R, Singh S, Singh VP, et al. (2016) Physiological and biochemical characterization of two Amaranthus species under Cr (VI) stress differing in Cr (VI) tolerance. Plant Physiol Biochem 108: 12-23.
- Inoti KJ, Fanuel K, George O, Paul O (2012) Assessment of heavy metal concentrations in urban grown vegetables in Thika Town, Kenya. African Journal of Food Science 6: 41-46.
- Wang QR, Cui YS, Liu XM, Dong YT, Christie P (2003) Soil contamination and plant uptake of heavy metals at polluted sites in China. J Environ Sci Health A Tox Hazard Subst Environ Eng 38: 823-838.
- Ondo JA, Biyogo RM, Eba F, Prudent P, Fotio D, et al. (2013) Accumulation of soil-borne aluminium iron manganese and zinc in plants cultivated in the region of Moanda (Gabon) and nutritional characteristics of the edible parts harvested. J Sci Food Agric 93: 2549-2555.
- Chabukdhara M, Munjal A, Nema AK, Gupta SK, Kaushal RK (2016) Heavy metal contamination in vegetables grown around peri-urban and urban-industrial clusters in Ghaziabad India. Hum Ecol Risk Assess 22: 736-752.
- Steindor KA, Franiel IJ, Bierza WM, Pawlak B, Palowski BF (2016) Assessment of heavy metal pollution in surface soils and plant material in the post-industrial city of Katowice, Poland. J Environ Sci Health A Tox Hazard Subst Environ Eng 51: 371-379.
- FAO/WHO (2008) Codex Alimentarius Commission Thirty first Session. Report of the thirty ninth session of the codex committee on food hygiene. Geneva Switzerland.
- Larras F, Regier N, Planchon S, Poté J, Renaut J, et al. (2013) Physiological and proteomic changes suggest an important role of cell walls in the high tolerance to metals of Elodea nuttallii. J Hazard Mater 263: 575-583.
- Roos-Barraclough F, Givelet N, Martinez-Cortizas A, Goodsite ME, Biester H, et al. (2002) An analytical protocol for the determination of total mercury concentrations in solid peat samples. Sci Total Environ 292: 129-139.
- Ngweme GN, Mbela GK, Pole CS, Kyela CM, Komanda JA (2019) Analyse des connaissances attitudes et pratiques des maraîchers de la Ville de Kinshasa en rapport avec l’utilisation des pesticides et l’impact sur la santé humaine et sur l’environnement. Intern J Innovat Appl Studies 26: 345-356.
- Tshibanda JB, Devarajan N, Birane N, Mwanamoki PM, Atibu EK, et al. (2014) Microbiological and physicochemical characterization of water and sediment of an urban river: N'Djili River Kinshasa Democratic Republic of Congo. Water Qual Ecol 3-4: 47-54.
- Ikeda M, Zhang ZW, Shimbo S, Watanabe T, Nakatsuka H, et al. (2000) Urban population exposure to lead and cadmium in east and south-east Asia. Sci Total Environ 249: 373-384.
- Atayese MO, Eigbadon AI, Oluwa KA, Adesodun JK (2008) Heavy metal contamination of Amaranthus grown along major highways in Lagos Nigeria. Afr Crop Sci J 16: 225-235.
- Bhatia A, Singh S, Kumar A (2015) Heavy metal contamination of soil irrigation water and vegetables in peri-urban agricultural areas and markets of Delhi. Water Environ Res 87: 2027-2034.
- Ngelinkoto P, Thevenon F, Devarajan N, Birane N, Maliani J, et al. (2014) Trace metal pollution in aquatic sediments and some fish species from the Kwilu-Ngongo River Democratic Republic of Congo (Bas-Congo). Toxicol Environ Chem 96: 48-57.
- Niane B, Moritz R, Guédron S, Ngom PM, Pfeifer HR, et al. (2014) Effect of recent artisanal small-scale gold mining on the contamination of surface river sediment: Case of Gambia River Kedougou region southeastern Senegal. J Geochem Explor 144: 517-527.
- Li R, Wu H, Ding J, Fu W, Gan L, et al. (2017) Mercury pollution in vegetables grains and soils from areas surrounding coal-fired power plants. Sci Rep 7: 46545.
- Chiroma T, Ebewele R, Hymore F (2014) Comparative assessment of heavy metal levels in soil vegetables and urban grey waste water used for irrigation in Yola and Kano. IRJES 3: 1-9.
- Muliele TM, Manzenza CM, Ekuke LW, Diaka CP, Ndikubwayo DM, et al. (2017) Utilisation et gestion des pesticides en cultures maraîchères: cas de la zone de Nkolo dans la province du Kongo Central République démocratique du Congo. J Appl Biosci 119: 11954-11972.
- Kayembe JM, Periyasamy S. Diz Salgado C, Maliani J, Ngelinkoto P, et al. (2018) Assessment of water quality and time accumulation of heavy metals in the sediments of tropical urban rivers: Case of Bumbu River and Kokolo Canal Kinshasa City Democratic Republic of the Congo. J Afr Earth Sci 147: 536-543.
- Kayembe JM, Thevenon F, Laffite A, Periyasamy S, Ngelinkoto P, et al. (2018) High levels of faecal contamination in drinking groundwater and recreational water due to poor sanitation in the sub-rural neighborhoods of Kinshasa Democratic Republic of the Congo. Int J Hyg Environ Health 221: 400-408.
- Ngweme GN, Al Salah DMM, Laffite A, Sivalingam P, Grandjean D, et al. (2021) Occurrence of organic micropollutants and human health risk assessment based on consumption of Amaranthus viridis, Kinshasa in the Democratic Republic of the Congo. Sce Total Environm 754: 142175.
- Mata HK, Al Salah DMM, Konde JN, Kiyombo GM, Mulaji CK, et al. (2020) Level of toxic metals in consumable aquatic plant ledermanniella schlechteri from congo river and potential risk assessment through plant consumption. J Food Sci Nutr 6: 074.
Citation: Ngweme GN, Konde JNN, Laffite A, Kiyombo GM, Mulaji CK, et al. (2021) Contamination Levels of Toxic Metals in Marketed Vegetable (Amaranthus Viridis) at Kinshasa, Democratic Republic of the Congo. J Food Sci Nutr 7: 087.
Copyright: © 2021 Georgette N Ngweme, et al. This is an open-access article distributed under the terms of the Creative Commons Attribution License, which permits unrestricted use, distribution, and reproduction in any medium, provided the original author and source are credited.