Dietary Pattern, Biochemical, and Anthropometric Indices of Preschool Children Age 2-5years in Ogugu Olamaboro Local Government of Kogi State
*Corresponding Author(s):
Alex VictorDepartment Of Agricultural Economics And Extension, Prince Abubakar Audu University, P.M.B 1008 Anyigba, Kogi State, Nigeria
Email:alexvictor7108@gmail.com
Abstract
This study was aimed at dietary pattern biochemical and anthropometric indices of pre-school children aged 2-5 years in Ogugu of Olamaboro local government area of kogi state. A total of two hundred and forty (240) preschool children were randomly selected. Questionnaire, anthropometric measurements, biochemical analysis and 3-day weighed food intake were used for data collection. Two hundred and forty (240) questionnaires were distributed to mothers and caregivers of the selected children. Out of the 240 samples, sub samples of thirty children were randomly selected for biochemical assessment of iron and zinc status and for 3-day weighed food intake analysis. Iron status was assessed in terms of transferrinemia (serum iron, total iron binding capacity and percentage transferrin saturation) while zinc status was assessed using serum zinc. WHO child growth standard and NCHS reference were used as standards. The result showed that prevalence of underweight and wasting for children 2-5 years was 1.7% and 11.8%, respectively using WHO standard. The overall prevalence of underweight and wasting was 3.3% and 10%, respectively by NCHS reference. Stunting affected only 0.8% using WHO Standard while none was stunted by NCHS reference. Sixty-seven percent (67%) of the pre-school children had low transferrinemia level (percentage transferring saturation < 15%). Serum zinc result showed that 36.7% and 63.3% of the children had normal (> 65μg/dl) and deficient (< 65 μg/dl) zinc status respectively. The children took ≥143.3% and ≥ 155.5% of their FAO/WHO iron and zinc requirement values, respectively. Their zinc intakes was high but were mainly from plant staples. Intensified nutrition education, improved food processing and handling techniques and diversification of diet would drastically reduce malnutrition.
Keywords
Anthropometric Indices of Preschool Children, Biochemical and Dietary Pattern.
Introduction
Malnutrition is one of the most important global health problems affecting large numbers of children in developing countries. The World Health Organization defines malnutrition as “the cellular imbalance between supply of nutrient and energy and body’s demand for them to ensure growth, maintenance and specific functions” [1] .Malnutrition is synonymous with Protein- Energy Malnutrition (PEM) and signifies an imbalance between the supply of protein and energy and the body’s demand for these to ensure optimal growth and function. A range of inadequacy states occurs because of interaction of diet and nutritional requirement. Protein Energy Malnutrition (PEM) a consequence of various factors is often related to poor quality of food, insufficient food intake, and severe and repeated infectious diseases, or, frequently, a combination of the three [2]. The major outcomes of PEM during childhood may be classified in terms of morbidity, mortality, and psychological and intellectual development [3] with important consequences in adult life.
Protein Energy Malnutrition (PEM) affects a large proportion of children under age 5 years in the developing world. In children, protein-energy malnutrition is defined by measurements that fall below minus 2 standard deviations under the normal weight for age (underweight), height for age (stunting) and weight for height (wasting) [4]. In developing countries, about 31% of children under 5 years of age are underweight, 38% have stunted growth and 9% are wasted. Protein- energy malnutrition usually manifests early, in children between 6 months and 2 years of age and is associated with early weaning, delayed introduction of complementary foods, a low-protein diet and severe or frequent infections [5].
Pre-school children constitute the most vulnerable segment of any community. Their nutritional status is a sensitive indicator of community health and nutrition. Under nutrition among them is one of the greatest public health problems in developing countries. Under nutrition raises the likelihood that a child will become sick and will then die from the disease. Children whose weight-for-age is less than -1 SD are also at increased risk of death, and under nutrition is responsible for 44 to 60 percent of the mortality caused by measles, malaria, pneumonia, and diarrhea. Morbidity attributable to under nutrition depends on the nature of the illness. Susceptibility to a highly infectious disease such as measles is unlikely to be affected by nutritional status: all individuals are equally likely to become infected if they are unvaccinated and naive. However, 5 to 16 percent of pneumonia, diarrhea, and malaria morbidity are attributable to moderate to severe underweight [6].
Micronutrient deficiencies (iron, iodine, vitamin A and zinc) are also major public health problems in developing countries, however, vitamins C, D and B-complex deficiencies have declined considerably in recent decades. Iron and zinc deficiencies are common in children in developing countries and are a significant contributor to morbidity and mortality. Iron and zinc deficiencies are likely to occur in the same population. Iron and zinc are essential micronutrients for human growth, development, and maintenance of the immune system. Iron is needed for psychomotor development, maintenance of physical activity and work capacity, and resistance to infection. Zinc is needed for growth and for maintenance of immune function, which enhances both the prevention of and recovery from infectious diseases. Meat products are the best source of both iron and zinc. Consequently, iron and zinc deficiencies may coexist in populations that consume diets with insufficient amounts of animal products. The intake of these two micronutrients could be improved through dietary diversification, food fortification or supplementation. If iron and zinc are to be provided together, it is important to determine how they interact biologically. This is because they have chemically similar absorption and transport mechanisms, iron and zinc have been thought to compete for absorptive pathways [7-9].
Nutritional status, especially in children, has been widely and successfully assessed by anthropometric measures in both developing and developed countries. Height and weight are the most commonly used measures, not only because they are rapid and inexpensive to obtain, but also because they are easy to use. Once a child’s height and weight have been correctly measured and their age known, a clinician or researcher can assess the child’s growth and general nutritional status by using a standardized age- and sex-specific growth reference to calculate Height-For-Age Z-Scores (HAZ), Weight-For-Age Z-Scores (WAZ), Weight-For-Height Z-Scores (WHZ) and Body-Mass-Index-For-Age Z-Scores (BMIZ).
In April 2006, the World Health Organization released new global child growth standards for infants and children up to the age of 5 years. These new standards were developed in accordance with the idea that children, born in any region of the world and given an optimum start in life, all have the potential to grow and develop to within the same range of height and weight for age. Child malnutrition is linked to poverty, low levels of education and poor access to health services.
Improved nutrition is assumed to be directly linked to expanded food production while increased income is a good proxy for improved nutrition. Growth disorders in children often go unrecognized, and therefore undiagnosed, for several reasons. Some infants and children are not routinely weighed and monitored at their regular health care visits. Some children see a health care professional only for acute care and may not be weighed at all. Measurements incorrectly taken, inaccurately plotted, or not plotted at all may lead to erroneous interpretation of growth patterns and unnecessary or missed referrals. Weight alone does not address linear growth and body shape but misses the opportunity to educate caregivers about a typical and normal pattern of growth.
Children aged less than 5 years are at high risk of iron and zinc deficiencies. Most children especially those from low-income family do not consume iron rich complementary foods by 6 months of age.
This is usually so because preschool children in developing countries and low socio economic status typically consume little meat or animal products, hence, iron and zinc deficiencies in this age group are common. Recently it has been reported that about 48% of the world’s population may be at risk of inadequate zinc intakes [10-63].
In addition, zinc deficiency is widespread in developing countries.
The nutritional status of children under five years of age is of particular concern since the early years of life are crucial for optimal growth and development. Their nutritional well-being reflects household, community and national investments in family health thereby contributing both directly and indirectly to overall country development and in particular, development of human resource. However, most of the State Development programs (SDPs) in Kogi State do not have data on nutritional status of the under-fives in Ogugu, and these data are used in the definition of health and nutritional status for purposes of Programmed planning, implementation and evaluation. Based on this, a nutritional assessment to determine the nutritional status of children 2-5 years in Ogugu is required. The specific objectives were to;
- Assess the anthropometric indices of preschool children in Ogugu using WHO child growth standard and NCHS/WHO reference values.
- Assess the biochemical status of preschool children in Ogugu.
- Assess the dietary pattern and factors affecting the nutritional status of the preschool children in Ogugu.
Materials And Methods
This study was a survey aimed at assessing the iron, zinc status and anthropometric indices of preschool children (2-5years) in Ogugu community of Olamaboro Local Government Area of Kogi State. Selecting 240 as a sample size through multistage sampling techniques. This was carried out as follows; from the five villages that make up Ogugu, the five villages was used. In each of the villages, two clans will be selected, from each clan; two nursery schools will be randomly selected. The sampling frame from each school is used to calculate an interval for selecting 20 children. Sub sample of 30 pre-schoolers was randomly selected for a 3-day weighed food intake and biochemical investigation.
Results and discussion
The Age and Sex Distribution of the Children
The distribution of respondents according to their age and sex as captured in the study area is presented in Table1
|
Age |
Frequency |
Percentage (%) |
|
2 years |
25 |
10.4 |
|
3years |
61 |
25.4 |
|
4years |
85 |
35.4 |
|
5years |
69 |
28.8 |
|
Total |
240 |
100 |
|
Sex |
||
|
Male |
131 |
54.6 |
|
Female |
109 |
45.4 |
|
Total |
240 |
100 |
|
Source: Field Survey, 2023 |
||
Table 1: Age and sex distribution of the children.
Out of the 240-study population, 35.4% were 4 years, 25.4% and 28.8% were 5 years and 3 years, respectively. Majority (54.6%) of the children were males and 45.4% were females.
The Frequency and Percentage Distribution of Children Exclusively Breastfed and Duration of Exclusive Breastfeeding. The distribution of the respondent based on the exclusively breastfed and duration of exclusive breast feeding are captured in Table 2.
|
Research Item |
Frequency |
Percentage (%) |
|
Breastfeeding |
||
|
Exclusively breastfed |
168 |
70 |
|
Not exclusively breastfed |
72 |
30 |
|
Total |
240 |
100 |
|
Duration of exclusive breastfeeding |
||
|
1 month |
2 |
1.2 |
|
2 months |
2 |
1.2 |
|
3 months |
24 |
14.3 |
|
4 months |
26 |
15.5 |
|
5 months |
15 |
8.9 |
|
6 months |
99 |
58.9 |
|
Total |
168 |
100 |
Table 2: Frequency and percentage distribution of children exclusively breastfed and duration of exclusive breast-feeding.
Seventy percent (70%) of the children were exclusively breastfed and 30% were not exclusively breastfed. Out of the 70% of the exclusively breastfed preschoolers, 58.9% were exclusively breastfed for 6 months. Others did exclusive breastfeeding for less than 6months. Number of children, size of household and Number of meals eaten daily. Table 3 shows the number of children, size of household and number of meals consumed daily.
|
|
Frequency |
Percentage (%) |
|
Number of children |
||
|
1 |
12 |
5 |
|
2 |
49 |
20.4 |
|
3 |
67 |
27.9 |
|
4 |
69 |
28.8 |
|
≥ 5 |
43 |
17.9 |
|
Total |
240 |
100 |
|
Size of household |
||
|
< 5 |
63 |
26.3 |
|
06-Oct |
132 |
55 |
|
Above 10 |
45 |
18.8 |
|
Total |
240 |
100 |
|
Number of meals/day |
||
|
3 times |
87 |
36.3 |
|
4 times |
75 |
31.3 |
|
5 times |
41 |
17.1 |
|
6 times |
20 |
8.3 |
|
>6times |
17 |
7.1 |
|
Total |
240 |
100 |
|
Source: Field Survey, 2023 |
||
Table 3: Frequency Distribution of the Number of Children, Size of Household and Number of Meals Consumed Daily.
About 28% of the respondents had 4 children, while 27.9%, 20.4% and 5% had 3, 2, and 1 child, respectively. Fifty-five percent (55%) of the households had between 6 to 10 people eating from the same pot. Twenty six percent (26%) had < 5 people and 18.8% had above 10 people eating from the same pot. However, 36.3% of the children fed 3times daily and 31.3% fed 4times daily.
Anthropometric indices of the children. Table 4 shows the prevalence of anthropometric indices of the children according to WHO child growth standard and NCHS/WHO reference.
|
|
WHO STANDARD |
NCHS REFERENCE |
||||||||||
|
W/H |
W/A |
H/A |
W/H |
W/A |
H/A |
|||||||
|
F |
% |
F |
% |
F |
% |
F |
% |
F |
% |
F |
% |
|
|
Severe |
5 |
2.3 |
1 |
0.4 |
- |
- |
2 |
0.8 |
1 |
0.4 |
- |
- |
|
Moderate |
21 |
9.6 |
3 |
1.3 |
2 |
0.8 |
22 |
9.2 |
7 |
2.9 |
- |
- |
|
Normal |
193 |
87.2 |
229 |
95.4 |
173 |
72.1 |
214 |
89.2 |
220 |
91.7 |
167 |
69.6 |
|
High |
2 |
0.9 |
5 |
2.1 |
39 |
16.3 |
2 |
0.8 |
7 |
2.9 |
42 |
17.5 |
|
Extreme |
- |
- |
2 |
0.8 |
26 |
10.8 |
- |
- |
5 |
2.1 |
31 |
12.9 |
|
Total |
221 |
100 |
240 |
100 |
240 |
100 |
240 |
100 |
240 |
100 |
240 |
100 |
|
W/H (Weight For Length) indicates wasting ,W/A (Weight For Age) indicates underweight H/A (Height For Age) indicates stunting |
||||||||||||
Table 4: Prevalence of anthropometric indices of the children according to WHO child growth standard and NCHS/WHO reference.
Majority of the children (87.2%, 95.4% and 72.1%) fell within the normal range in all the anthropometric indicators (W/H, W/A, and H/A), respectively. However, wasting (W/H) was more prevalent among the children. About 2% of the children had severe wasting and 9% moderate wasting. Majority of the children (89.2%, 91.7%, 69.6%) fell within the normal region in all the anthropometric indicators (W/H, W/A, and H/A) respectively using NCHS /WHO reference. However, all the children were not stunted. About 9% of the children were moderately wasted. While 0.8% of the children was found to be severely wasted. Weight for height status of the children by Sex. Table5 shows the weight for height status of the children by sex. Among the male children assessed.
|
Weight-for-height Classification |
WHO STANDARD |
NCHS REFERENCE |
||||||
|
Male |
Female |
Male |
Female |
|||||
|
F |
% |
F |
% |
F |
% |
F |
% |
|
|
Severely wasted |
3 |
2.4 |
2 |
2 |
2 |
1.5 |
- |
- |
|
Moderately wasted |
15 |
12.2 |
6 |
6.1 |
13 |
9.9 |
9 |
8.3 |
|
Normal |
104 |
84.6 |
89 |
90.8 |
114 |
87.8 |
98 |
90.8 |
|
Overweight |
1 |
0.8 |
1 |
1 |
1 |
0.8 |
1 |
0.9 |
|
Obesity |
- |
- |
- |
- |
- |
- |
- |
- |
|
Total |
123 |
100 |
98 |
100 |
131 |
100 |
109 |
100 |
|
X2 = 2.426, P = 0.489(Not significant) X2 = 1.923, P = 0.587 (NS) |
||||||||
Table 5: Weight for height status of the children by sex
Majority (84.6%) had normal weight for height while about 12.2% and 2.4% were moderate and severely wasted using WHO standard .Among the female children, majority (90.8%) had normal weight for height status while 6.1% and 2% were moderate and severely wasted respectively using WHO standard. However, based on NCHS reference, it was observed that majority (87.8%) of the male children had normal weight for height status while 9.9% and 1.5% were moderately and severely wasted. Among the female children, about 90% had normal weight for height status while 8.3% were moderately wasted. No significant relationship (P>0.05) was observed between the weight for height status and sex of the children studied although the male children were found to be more wasted than the females. Height for Age Status of the Children by Sex.
Table 6 shows the height for age status of the children by sex.
|
Height-for-age Classification |
WHO STANDARD |
NCHS REFERENCE |
||||||
|
Male |
Female |
Male |
Female |
|||||
|
F |
% |
F |
% |
F |
% |
F |
% |
|
|
Severely stunted |
- |
- |
- |
- |
- |
- |
- |
- |
|
Moderately stunted |
1 |
0.8 |
1 |
0.9 |
- |
- |
- |
- |
|
Normal |
94 |
71.8 |
79 |
72.5 |
93 |
71 |
74 |
67.9 |
|
Tall |
23 |
17.6 |
16 |
14.7 |
25 |
19.1 |
17 |
15.6 |
|
Extremely tall |
13 |
9.9 |
13 |
11.9 |
13 |
9.9 |
18 |
16.5 |
|
Total |
131 |
100 |
109 |
100 |
131 |
100 |
109 |
100 |
|
X2 = 0.545, P = 0.909 (Not significant) |
X2 = 2.496, P = 0.287(NS) |
|||||||
Table 6: Height for Age Status of the Children by Sex.
The male and female children assessed were tall (17.6% and 14.7% respectively) and extremely tall (9.9% and 11.9% respectively) using the WHO standard while 71.6% of the males and 72.5% of the females had normal height for age status. However, using NCHS reference 71% and 67.9% of the male and female children respectively had normal height for age status. Furthermore, the result showed that sex did not significantly influence (P>0.05) the height for age status of the children studied.
Weight for Age Status of the Children by Sex. Table 7 shows the weight for age status of the children by sex.
|
Weight-for-age Classification |
WHO STANDARD |
NCHS REFERENCE |
||||||
|
Male |
Female |
Male |
Female |
|||||
|
F |
% |
F |
% |
F |
% |
F |
% |
|
|
Severe underweight |
1 |
0.8 |
- |
- |
1 |
0.8 |
- |
- |
|
Moderate underweight |
2 |
1.5 |
1 |
0.9 |
4 |
3.1 |
3 |
2.8 |
|
Normal |
124 |
94.7 |
105 |
96.3 |
121 |
92.4 |
99 |
90.8 |
|
Overweight |
3 |
2.3 |
2 |
1.8 |
3 |
2.3 |
4 |
3.7 |
|
Obese |
1 |
0.8 |
1 |
0.9 |
2 |
1.5 |
3 |
2.8 |
|
Total |
131 |
100 |
109 |
100 |
131 |
100 |
109 |
100 |
|
X2 = 1.102, P = 0.894(Not significant) |
X2 = 1.683, P = 0.794(NS) |
|||||||
Table 7: Weight for Age Status of the Children by Sex.
It was found that majority of the female children assessed (96.3%) had normal weight for age status using WHO standard. None of the female was severely underweight but a few (0.9%) were moderately underweight. Males who were moderately underweight (1.5%) were more than those that were severely underweight (0.8%). Using NCHS reference, the male children assessed, showed majority (92.4%) had normal weight for age status than the female (90.8%). However, male children were more moderately (3.1%) and severely underweight (0.8%) than the female children. Furthermore, it was observed that males studied with both standards had equal numbers (2.3%) of overweight while none of the females was severely underweight. Sex also did not affect the weight for age status of the children significantly (P>0.05).
Weight for Height Status (W/H) of the Children by Age Group According to WHO Child Growth Standard. Table 8a shows the weight for height status (W/H) of the children by age group according to WHO child growth standard.
|
W/H |
2years |
3years |
4years |
5years |
||||
|
F |
% |
F |
% |
F |
% |
F |
% |
|
|
Severely wasted |
3 |
12 |
- |
- |
1 |
1.3 |
1 |
1.8 |
|
Moderately wasted |
1 |
4 |
7 |
11.7 |
8 |
10 |
5 |
8.9 |
|
Normal |
20 |
80 |
53 |
88.3 |
70 |
88.8 |
49 |
87.5 |
|
Overweight |
1 |
4 |
- |
- |
- |
- |
1 |
1.8 |
|
Total |
25 |
100 |
60 |
100 |
80 |
100 |
56 |
100 |
|
X2 = 17.959, P = 0.036 (Significant) |
||||||||
Table 8a: Weight for Height Status (W/H) of the Children by Age Group According to WHO Child Growth Standard.
It was observed that in all age groups assessed majority of the children (2yrs, 80%; 3yrs 88.3%; 4yrs 88.8%; 5yrs 87.5%) had normal weight for height status. However, there was a significant association (P < 0.05) between age and weight for height of the children studied using the WHO standard.
Weight for Height Status (W/H) of the Children by Age Group using NCHS. Table 8b shows the weight for height status of the children by age group according to NCHS reference.
|
W/H |
2years |
3years |
4years |
5years |
||||
|
F |
% |
F |
% |
F |
% |
F |
% |
|
|
Severely wasted |
- |
- |
- |
- |
1 |
1.2 |
1 |
1.4 |
|
Moderately wasted |
4 |
16 |
5 |
8.2 |
6 |
7.1 |
7 |
10.1 |
|
Normal |
20 |
80 |
56 |
91.8 |
78 |
91.8 |
60 |
87 |
|
Overweight |
1 |
4 |
- |
- |
- |
- |
1 |
1.4 |
|
Total |
25 |
100 |
61 |
100 |
85 |
100 |
69 |
100 |
|
X2 = 7.895, P = 0.545 (Not significant) |
||||||||
Table 8b: Weight for Height Status (W/H) of the Children by Age Group using NCHS.
Majority of the children assessed in all age groups 2 years, 3 years, 4 years and 5 years fell within the normal region (80%, 91.8%, 91.8%, and 87% respectively) of weight for height. There was no significant association (P>0.05) between age and weight for height status based on NCHS reference.
Height for Age Status of the Children by Age according to WHO Standard. Table 9a shows the height for age status of the children by age according to WHO standard.
|
H/A |
2years |
3years |
4years |
5years |
||||
|
F |
% |
F |
% |
F |
% |
F |
% |
|
|
Severely stunted |
- |
- |
- |
- |
- |
- |
- |
- |
|
Moderately stunted |
- |
- |
1 |
1.6 |
1 |
1.2 |
- |
- |
|
Normal |
9 |
36 |
45 |
73.8 |
65 |
76.5 |
54 |
78.3 |
|
Tall |
5 |
20 |
10 |
16.4 |
12 |
14.1 |
12 |
17.4 |
|
Extremely tall |
11 |
44 |
5 |
8.2 |
7 |
8.2 |
3 |
4.3 |
|
Total |
25 |
100 |
61 |
100 |
85 |
100 |
69 |
100 |
|
X2 = 36.007, P = 0.000 (Significant) |
||||||||
Table 9a: Height for age status of the children by age according to WHO standard.
It shows that among the children aged 2 years, 44% were extremely tall, 20% were tall while 36% had normal height for age. Among the children aged 3 years, 8.2% were extremely tall, 16.4% were tall while 73.8% and 1.6% were normal and moderately stunted respectively. Also, among the 4 years studied, 8.2% and 14.1% were extremely tall and tall respectively, while 76.5% and 1.2% were normal and moderately stunted respectively. Furthermore, among the children aged 5 years, majority (78.3%) fell within the normal range, while 17.4% and 4.3% were tall and extremely tall respectively. There was a significant association (P>0.05) between height for age status of the children studied based on WHO child growth standard.
Height for Age Status of the Children by Age Group according to NCHS Reference. Table 9b shows the height for age status of the children by age group according to NCHS reference.
|
H/A |
2years |
3years |
4years |
5years |
||||
|
F |
% |
F |
% |
F |
% |
F |
% |
|
|
Severely stunted |
- |
- |
- |
- |
- |
- |
- |
- |
|
Moderately stunted |
- |
- |
- |
- |
- |
- |
- |
- |
|
Normal |
7 |
28 |
45 |
73.8 |
65 |
76.5 |
50 |
72.5 |
|
Tall |
7 |
28 |
8 |
13.1 |
13 |
15.5 |
14 |
20.3 |
|
Extremely tall |
11 |
44 |
8 |
13.3 |
7 |
8.3 |
4 |
7.2 |
|
Total |
25 |
100 |
61 |
100 |
85 |
100 |
69 |
100 |
|
X2 = 31.678, P = 0.000 (Significant) |
||||||||
Table 9b: for Age Status of the Children by Age Group according to NCHS Reference.
It showed that in all the age groups assessed, 28% of the 2 years had normal height for age while 3 years, 4 years and 5 years were 73.8%; 76.5% and 72.5% of normal height for age status. None of the children within the age group studied had low height for age rather a higher percentage (44%) among the 2 years were extremely tall and 28% to be tall.
Weight for Age Status of the Children by Age Group according to WHO Child Growth Standard. Table 10a shows the weight for age status of the children by age group according to WHO child growth standard.
|
W/A |
2years |
3years |
4years |
5years |
||||
|
F |
% |
F |
% |
F |
% |
F |
% |
|
|
Severe underweight |
- |
- |
- |
- |
- |
- |
1 |
1.4 |
|
Moderate Underweight |
1 |
4 |
1 |
1.6 |
1 |
1.2 |
- |
- |
|
Normal |
19 |
76 |
59 |
96.7 |
83 |
97.6 |
68 |
98.6 |
|
Overweight |
4 |
16 |
- |
- |
1 |
1.2 |
- |
- |
|
Obese |
1 |
4 |
1 |
1.6 |
- |
- |
- |
- |
|
Total |
25 |
100 |
61 |
100 |
85 |
100 |
69 |
100 |
|
X2 = 37.097, P = 0.000(Significant) |
||||||||
Table 10a: Weight for Age Status of the Children by Age Group according to WHO Child Growth Standard.
It revealed that among the children aged 2years, majority (76%) had normal weight for age status, 4% were moderately underweight, and 16% were overweight while 4% were obese. Among the children aged 3years, 1.6% were obese and moderately underweight while majority (96.7%) had normal weight for age status. Also, among the children aged 4years (97.6%) had normal weight for age status, while 1.2% were overweight and moderate underweight. Furthermore, 98.6% of the children aged 5years were within normal weight for age while 1.4% was severely underweight. Nevertheless, the weight for age status of the children was significantly influenced by age.
Weight for Age Status of the Children Studied by Age Group according to NCHS Reference. Table 10b shows the weight for age status of the children by age group according to NCHS reference.
|
|
2years |
3years |
4years |
5years |
||||
|
F |
% |
F |
% |
F |
% |
F |
% |
|
|
Severe underweight |
- |
- |
- |
- |
- |
- |
1 |
1.4 |
|
Moderate Underweight |
1 |
4 |
3 |
4.9 |
3 |
3.5 |
- |
- |
|
Normal |
19 |
76 |
57 |
93.4 |
80 |
94.1 |
64 |
92.8 |
|
Overweight |
2 |
8 |
- |
- |
1 |
1.2 |
4 |
5.8 |
|
Obese |
3 |
12 |
1 |
1.6 |
1 |
1.2 |
- |
- |
|
Total |
25 |
100 |
61 |
100 |
85 |
100 |
69 |
100 |
|
X2 = 26.764, P = 0.008(Significant) |
||||||||
Table 10b: Weight for Age Status of the Children Studied by Age Group according to NCHS Reference.
It revealed that among the children aged 2 years, majority (76%) had normal weight for age status, 4% were moderately underweight, and 8% were overweight while 12% were obese. Among the children aged 3 years, 1.6% was obese and 4.9% were moderately underweight while majority (93.4%) had normal weight for age status. Also, among the children aged 4 years (94.1%) had normal weight for age status, 3.5% were moderately underweight while 1.2% were overweight and obese. Furthermore, 92.8% of the children aged 5 years were within normal weight for age while 1.4% was severely underweight and 5.8% were overweight. Nevertheless, the weight for age status of the children was significantly influenced by age using WHO standard.
Figure1 shows the overall prevalence of underweight across different age groups (according to WHO child growth standard and NCHS/WHO reference). It revealed consistently higher estimates in all age groups by the NCHS reference, except in children of 2years and 5years of age. For children of all ages combined, the prevalence of underweight was 1.9 times higher, when NCHS reference rather than the WHO standards were used, with the absolute difference being 1.6%. Nevertheless, age group did not influence the prevalence of underweight significantly (P>0.05).
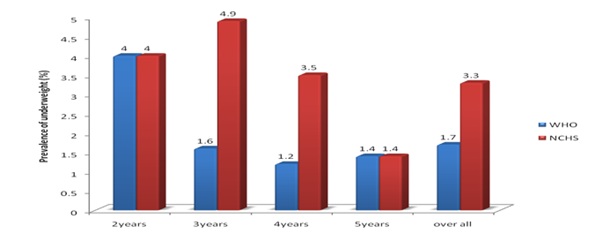 Figure 1: prevalence of underweight (WAZ <-2) Among the Children in different age groups with sex combined.
Figure 2 shows the overall prevalence of wasting across different age groups (according to WHO child growth standard and NCHS/WHO reference). It revealed consistently higher estimates in all age groups by the WHO standard, except in children of 5years of age. For children of all ages combined, the prevalence of wasting was 1.2 times higher, when the WHO standard rather than the NCHS reference were used, with the absolute difference being 1.8%.
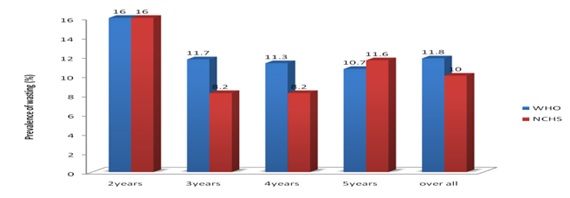 Figure 2: prevalence of Wasting (WHZ <-2) Among the Children in different age groups with sex combined.
Figure 3 shows the overall prevalence of stunting across different age groups (according to WHO child growth standard and NCHS/WHO reference). It revealed consistently higher estimates in all age groups by the WHO standard. For children of all ages combined, the prevalence of stunting was higher, when the WHO standard was used while NCHS reference showed no prevalence of stunting.
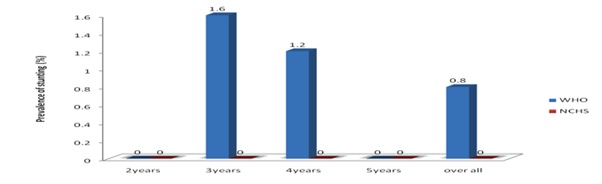 Figure 3: prevalence of Stunting (HAZ <-2) Among the Children in different age groups with sex combined.
Iron and zinc status of the preschool children. Table 11 shows the percentage and frequency distribution of the iron status of the preschool children. Equal number (40%) of the children had normal and high serum iron status, 66.7% had deficient percentage transferrin saturation. About 36% had normal total iron binding capacity while 63.3% had high total iron binding capacity.
|
|
Serum Iron |
TIBC |
Transferrin Saturation |
||||
|
Iron status |
F |
% |
F |
% |
F |
% |
|
|
Deficient |
6 |
20 |
- |
- |
20 |
66.7 |
|
|
Satisfactory (Normal) |
12 |
40 |
11 |
36.7 |
10 |
33.3 |
|
|
High |
12 |
40 |
19 |
63.3 |
- |
- |
|
|
Total |
30 |
100 |
30 |
100 |
30 |
100 |
|
|
Normal reference ranges:Serum iron = 60 - 170 µg/dl,Total Iron Binding Capacity (TIBC) = 240 - 400µg/dl,Transferrin saturation = 15 - 50% |
|||||||
Table 11: Percentage and frequency distribution of the iron status of the preschool children.
Table 12 shows the mean serum iron concentration, total iron binding capacity, iron status of male and female children in different age groups. The mean serum iron concentration of the female children (42 mg/dl) were not significantly higher (P>0.05) than that of the males (40.62mg/dl). However, the sex of the children studied did not significantly influence (P < 0.05) the iron status. More males (66.7%) had deficient iron status than the females (33.3%). Moreover, 60% of the male children had normal %Tsat than the females (40%).
|
|
Serum Iron (µg/dl) |
Deficient |
Iron status Normal |
High |
X2 (P-value) |
||||
|
Sex |
N |
Mean ± SD |
F |
% |
F |
% |
F |
% |
0.475 (0.789) |
|
Male |
17 |
40.62 ± 30.52 |
4 |
66.7 |
6 |
50 |
7 |
58.3 |
|
|
Female |
13 |
42.00 ± 26.86 |
2 |
33.3 |
6 |
50 |
5 |
41.7 |
|
|
Total |
30 |
41.21 ± 28.51 |
6 |
100 |
12 |
100 |
12 |
100 |
|
|
TIBC |
|||||||||
|
Male |
17 |
426.12±45.04 |
- |
- |
5 |
45.5 |
12 |
63.2 |
0.889(0.346) |
|
Female |
13 |
415.46±53.89 |
- |
- |
6 |
54.5 |
7 |
36.8 |
|
|
Total |
30 |
421.46±53.89 |
- |
- |
11 |
100 |
30 |
100 |
|
|
Percentage Saturation |
|||||||||
|
Male |
17 |
9.28 ± 6.59 |
11 |
55 |
6 |
60 |
- |
- |
0.068(0.794) |
|
Female |
13 |
9.62 ± 5.2 |
9 |
45 |
4 |
40 |
- |
- |
|
|
Total |
30 |
9.43 ± 5.93 |
20 |
100 |
10 |
100 |
- |
- |
|
|
F = Frequency , % = Percentage |
|||||||||
Table 12: The mean serum iron concentration, total iron binding capacity, iron status of male and female children in different age groups.
Table 13 shows the iron status of the children by age with sex combined. No significant difference (P>0.05) was found in the mean serum iron concentration of the different age groups studied. However, children in the age group of 5years had the highest serum iron concentration (48.75 mg/dl) while those in the age group of 3years had the least serum iron concentration (38.18mg/dl). About 50% of the children in the age group of 3years had normal iron status and high iron status respectively. Also 25%, 16.7% and 8.3% of the children in the age groups of 4years, 2years and 5years respectively had normal iron status. However, the iron status of the children were not significantly associated (P>0.05) with age group. Nevertheless, 40% of the children aged 4years had normal %Tsat while a greater sample 55% of the children aged 3years had deficient %Tsat. However, there was no significant difference between age and iron status.
|
|
Serum Iron (µg/dl) |
Deficient |
Iron status Normal |
High |
X2 (P- value) |
|||||
|
Age |
N |
Mean ± SD |
F |
% |
F |
% |
F |
% |
||
|
2years |
3 |
42.17 ± 31.61 |
- |
- |
2 |
16.7 |
1 |
8.3 |
1.815(0.936) |
|
|
3years |
14 |
38.18 ± 25.70 |
3 |
50 |
6 |
50 |
5 |
41.7 |
||
|
4years |
9 |
42.28 ± 32.17 |
2 |
33.3 |
3 |
25 |
4 |
33.3 |
||
|
5years |
4 |
48.75 ± 38.04 |
1 |
16.7 |
1 |
8.3 |
2 |
16.7 |
||
|
Total |
30 |
41.22 ± 28.51 |
6 |
100 |
12 |
100 |
12 |
100 |
||
|
TIBC |
||||||||||
|
2years |
3 |
398.00±56.32 |
- |
- |
2 |
18.2 |
1 |
5.3 |
5.359(0.147) |
|
|
3years |
14 |
409.29±43.32 |
- |
- |
7 |
63.6 |
7 |
36.8 |
||
|
4years |
9 |
444.78±36.45 |
- |
- |
2 |
18.2 |
7 |
36.8 |
||
|
5years |
4 |
429.50±77.36 |
- |
- |
- |
- |
4 |
21.1 |
||
|
Total |
30 |
421.50±48.48 |
- |
- |
11 |
100 |
19 |
100 |
||
|
Percentage Saturation |
||||||||||
|
2years |
3 |
10.23 ± 6.45 |
2 |
10 |
1 |
10 |
- |
- |
1.893(0.595) |
|
|
3years |
14 |
8.92 ± 5.30 |
11 |
55 |
3 |
30 |
- |
- |
||
|
4years |
9 |
9.41± 6.89 |
5 |
25 |
4 |
40 |
- |
- |
||
|
5years |
4 |
10.67 ± 7.74 |
2 |
10 |
2 |
20 |
- |
- |
||
|
Total |
30 |
9.43 ± 5.93 |
20 |
100 |
10 |
100 |
- |
- |
||
Table 13: Iron status of the children by age with sex combined.
Table 14 shows the iron status and the mean serum iron concentration of the male children by age group. It showed that male children in the age group 5years had the highest serum iron concentration (46.25mg/dl), but it was not significantly different (P>0.05) from those of the other age groups. Male children aged 4years had the highest percentage (42.9%) with high iron status while children aged 2years, 3years and 4years had normal iron status (33.3%). More so, 50% of the children aged 4years had normal %Tsat. However, no significant association (P>0.05) was identified between iron status and age group in the male children studied.
|
|
Serum Iron (µg/dl) |
Deficient |
Iron status Normal |
High |
X2 (P- value) |
||||
|
Age |
N |
Mean ± SD |
F |
% |
F |
% |
F |
% |
3.156(0.789) |
|
2years |
3 |
42.17 ± 31.61 |
- |
- |
2 |
33.3 |
1 |
14.3 |
|
|
3years |
5 |
38.10 ± 27.02 |
1 |
25 |
2 |
33.3 |
2 |
28.6 |
|
|
4years |
7 |
40.14 ± 35.10 |
2 |
50 |
2 |
33.3 |
3 |
42.9 |
|
|
5years |
2 |
46.25 ± 49.85 |
1 |
25 |
- |
- |
1 |
14.3 |
|
|
Total |
17 |
40.62 ± 30.52 |
4 |
100 |
6 |
100 |
7 |
100 |
|
|
TIBC |
|||||||||
|
2years |
3 |
398.0 ± 56.32 |
- |
- |
2 |
40 |
1 |
8.3 |
3.880(0.275) |
|
3years |
5 |
420 ± 45.31 |
- |
- |
2 |
40 |
3 |
25 |
|
|
4years |
7 |
453.7 ± 25.54 |
- |
- |
1 |
20 |
6 |
50 |
|
|
5years |
2 |
387.0 ± 55.15 |
- |
- |
- |
- |
2 |
16.7 |
|
|
Total |
17 |
426.12±45.04 |
- |
- |
5 |
100 |
12 |
100 |
|
|
Percentage Saturation |
|||||||||
|
2years |
3 |
10.23 ± 6.45 |
2 |
18.2 |
1 |
16.7 |
- |
- |
0.882(0.830) |
|
3years |
5 |
8.69 ± 5.63 |
4 |
36.4 |
1 |
16.7 |
- |
- |
|
|
4years |
7 |
8.77 ± 7.57 |
4 |
36.4 |
3 |
50 |
- |
- |
|
|
5years |
2 |
11.15 ± 11.29 |
1 |
9.1 |
1 |
16.7 |
- |
- |
|
|
Total |
17 |
9.28 ± 6.59 |
11 |
100 |
6 |
100 |
- |
- |
|
|
F = Frequency,% = Percentage |
|||||||||
Table 14: Iron status and mean serum iron concentration of the male children by age.
Table 15 shows the iron status and the mean serum iron concentration of the female children by age group. It was observed that female children in the age group of 5years had the highest serum iron concentration (51.25mg/dl), but it was not significantly different (P>0.05) from those of the other age groups. Female children aged 3years had the highest percentage (60%) of children with high iron status while 66.7% of children aged 3years had normal iron status and 16.7% from children of 4years and 5years respectively. More so, 77.8% of the children aged 3years had deficient %Tsat. However, no significant association (P>0.05) was identified between iron status and age group in the female children studied.
|
|
Serum Iron (µg/dl) |
Deficient |
Iron status Normal |
High |
X2 (P- value) |
|||||
|
Age |
N |
Mean ± SD |
F |
% |
F |
% |
F |
% |
|
|
|
2years |
- |
- |
- |
- |
- |
- |
- |
- |
1.107(0.893) |
|
|
3years |
9 |
38.22 ± 26.62 |
2 |
100 |
4 |
66.7 |
3 |
60 |
||
|
4years |
2 |
49.75 ± 27.22 |
- |
- |
1 |
16.7 |
1 |
20 |
||
|
5years |
2 |
51.25 ± 42.78 |
- |
- |
1 |
16.7 |
1 |
20 |
||
|
Total |
13 |
42.00 ± 26.86 |
2 |
100 |
6 |
100 |
5 |
100 |
||
|
TIBC |
||||||||||
|
2years |
- |
- |
- |
- |
- |
- |
- |
- |
2.046(0.359) |
|
|
3years |
9 |
403.33±43.73 |
- |
- |
5 |
83.3 |
4 |
57.1 |
||
|
4years |
2 |
413.5±64.35 |
- |
- |
1 |
16.7 |
1 |
14.3 |
||
|
5years |
2 |
472.0±87.68 |
- |
- |
- |
- |
2 |
28.6 |
||
|
Total |
13 |
415.46±53.89 |
- |
- |
6 |
100 |
7 |
100 |
||
|
percentage Saturation |
||||||||||
|
2years |
- |
- |
- |
- |
- |
- |
- |
- |
1.003(0.606) |
|
|
3years |
9 |
9.04 ± 5.45 |
7 |
77.8 |
2 |
50 |
- |
- |
||
|
4years |
2 |
11.66 ± 4.77 |
1 |
11.1 |
1 |
25 |
- |
- |
||
|
5years |
2 |
10.19 ± 7.17 |
1 |
11.1 |
1 |
25 |
- |
- |
||
|
Total |
13 |
9.62 ± 5.19 |
9 |
100 |
4 |
100 |
- |
- |
||
Table 15: Iron status and mean serum iron concentration of the female children by age.
Table 16 shows the matrix of correlations between iron assessment parameters, in children 2-5 years. The significant correlation between the parameters that assessed transferrinemia and the availability of iron for erythropoiesis demonstrates that this association was compatible with the links in the metabolic chain that make up the iron cycle in the body. The direct relationship observed between serum iron and %Tsat is also obvious, though there was no inverse relationship with TIBC statistically. This finding is plausible since %Tsat is a parameter arrived at from the relationship between serum iron and TIBC.
|
|
S.I |
TIBC |
%T Sat |
||
|
S.I |
P- value |
- |
0.694** |
0.991 |
|
|
r - value |
- |
0 |
0 |
||
|
TIBC |
P - value |
0.649** |
- |
0.561** |
|
|
r - value |
0 |
- |
0.001 |
||
|
%T Sat |
P - value |
0.991** |
0.561** |
- |
|
|
r -values |
0 |
0.001 |
- |
||
|
**Correlation is significant at the 0.01 level ,TIBC - Total Iron Binding Capacity ,%TSat- percentage transferrin saturation |
|||||
Table 16: Matrix of correlations between iron assessment parameters, in children 2-5 years old.
Table 17 shows the percentage and frequency distribution of zinc status of the preschool children. It was observed that 63.3% of the preschool children had low serum zinc concentration (54.5mg/dl) below the normal range of 65mg/dl while 36.7% had normal serum zinc concentration.
|
|
Serum Zinc Status |
|
|
F |
% |
|
|
Deficient |
19 |
63.3 |
|
Normal |
11 |
36.7 |
|
High |
- |
- |
|
Total |
30 |
100 |
|
Normal serum zinc level = 65mg/dl,F = Frequency,% = Percentage |
||
Table 17: Percentage and frequency distribution of serum zinc status of the preschool children.
Table 18 shows the zinc status and mean serum zinc concentration of the children according to sex and age group. The mean serum zinc concentration of the female children (60.00mg/dl) were not significantly higher (P>0.05) than that of the males (62.52mg/dl) even though they were below the mean value. However, the sex of the children studied did not significantly influence (P < 0.05) the zinc status. More males (63.6%) had normal zinc status than the females (36.4%). No significant difference (P>0.05) was found in the mean serum zinc concentration of the different age groups studied. However, children in the age group of 5years had the highest serum zinc concentration (61.43mg/dl) while those in the age group of 2years had the least serum zinc concentration (52.23mg/dl). About 45.5% of the children in the age group of 3years had normal zinc status. Also 27.3% of the children in the age 4years and 5years respectively had normal zinc status. However, the zinc status of the children were not significantly associated (P>0.05) with age group.
|
|
Serum Zinc (mg/dl) |
Zinc Status |
X2 (P- value) |
||||
|
Deficient |
Normal |
||||||
|
Sex |
N |
Mean ± SD |
F |
% |
F |
% |
|
|
Male |
17 |
62.52 ± 11.72 |
10 |
52.6 |
7 |
63.6 |
0.344 (0.558) |
|
Female |
13 |
60.00 ± 11.72 |
9 |
47.4 |
4 |
36.4 |
|
|
Total |
30 |
61.42 ± 11.59 |
19 |
100 |
11 |
100 |
|
|
Age |
|||||||
|
2 years |
3 |
52.23 ± 9.01 |
3 |
15.8 |
- |
- |
4.316 (0.229) |
|
3 years |
14 |
61.13 ± 13.58 |
9 |
47.4 |
5 |
45.5 |
|
|
4 years |
9 |
62.79 ± 9.49 |
6 |
31.6 |
3 |
27.3 |
|
|
5 years |
4 |
66.33 ± 9.05 |
1 |
5.3 |
3 |
27.3 |
|
|
Total |
30 |
61.43 ± 11.59 |
19 |
100 |
11 |
100 |
|
Table 18: Zinc status and serum zinc concentration of the children by sex and age group.
Table 19 shows the zinc status and mean serum zinc concentration of male children .The mean serum zinc concentration of the male children in the age group of 3years had the highest serum zinc concentration (67.41mg/dl), but it was not significantly different (P>0.05) from those of the other age groups. Male children aged 3years and 4years had the highest percentage (42.9%) of children with normal zinc status. However, no significant association (P>0.05) was identified between zinc status, and age group in the male children studied.
|
|
Serum Zinc (mg/dl) |
Zinc Status |
X2 (P- value) |
|||||
|
Deficient |
Normal |
|||||||
|
Age |
N |
Mean ± SD |
F |
% |
F |
% |
2.904 (0.407) |
|
|
2 years |
3 |
52.23 ± 9.01 |
3 |
30 |
- |
- |
||
|
3 years |
5 |
67.41 ± 14.05 |
2 |
20 |
3 |
42.9 |
||
|
4 years |
7 |
63.61 ± 10.71 |
4 |
40 |
3 |
42.9 |
||
|
5 years |
2 |
61.90 ± 10.61 |
1 |
10 |
1 |
14.3 |
||
|
Total |
17 |
62.52 ± 11.72 |
10 |
100 |
7 |
100 |
||
Table 19: Zinc status and mean serum zinc concentration of the male children with different age groups.
Table 20 shows the zinc status and mean serum zinc concentration of the female children with different age groups. The mean serum zinc concentration of the female children in the age group of 5years had the highest serum zinc concentration (70.75mg/dl), but it was not significantly different (P>0.05) from those of the other age groups. Female children aged 2 years had the highest percentage (77.8%) of children with deficient zinc status. However, there is a significant association (P < 0.05) between zinc status, and age group in the female children studied.
|
|
Serum (mg/dl) |
Zinc Status |
X2 (P- value) |
||||
|
Deficient |
Normal |
||||||
|
Age |
N |
Mean ± SD |
F |
% |
F |
% |
5.698 (0.058) |
|
2 years |
- |
- - |
- |
- |
- |
- |
|
|
3 years |
9 |
57.63 ± 12.75 |
7 |
77.8 |
2 |
50 |
|
|
4 years |
2 |
59.90 ± 3.25 |
2 |
22.2 |
- |
- |
|
|
5 years |
2 |
70.75 ± 7.42 |
- |
- |
2 |
50 |
|
Table 20: Zinc status and mean serum zinc concentration of the female children with different age groups.
Dietary pattern and factors affecting the nutritional status of the children.
Mean energy and nutrient intake of the 2-5year old children compared with FAO/WHO requirement value. It was observed that 2-5years old children took between 82.13% and 117.18% of their energy requirement daily. It showed that children within the 3 years group had 117.18% of their energy requirement while those of 2 years, 4 years and 5years had 112.06%, 82.13% and 105.93% respectively. The percentage intake of requirement for protein ranged between 81.77% and 105.4%. The 3 years group had the highest daily intake 105.4% while the 5 years group had the least (81.77%) protein daily intake.
Among the minerals studied, calcium intake ranged between 37.4% and 59.33%, iron intake ranged between 80% and 143.29% while zinc daily intake were all above the requirement. It ranges between 120.36% and 155.54%.
The vitamin intake studied showed that the intake of vitamin A studied showed that the intake of vitamin A and ascorbic acid showed high percentage of daily intake. For vitamin A the daily intake ranged between 157.39% and 193.41% while that of ascorbic acid ranged between 99% and 186.75%. The daily percentage intake of thiamine, riboflavin and niacin were all below the requirement values for their age ranges except for the pre-schoolers within the 3 years group had thiamine intake (102%) above the requirement. Thiamine ranged between 65.71% and 102%, riboflavin ranged between 23.64% and 36.25% while niacin ranged between 39.2% and 73.04% of their daily intake requirement.
Table 21 shows factors that could affect the nutritional status of the children assessed. The factors below were highly correlated to the nutritional status of the children. The factors which were identified to significantly influence (P < 0.05) the nutritional status of the children were meals eaten per day. It significantly influenced wasting and underweight in these pre-school children.
|
Variables/factors |
|||||
|
Nutritional status |
Marital status |
Household |
Meals eaten per day |
Occupation of mothers |
Educational level of mothers |
|
Wasting |
|
|
|
|
|
|
r - value |
-0.002 |
-0.03 |
0.168 |
0.003 |
0.039 |
|
P -value |
0.971 |
0.652 |
0.012 |
0.966 |
0.568 |
|
S/NS |
NS |
NS |
S |
NS |
NS |
|
Stunting |
|||||
|
r- value |
0.018 |
-0.013 |
0.022 |
0.018 |
0.082 |
|
P- value |
0.785 |
0.846 |
0.739 |
0.785 |
0.205 |
|
S/NS |
NS |
NS |
NS |
NS |
NS |
|
Underweight |
|||||
|
r- value |
-0.003 |
0.446 |
0.212 |
-0.003 |
0.117 |
|
P-value |
0.959 |
-0.022 |
0.001 |
0.959 |
0.071 |
|
S/NS |
NS |
NS |
S |
NS |
NS |
|
Correlation is significant at the 0.05level,NS-Not significant,S - Significant |
|||||
Table 21: Factors influencing the nutritional status of the children.
Conclusion and Recommendations
The use of weight for height, weight for age and height for age as indicators of nutritional status revealed that there still exist malnutrition and its associated problems in Ogugu town of Olamaboro Local Government Area of Kogi state. The high prevalence of under-nutrition and micro-nutrient deficiencies in Ogugu suggests that malnutrition is a very serious problem in this rural subset of the population. Factors like meals eaten per day, occupation, educational level with some environmental and biological factors affected the overall nutritional status of the children.
Therefore, a combined effort by the government, non-governmental organizations and the community at large is of ultimate importance in reducing the effects of under nutrition and micro-nutrient deficiencies in this area. In addition, there is need for more nutrition education programmes to enlighten people on the importance of iron and zinc in human nutrition. Nutrition surveillance needs to be done continually and information about the nutritional status of the population gathered regularly to help in proper targeting and timely interventions for other future projects. Based on these, the study recommend the following:
I.There is need to switch to the more robustly constructed and up-to-date WHO standard for assessing nutritional status of pre-school children. Otherwise, a significant proportion of wasted and stunted children who are at risk of excessive morbidity and mortality would be missed.
II.There is need for more nutrition education programmes to enlighten people on the place of zinc and iron in human nutrition.
III.There should be sponsorship for more research like this to be done in other areas using the same and population groups.
IV.There should be more government/non-governmental organization sponsored research, to be conducted from time to time, on mineral and vitamin composition of our local foods and soils especially for zinc. Deficiency of this essential trace element has been discovered that appropriate enrichment of soil with the concerned mineral if done will ensure their presence in our local diet.
References
- Blecker U, Mehta DI, Rebecca D, Melinda S, Suskind RM (2000) Nutritional problems in patients who have chronic malnutrition. Pediatrics Review. 21: 29-32.
- De Onis M, Blossner M (2003) The World Health Organization Global Database on Child Growth and Malnutrition: methodology and applications. Int J Epidemiology. 32: 518-526.
- Pollitt E, Gorman KS, Engle PL, Martorell R, Rivera J (1993) early supplementary feeding and cognition: effects over two decades. Monogr Soc Res Child Dev. 58:1-99.
- Pinstrup AP, Burger S, Habicht JP, Peterson K (1993) Protein-energy malnutrition. In: Jamison DT, Mosley WH, Measham AR, Bobadilla JL, editors. Disease control priorities in developing countries. 2nd ed. Oxford (UK): Oxford University Press, pp: 391-420.
- Muller O, Becher H, van ZAB, Y Ye, Diallo DA, et al. (2001) Effect of zinc supplementation on malaria and other causes of morbidity In West African children: randomized double blind placebo controlled trial. British Medical Journal, 322: 1567.
- Fishman S, Caulfield L, Onis M, Hyder A, Mullany L, et al. (2004) Childhood and Maternal Underweight. In Comparative Quantification of Health Risks: Global and Regional Burden of Disease Attributable to Selected Major Risk Factors. International Household Survey Network, 1: 39-162.
- Diaz JR, de LCA, Rodriguez R (2003) Micronutrient deficiencies in developing and affluent countries. European Journal of Clinical Nutrition. 57: S70-72.
- Black RE (2003) Zinc deficiency, infectious disease and mortality in the developing world. Journal of Nutrition. 133: 1485S-1489S.
- Stoltzfus RJ (2001) Iron-deficiency anaemia: re-examining the nature and magnitude of the public health problem. Summary: implications for research and programs. Journal of Nutrition. 131: 697S-700S.
- Allen LH, Gillespie SR ACC/SCN (2001) what works? A review of the efficacy and effectiveness of nutrition interventions. ACC/SCN Geneva in collaboration with the Asian Development Bank, Manila.
- Aggett PJ, Harries JT (1979) Current status of zinc in health and disease states. Arch Dis Child. 54: 909.
- Ashworth A (1998) Effects of intrauterine growth retardation on mortality and morbidity in infants and young children. European Journal of Clinical Nutrition. 52: S34-S42.
- Bates CJ,Evans PH,Dardenne M,Prentice A, Lunn PG, et.al (2004) A trial of zinc supplementation in rural Gambian children. British Journal of Nutrition. 69: 243.
- Barker DJ (2005) Fetal origins of coronary heart disease. British Medical Journal. 311: 171-174.
- Beard JL, Connor JR (2003) Iron status and neural functioning. Annual Review of Nutrition. 23: 41-58.
- Bhutta ZA, Black RE, Brown KH, Gardner JM, Gore S, et.al (1999) Prevention of diarrhoea and pneumonia by zinc supplementation in children in developing countries: pooled analysis of randomized controlled trials. Journal of Pediatrics. 135: 689.
- Black RE, Allen LH, Bhutta ZA, Caulfied LE, de Onis M, et.al (2008). For the maternal and child under nutrition study group. Maternal and child under nutrition: global and regional exposures and health consequences. Lancet 371: 243-60
- Brown KH, Wuehler SE, Peerson JM (2001) The importance of zinc in human nutrition and estimation of the global prevalence of zinc deficiency. Food and Nutrition Bulletin.
- Brown KH, Peerson JM, Juan Rivera, Lindsay HA (2002) Effect of supplemental zinc on the growth and serum zinc concentrations of pre-pubertal children: a meta-analysis of randomized, controlled trials. American Journal of Clinical Nutrition. 75: 1062.
- Castillo-Duran C, Rodríguez A, Venegas G, Alvarez P, Icaza G (1995) Zinc supplementation and growth of infants born small for gestational age. Journal of Pediatrics. 127: 206.
- Ceesay SM, Prentice AM, Cole TJ, Foord F, Weaver LT, et al. (1997) Effects on birth weight and perinatal mortality of maternal dietary supplements in rural Gambia: 5-year randomised controlled trial. British Medical Journal. 315: 786-790.
- CEC (2011) Report of the scientific committee for food, 31st series.
- Chandra RK (1984) Excessive intake of zinc impairs immune responses. Journal of American Medical Association. 252: 1443.
- Conrad ME, Umbreit JN (1993) A concise review: Iron absorption - the mucin-mobilferrin-integrin pathway. A competitive pathway for metal absorption. American Journal of Hematology. 42: 67.
- Zeigler EE, Filer LJ (1996) Present Knowledge in Nutrition. Washington DC. ILSI Press.
- Duchateau J, Delepesse G, Vrijens R, Collet H (1981) Beneficial effects of oral zinc supplementation on the immune response of old people. American Journal of Medicine. 70: 1001.
- Ene-Obong HN (2001) Eat right Calabar. The University of Calabar Press.
- Energy and Protein requirements (1985) Report of a joint FAO/WHO/UNU Expert Consultation.Geneva: WHO. Technical report series. 724.
- Food and Nutrition Board, Institute of Medicine (2002) Dietary reference intakes of vitamin A, vitamin K, arsenic, bororn, chromium, copper, iodine, iron, manganese, molybdenum, nickel, silicon and zinc. Washington DC. National Academy Press.
- Fosmire GJ (1990) Zinc toxicity. American Journal of Cinical Nutrition. 51: 225.
- Gillespie S, Johnston JL (2007) Expert Consultation on Anaemia Determinants and interventions. Ottawa: Micronutrient Initiative.
- Golden MH, Golden BE (1981) Effect of zinc supplementation on the dietary intake, rate of weight gain and energy cost of tissues in children recovering from severe malnutrition. American Journal of Clinical Nutrition. 34: 900-908.
- Grantham-McGregor S (1995) A review of studies of the effect of severe malnutrition on mental development. Journal of Nutrition 125: 2233S-238S.
- Hambidge KM (1986) Zinc deficiendy in the weanling-how important? Acta Pediatric Scandinarian. PP: 323-352.
- Ince E, Kemahl? S, Uysal Z, Akar N, Cin S, et al. (1994) Mild zinc deficiency in preschool children. Journal of Trace Element Experimental Medicine. 7: 135-141.
- Joseph KS (2002) Validating the foetal origins hypothesis: An epidemiologic challenge. In: Public health issues in infant and child nutrition. PP: 199-216.
- Kappas A, Drummond GS, Galbraith RA (1993) Prolonged clinical use of a heme oxygenase inhibitor: hematological evidence for an inducible but reversible iron-deficiency state. Pediatrics. 91: 537-539.
- King JC (1990) Assessment of zinc status. Journal of Nutrition. 120:1474-79.
- Levin HM, Pollitt E, Galloway R, McGuire J (2003) Micronutrient deficiency disorders. In: Jamison DT, Mosley WH, Measham AR, Bobadilla JL, editors. Disease control priorities in developing countries. 2nd ed. Oxford (UK): Oxford University Press. pp. 421-451.
- Lonnerdal B (2000) Dietary factors influencing zinc absorption. Journal of Nutrition, 130: 1378S-1383S.
- Muir A, Hopfer U (1985) Regional specificity of iron uptake by small intestinal brush-boarder membranes from normal and iron deficient mice. Gastrointestinal and Liver Pathology: 248: G376-379.
- Murray CJL, Lopez AD (2010) The Global Burden of Disease. Cambridge MA: Harvard University Press.312.
- Müller O, Garenne M, Kouyaté B,Becher H (2003) The association between protein – energy malnutrition, malaria morbidity and all-cause mortality in West African children. Tropical Medical Internal Health. 8: 507-511.
- Okorigwe FC, Okeke EC (2007) Consumption pattern and contribution of zinc and anti-oxidants vitamin A and C rich foods to the mean daily nutrient intake of 2-5 year old children in two rural towns in Nigeria. Agricultural Science Journal of Tropical Agriculture, Food Environment and Extension. 6: 39-47.
- O’Brien KO, Zavaleta N, Caulfield LE, Wen J, Abrams SA (2000) Prenatal iron supplements impair zinc absorption in pregnant Peruvian women. Journal of Nutrition. 130: 2251-2255.
- Pelletier D, Frongillo EA, Schroeder D, Habicht JP (2003) the effects of malnutrition on child mortality in developing countries. Bulletin WHO. 7: 443-448.
- Prasad A S, Meftah S, Abdallah J, Kaplan J, Brewer GJ, et al. (2000) Serum thymulin in human zinc deficiency. Journal of Clinical Investment. 82: 1202-1210.
- Prasad AS (2004) Discovery of human zinc deficiency and studies in an experimental model. American Journal of Clinical Nutrition. 53: 403.
- Prasad AS, Brewer GJ, Schoomaker EB, Rabbani P (2004) Hypocupremia induced by zinc therapy in adults. Journal of American Medical Association.240: 2166-2168.
- Sandstrom B (2001) Micronutrient interactions: effects on absorption and bioavailability. British Journal of Nutrition. 85: S181-S185.
- Sazawal S, Black RE, Menon VP, Dinghra P , Caulfield LE, et al. (2001) Zinc supplementation in infants born small for gestational age reduces mortality: a prospective, randomized, controlled trial. Pediatrics. 108: 1280-1286.
- Shankar AH, Genton B, BaisorM , Paino J, Tamja S, et al. (2000) The influence of zinc supplementation on morbidity due to plasmodium falciparum: a randomized trial in preschool children in Papua New Guinea. American Journal of Tropical Medicine and Hygiene. 62: 663-669.
- UNICEF (2012) the state of the world’s children 1998. Oxford University Press, Walton Street, oxford.
- United Nations Administrative Committee on Coordination, Standing Committee on Nutrition (ACC/SCN) (2014) Fourth Report on the World Nutrition. Geneva: ACC/SCN.
- Van Wouwe JP (1989) Clinical and laboratory diagnosis of acrodermatitis enteropathica. European Journal of Pediatrics. 149: 2-8.
- Wallock L, King JC, Hambidge KM, English-Westcott JE, Pritts J (1993) Meal Induced changes in plasma, erythrocyte, and urinary zinc concentrations in adult women. American Journal of Clinical Nutrition, 58:695-701.
- WHO, FAO, IAEA (2012) Trace elements in human health and nutrition. WHO, Geneva.
- World Health Organization (1995) Physical status: the use and interpretation of anthropometry. WHO technical report 854: 1-452.
- World Health Organization (2012) Division of Health Situation and Trend Assessment. Catalogue of health indicators: a selection of important health indicators recommended by WHO programmes. Geneva: World Health Organization.1-5.
- WHO (2018) Global database on child growth and malnutrition. WHO, Geneva in ACC/SCN 4th report on the World nutrition situation.
- WHO (2006) WHO Child Growth Standards: Length/height-for-age, weight-for-age, weight-for-length, weight-for-height and body mass index-for-age: Methods and development. World Health Organisation: Geneva.
- WHO (2012).WHO Global Database on Child Growth and Malnutrition. Available at: www.who.int/nutgrowthdb. Accessed 20 February.
- Yip R (2005) Iron deficiency: Contemporary scientific issue and international programmatic approaches. Journal of Nutrition, 124: 1479S-1490S.
Citation: Victor A and Sunday SU (2023) Dietary Pattern, Biochemical, and Anthropometric Indices of Preschool Children Age 2-5years in Ogugu Olamaboro Local Government of Kogi State. J Obesity Weight Loss 5: 011.
Copyright: © 2023 Alex Victor, et al. This is an open-access article distributed under the terms of the Creative Commons Attribution License, which permits unrestricted use, distribution, and reproduction in any medium, provided the original author and source are credited.