Does Mesenchymal Stem Cell therapy affect clinical outcomes in COVID-19-associated ARDS?
*Corresponding Author(s):
Rabia YilmazDepartments Of Anesthesiology And Reanimation, Bakirkoy Dr. SadiKonukTrainig And Research Hospital, Istanbul, Turkey
Email:drrabiayilmaz@gmail.com
Abstract
Objective: To retrospectively investigate the effects of intravenous mesenchymal stem cell therapy on mortality, ventilator-free days, acute phase reactants, and respiratory parameters in moderate-severe ARDS patients dependent on mechanical ventilation.
Methods: A total of 82 patients were included in the study. Standard treatment was applied to 41 patients. Stem cell therapy was applied to 41 patients in addition to the standard treatment. All patients were mechanically ventilated and intubated.The COVID-19 related biochemical parameters, mechanical ventilator and respiratory data of the patients were examined retrospectively.Patients were followed for 30 days or until they were externed from the intensive care unit or died.
Results: There was a significant difference in the 30-day mortality between the 2 groups [median survival: 25.2 vs 12.9 days, hazard ratio:0.30 (0.16 to 0.57), P=0.0002]. There was a difference in ICU mortality but it was not statistically significant (P>0.05). Total ICU mortality was calculated as 20/41 (48.8%) in the stem cell group and 28/41 (68.3%) in the control group, P=0.073). A significant decrease was observed in acute phase reactants (ferritin, d-dimer, CRP) compared to the control group after stem cell treatment. In addition, LDL, CK and AST values associated with clinical worsening were also significantly lower after stem cell therapy compared to the control group.
Conclusion: As a result of the study, stem cells may be promising for the treatment of COVID-19 pneumonia in intensive care patients with severe ARDS in terms of safety and improvement of clinical response.
Keywords
ARDS; COVID-19; Critical Care; Mesenchymal; Stem Cell
Introduction
A new worldwide pneumonia pandemic, caused by SARS-CoV-2, leads to asymptomatic or mild upper respiratory tract infection or severe pneumonia, Acute Respiratory Distress (ARDS), multi-organ involvement and death. Despite significant advances in supportive treatment techniques such as mechanical ventilation, the incidence and mortality of ARDS remains high [1]. There is a great need for a safe and effective treatment for patients infected with COVID-19, especially for severe cases. Mesenchymal Stem Cells (MSC) are widely used in cell-based therapy, from basic research to clinical research [2, 3] MSCs are thought to have wide clinical applications, including the treatment of ARDS. MSCs have extensive bioactivity, including repair, immunomodulation, increased alveolar fluid clearance, and regulation of pulmonary vascular endothelial permeability [4]. Because stem cells are resistant to tissue damage, promote tissue repairand have immunomodulatory effects, they are promising for the treatment of pneumonia caused by respiratory viruses [5]. A clinical trial involving a patient with severe COVID-19 pneumonia demonstrated the great potential of MSCs in the treatment of patients with severe ARDS [6].
In this study, the effect of intravenous MCS treatment on mortality, length of stay in the intensive care unit, duration of stay on the ventilator and ventilator free days were investigated for COVID-19 ARDS patients hospitalized in the intensive care unit. As a secondary outcome, the effects on infection markers, acute phase reactants, blood gas exchange and respiratory parameters were examined.
Patients And Methods
Study design
This retrospective study was carried out in Bakirköy Dr. SadiKonuk Educationand Research Hospital. The duration of the study was determined as 1 year and it was aimed to compare the groups hospitalized in our intensive care unit at the same time, receiving and not receiving stem cells.
Ethical consideration
The study protocol was approved by the Bakirköy Dr. SadiKonuk Training and Research Hospital Clinical Research Ethics Committee (no: 2021/386).In addition, permission was obtained from the Ministry of Health (no: 56733164/203). Written consent was given byall patients or their family members for the collection, analysis, and publication of outcome data. For each stem cell application, approval for off-label application was obtained from the Ministry of Health.
Patients
The diagnosis of COVID-19 pneumonia was made with PCR positivity and was supported by computer tomography imaging. Patients were followed for 30 days or until they were externed from the intensive care unit or died. Patients over 18 years of age, with moderate-severe ARDS and on mechanical ventilation were included in the study. The diagnosis of ARDS was made according to the Berlin criteria [7]. Pregnant, allergic and cancer patients were excluded from the study.
Patients were divided into two groups: The control group (n=41) recruited patients who were intubated and followed in the ICU under the standard treatment algorithm; the MSC group (n=41): Patients who were intubated and treated with intravenous MSCs in the ICU in addition to standard therapy.
Data collection
Demographic data of patients diagnosed with COVID-19 and moderate to severe ARDS, registered with 'ImdSoft-Metavision/QlinICU Clinical Decision Support Software' in the Anesthesiology and Reanimation Intensive Care Unit, were recorded. Age and Chronic Health Evaluation(APACHE II), Sequential Organ Failure Assessment(SOFA) and prognostic scores such as Pneumonia Severity Index (PSI) andCharlson Comorbidity Index (CCI) were recordedas well. The mean values of the COVID-19 laboratory panel and mechanical ventilator parameters on the day of admission, 7 days after stem cell therapy or 7 days after hospitalization in the control group, as well as average during hospitalization or 30 days were obtained with Structured Query Language (SQL) queries.
Treatment
The patients were treated under the standard treatment algorithm; antivirals (Favipiravir, 2x1600 mg loading dose and 2x600 mg maintenance), dexamethasone (1x6mg IV 5-10 days), and enoxaparin (2x0.6 mL) antibiotherapyif necessary[8].
Patients in group MSC received 3x10⁶ cells/kg MSC by intravenous infusion, three times consecutively on day 0, day 3, and day 6, in addition to standard therapy.Stem cell therapy was included as a treatment recommendation in the current Ministry of Health guide[8].As cell therapy medicinal products, all samples of Wharton Jelly-derived mesenchymal stem cells (WJ-MSCs) were isolated, expanded, analyzed and prepared in the cGMP-certified facility. Quality control and quality assurance for the production of these cells was carried out according to the standards of the Turkish Medicines and Medical Devices Agency. All patients were mechanically ventilated and ventilated in accordance with lung-protective mechanical ventilator strategies. IfPaO2/FiO2 was less than 150, patients were placed in the prone position. The patients were followed in the prone position for 16-24 h.
Statistical analysis
GraphPad Prism (v 5.01) program was used for statistical analysis. The homogeneity of the variables was determined by the Shapiro-Wilk normality test. The Mann Whitney U test was used to calculate the median and interquartile range (IQR) values of the inhomogeneous parameters inthe two groups. Frequency distribution and percentages forgender, survival and non-survival variables inthe groups were compared with Chi-square test. The relationship between survival and non-survival and duration of 30-day intensive care unit, length of stay on mechanical ventilator, and ventilator wereanalyzed by Cox regression analysis.APACHE 2 score, SOFA score and CCI values were compared with Mann Whitney U test. The significant level of this study was set as a=0.05.
Results
There was no difference between the ages inboth groups.(p=0.4)Since the number of male patients was higher in the stem cell group(20% vs 46% p=0.01), height(p=0.06), weight(p=0.001), PBW(p=0.001)and BMI(p=0.01)index in Table. 1
|
Patient characteristics
|
Stem cell group (n=41) |
Control group (n=41) |
c2/U |
P value |
|
Gender female, n (%) |
8 (20%) |
19 (46%) |
6681 |
.01 |
|
Age |
58 (50.5 to 66.5) |
61 (48 to 71.5) |
766 |
.4 |
|
Size |
175 (170 to 179) |
165 (160 to 172) |
475 |
.006 |
|
Actualweight |
88 (80 to 94) |
77 (67.5 to 82.5) |
408 |
.0001 |
|
PBW |
70 (66 to 74.5) |
61 (52.5 to 68) |
493 |
.0001 |
|
Ideal weight |
79 (74 to 84) |
71 (65 to 77) |
476 |
.0007 |
|
BMI |
28.4 (26.1 to 31.2) |
26.9 (24.8 to 29.2) |
588 |
.01 |
|
CCI |
3 (1 to 4) |
4(1 to 6) |
588 |
.2 |
|
PSI |
105 (79 to 200) |
126 (107 to 149) |
460 |
.0002 |
|
Apache2 score |
18 (12 to 24) |
23 (16 to 27) |
611 |
.03 |
|
Apache2_Mort |
29 (15 to 50) |
46 (23 to 60) |
611 |
.03 |
|
SOFA score |
8 (5.5 to 11) |
9 (6 to 12) |
671 |
.1 |
Table 1: Patient characteristics.
Age, height, gender, weight, PBW, BMI, APACHE 2 score, SOFA score and CCI values of both groups were compared with Mann Whitney U test. PBW: Predicted body weight, CCI: Charlson comorbidity index, PSI:Pneumonia Severity Index.
There was no statistical difference between the RR(day 1,7th day,avg. >7 days) (p=0.18,p=0.40,p=0.07),Ppeak(p=0.5,p=0.7,p=0.8)WOBv(p=0.7,p=0.9,p=0.7),I/E(p=0.05,p=0.9,p=0.1), DP(p=0.5,p=0.6,p=0.8), FiO2(p=0.6,p=0.5,p=0.6), PaO2(p=0.7,p=0.6,p=0.6) and Horowitz(p=0.9,p=0.4,p=0.9) values of both groups.
TV was higher(531.8 vs 497.8, p=0,02) because PBW values were higher in the stem cell group. In addition, PEEP values (at entry(8.7vs 8, p=0.01) and 7th day(8.5vs 7.7,p=0.08) were also calculated to be higher. Since TV and PEEP were higher in the stem cell group, MPrs values were significantly higher (MPrs avg. >7 days, 18.79 vs 16.86, p=0.02) in the stem cell group. The median, interquartile IQR values and P values of respiratory parameters of both groups are given in Table 2.
|
Respiratory and blood gas parameters
|
Stem cell group (n=41) |
Control group (n=41) |
P value |
|
MPrs day 1 |
18.3(15.2 to 19.4) |
16.4(14.8 to 19.5) |
.3 |
|
MPrs 7th day |
18.13(14.58 to 19.92) |
15.7(13.2 to 19.8) |
.17 |
|
MPrs avg. >7 days |
18.79 (15.75 to 21.65) |
16.86 (14.34 to 19.93) |
0.02 |
|
RR day 1 |
14 (13.5 to 14.9) |
14.5(13.7 to 15.3) |
.18 |
|
RR mean 7 days |
13.6 (14.6 to 15) |
14.9 (13.6 to 15.1) |
.40 |
|
RR mean >7 days |
16.83(15.61 to 19.31) |
16.17 (14.99 to 17.62) |
.07 |
|
PEEP day 1 |
8.7 (8.1 to 9.7) |
8 (7.2 to 8.9) |
.01 |
|
PEEP day 7 |
8.5 (7.9 to 9.8) |
7.7 (6.8 to 8.6) |
.008 |
|
PEEP mean >7 days |
8.2 (7.4 to 9.06) |
7.8 (7 to 8.7) |
.09 |
|
TV day 1 |
531.8 (495.3 to 566.8) |
497.8(450.6 to 542.2) |
.02 |
|
TV 7th day |
531.8(481.3 to 579.5) |
485.7(445.4 to 537.3) |
.01 |
|
TV avg. >7 days |
549.9(495.9 to 624.2) |
501.1 (453.4 to 591.1) |
.02 |
|
Ppeak day 1 |
23.6(20.8 to 26.7) |
24.1(20.7 to 26.2) |
.5 |
|
Ppeak 7th day |
23.8(20.2 to 26.6) |
23.1(20 to 27) |
.7 |
|
Ppeak avg. >7 days |
23.5 (20.3 to 27.3) |
22.9 (20.5 to 26.4) |
.8 |
|
WOB day 1 |
1.2(1 to 1.4) |
1.2(1 to 1.4) |
.7 |
|
WOB 7th day |
1.2(1 to 1.4) |
1.2(1 to 1.3) |
.9 |
|
WOB avg. >7 days |
1.2 (1 to 1.4) |
1.2 (1 to 1.4) |
.7 |
|
I/E ratio 1st day |
0.8 (0.6 to 0.9) |
0.7(0.6 to 0.8) |
.05 |
|
I/E ratio 7th day |
0.8 (0.6 to 0.9) |
0.8 (0.6 to 0.9) |
.9 |
|
I/E ratio mean >7 days |
0.8 (0.7 to 0.9) |
0.7 (0.6 to 0.9) |
.1 |
|
DP day 1 |
14.7 (13.2 to 17.4) |
15.7(12.8 to 17.5) |
.5 |
|
DP 7th day |
15.2(12 to 17.6) |
15 (12.8 to 18.6) |
.6 |
|
DP avg. >7 days |
15.2 (12.6 to 18) |
15.1 (13.2 to 18.2) |
.8 |
|
FiO2 day 1 |
49.9(44.9 to 56.3) |
47.3(41 to 59.4) |
.6 |
|
FiO2 7th day |
47.9(40.8 to 54.1) |
47.4(37.6 to 57.4) |
.5 |
|
FiO2 mean >7 days |
48 (42 to 53) |
47 (41 to 59) |
.6 |
|
PaO2 day 1 |
83.2(77.2 to 98.8) |
85.6(77.3 to 99) |
.7 |
|
PaO2 7th day |
81.9(76 to 100.8) |
87.7(76.3 to 98.6) |
.6 |
|
PaO2 mean >7 days |
86 (79 to 95) |
86 (80 to 103) |
.6 |
|
Horowitz day 1 |
176 (147 to 222) |
180 (139 to 250) |
.9 |
|
Horowitz day 7 |
178(150 to 204) |
185 (143 to 267) |
.4 |
|
Horowitz rate mean >7 days |
186.1 (164.5 to 231.5) |
193.1 (142.5 to 270.7) |
.9 |
Table 2: Respiratory and blood gas parameters.
Respiratory system mechanical power (MPrs), respiratory rate (RR), positive end-expiratory pressure (PEEP), tidal volume (TV), minute volume (MV), peak inspiratory pressure (Ppeak) work of breathing (WOB), inspiratory expiration ratio (I/E), driving pressure (DP), fractionated inspiratory oxygen percentage, arterial partial oxygen pressure (PaO2) and Horowitz values of both groups.
The differences between the mean values of CK, D-dimer, Glu, Hct, AST, ALT, INR, and creatinine at day 1 and after day 7 in both groups were not statistically significant. AST(71.7 vs 120,p=0.03) CK(474.9vs 538,p=0.03), D-dimer(1.6 vs 2.5,p=0.0008), fibrinogen(436.5 vs 650,p=0.001) and LDH(447.5 vs 540,p=0.03) values on the 7th day were calculated to be lower in the stem cell group than the control group. The median, interquartile range (IQR) values and P values of the parameters described above are shown in Table 3.
|
Hemogram and biochemical parameters
|
Stem cell group (n=41) |
Control group (n=41) |
U |
P value |
|
CK day 1(U/L) |
378(112.3 to 547) |
370(77.5 to 435) |
743 |
.3 |
|
CK day 7 |
474.9(139.7 to 474.9) |
538(386.5 to 538) |
608 |
.03 |
|
CK avg. >7 days |
213 (105 to 300) |
204 (78 to 403) |
735 |
.8 |
|
AST day 1(U/L) |
78.5 (46.9 to 98) |
60(42 to 111) |
806 |
.7 |
|
AST 7th day |
71.7(50.5 to 99.6) |
120 (56 to 120) |
604 |
.03 |
|
AST avg. >7 days |
62 (42 to 97) |
77 (45 to 138) |
706 |
.2 |
|
ALT 1st day (IU/L) |
73.5(44.6 to 108.5) |
65.5(40.5 to 80) |
592 |
.09 |
|
ALT 7th day |
76.8(46.8 to 113.1) |
85(38.3 to 85) |
741 |
.3 |
|
ALT avg. >7 days |
69 (52 to 106) |
48 (31 to 120) |
671 |
.1 |
|
LDH day 1(U/L) |
491(375.8 to 576.4) |
450.3(328.5 to 611.3) |
789 |
.6 |
|
LDL day 7 |
447.5(358.8 to 480.5) |
540(381 to 540) |
607 |
.03 |
|
LDH avg. >7 days |
429 (333 to 520) |
437 (318 to 607) |
748 |
.4 |
|
D-dimer day 1(µg, FEU/ml) |
1.9(0.7 to 2.3) |
1.8(0.8 to 4.4) |
728 |
.2 |
|
D-dimer 7 days |
1.6 (1.2 to 1.6) |
2.5(1.6 to 2.5) |
480 |
.0008 |
|
D-dimer avg. >7 days |
1.6 (0.9 to 2.6) |
1.7 (1 to 4) |
634 |
.2 |
|
INR day 1 |
1.1(1 to 1.2) |
1.2(1 to 1.3) |
626 |
.05 |
|
INR 7th day |
1.1(1 to 1.1) |
1.2(1.1 to 1.2) |
556 |
.08 |
|
INR avg. >7 days |
1.1 (1 to 1.2) |
1.2 (1 to 1.3) |
641 |
.1 |
|
Creatinine day 1(mg/dL) |
0.8 (0.6 to 1.1) |
1.1(0.7 to 1,5) |
624 |
.05 |
|
Creatinine day 7 |
0.8 (0.6 to 0.9) |
0.9 (0.5 to 1.2) |
572 |
.01 |
|
Creatinine avg.>7 days |
0.8 (0.5 to 1.1) |
1.1 (0.6 to 1.8) |
624 |
.06 |
|
Fibrinogen (mg/dL) day 1 |
461.9(406.7 to 527) |
588(445.8 to 701.5) |
530 |
.004 |
|
Fibrinogen 7 days |
436.5 (374 to 464.8) |
650(594 to 680) |
280 |
.0001 |
|
Fibrinogen avg. >7 days |
454 (381 to 549) |
583 (446 to 675) |
473 |
.004 |
|
Glucose day 1(mg/dL) |
170.2(137.7 to 199) |
160(133.3 to 220) |
829 |
.9 |
|
Glucose 7 days |
166.8(128.7 to 197.8) |
150(142.6 to 181.6) |
760 |
.4 |
|
Glucose Avg. >7 days |
152 (128.8 to 181.7) |
160.7(124.2 to 214.7) |
765 |
.6 |
Table 3: Biochemical parameters.
The differences between the WBC, Hb, Hct, Neu, Plt, and Procalcitonin values of both groups were not statistically significant. While number(1.1 vs 0.8,p=0.04) and percentage of lymphocytes(9.8 vs 7.1,p=0.01)were higher in the stem cell group than in the non-stem cell group,ferritin(707.8 vs 926.4,p=0.05) CRP(82 vs 145,p=0.001) were lower. The median, interquartile range (IQR) values and P values of the parameters described above are shown in Table 4.
|
Hemogram and biochemical parameters
|
Stem cell group (n=41) |
Control group (n=41) |
U |
Pvalue |
|
|
|
|
|
|
|
WBC Day 1(10e3/uL) |
14.9(9.2 to 16.2) |
13.2(10.5 to 18.6) |
765 |
.4 |
|
Wbc Day 7 |
15.4(10.3 to 15.6) |
16.3(11.3 to 19.3) |
692 |
.2 |
|
Wbc mean >7 days |
14 (10.2 to 16.2) |
13.2 (9.5 to 20.3) |
805 |
.7 |
|
Lym day 1 |
1.1(0.8 to 1.4) |
0.8 (0.5 to 1.1) |
637 |
.04 |
|
Lym 7th day |
1.1(0.9 to 1.4) |
1 (0.5 to 1.1) |
555 |
.008 |
|
Lym avg. >7 days |
1.2 (0.8 to 1.6) |
0.8 (0.6 to 1.2) |
575 |
.01 |
|
Lym % day 1 |
9.8 (6.3 to 11.7) |
7.1 (4.4 to 9.2) |
599 |
.01 |
|
Lym % 7th day |
10.2(6.8 to 12.6) |
7.7(3.4 to 8.6) |
550 |
.007 |
|
Lym_% avg >7 days |
10 (5.9 to 14.5) |
7.3 (4.3 to 10.3) |
595 |
.02 |
|
Neu 1st day |
12.3 (7 to 14) |
11.8(9 to 17.4) |
743 |
.3 |
|
Neu Day 7 |
13.2(8.1 to 13.5) |
14.5 (9 to 17.3) |
697 |
.1 |
|
Neu avg. >7 days |
11 (7.9 to 14) |
11.5 (8.2 to 18) |
764 |
.4 |
|
Neu_% day 1 |
84(80 to 88.1) |
88(83 to 91) |
608 |
.03 |
|
Neu_% day 7 |
82.2(78.9 to 87 |
86 (85 to 93) |
491 |
.001 |
|
Neu_% avg >7 days |
81 (75.2 to 87.6) |
88.1 (81.5 to 91.2) |
546 |
.006 |
|
Hct 1st day(%) |
35.5(32.1 to 39.4) |
31.6 (28.2 to 35.6) |
507 |
.002 |
|
Hct 7th day |
34.8(31.8 to 36.2) |
30(27.8 to 31.9) |
297 |
.0001 |
|
Hct avg. >7 days |
33.2 (29.9 to 34.8) |
30.7 (27.3 to 33.8) |
623 |
.04 |
|
Hgb 1st day(g/dL) |
11.4(10.2 to 12.7) |
10.4(9.1 to 11.4) |
554 |
.008 |
|
Hgb 7th day |
11(10.2 to 11.4) |
9.8 (9 to 10.4) |
385 |
.0001 |
|
Hgb avg. >7 days |
11(10.0 to 11.2) |
9.6 (8.8 to 10.2) |
687 |
.0001 |
|
Plt day 1(10e3/uL) |
287.5(212.5 to 367.5) |
237.3(181. 8 to 337.6) |
699 |
.1 |
|
Plt 7th day |
318.2(269.7 to 358.5) |
252(193.5 to 277.8) |
491 |
.001 |
|
Plt avg. >7 days |
249 (207 to 326) |
258 (164 to 330) |
812 |
.7 |
|
CRP 1st day(mg/L) |
82(28.6 to 115.2) |
145 (76 to 198) |
487 |
.001 |
|
CRP 7th day |
65 (15 to 98.7) |
140 (92.5 to 150.1) |
371 |
.001 |
|
CRP avg. >7 days |
91 (31 to 129) |
149 (76 to 196) |
460 |
.007 |
|
Procalcitonin1st day(ng/mL) |
0.4(0.1 to 1.4) |
1(0.4 to 4.4) |
532 |
.004 |
|
Procalcitonin 7th day |
0.3(0.1 to 1.4) |
1.9(0.5 to 4.4) |
412 |
.001 |
|
Procalcitonin approx. >7 days |
0.7 (0.1 to 1.9) |
1.3 (0.4 to 4.5) |
623 |
.06 |
|
Ferritinday 1(μg/L) |
707.8(374.1 to 819.7) |
926.4(400 to 1909) |
637 |
.05 |
|
Ferritin day 7 |
606.1(430.1 to 736.1) |
5023(414.3 to 6000) |
472 |
.0006 |
|
Ferritin avg. >7 days |
634 (349 to 985) |
845 (400 to 2334) |
608 |
.06 |
Table 4: Hemogram and biochemical parameters.
In the stem cell group, survival was ensured in 21 (51.2%) and 20 died (48.8%). Inthe control group, survival was ensured for 13 (31.7%) and 28 cases died (68.3%). The differences calculated in terms of intensive care mortality in the two groups were not statistically significant (P=0.073).
The two groups were compared with Cox regression in terms of 30-day survival and non-survival analysis, length of stay in intensive care unit, length of stay on mechanical ventilator and number of days without ventilator.
Median survival, hazard ratio and p values were calculated as 25.2 vs 12.9 days, 0.30 (0.16 to 0.57), p= 0.0002 (Figure 1-A); 16.8 vs 9.6 days, 0.32 (0.16 to 0.58), P=0.0003 (Figure 1-B); and 6.8 vs 2.8 days, 0.59 (0.33 to 1.05), p= 0.07 (Figure 1-C) respectively.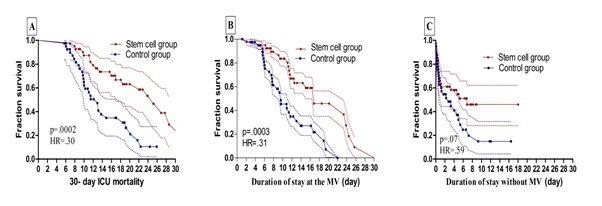 Figure 1: A:30-day ICU mortality difference between groups, B:The duration of the groups staying on mechanical ventilator for 30 days, C:The duration of the groups staying without mechanical ventilator for 30 days.
While the differences between the duration of stay in the intensive care unit and on the ventilator were statistically significant, the differences between the numbers of days without a ventilator were not statistically significant.
Discussion
The safety of MSC transplantation was described in ARDS clinical studies [3,9]. No serious side effects were observed in studies evaluating the safety of MSC treatment forCOVID-19 related ARDS [6,10]. In our study, we retrospectively analyzed COVID-19-related ARDS patients and did not find any serious side effects. When we evaluated the patients in terms of mortality, which is the primary outcome of our study, we found that the MSC group had statistically significantly lower mortality for 30-day mortality (median survival, hazard ratio and p values are 25.2 vs 12.9 days, 0.30 (0.16 to 0.57), respectively, p= 0.0002). We also found this difference for total mortality, but it was not statistically significant (MCS group 48.8%, control group 68.3%). In our study, the total mortality in the intensive care unit was 58.55%. In the study reported by Yang X et al., it wasestimated that mortality rates are as high as 60-79% in patients requiring non-invasive oxygen support [11]. In another study,Wu C et al. reported 52.4% mortality in patients with COVID-19 and ARDS [12].In the study reported by Giacomo Lanzoni et al. 28 days after the last infusion, patient survival was 91% in the MSC group and 42% in the control group [13].Mortality in our study is similar to the literature. In our study, while there was no difference between SOFA and CCI scores, which are indicators of mortality at the beginning for the groups, APACHE 2 and PSI scores were higher in the control group.
Independent risk factors associated with mortality include advanced age, male gender, FiO2, high PEEP or low PaO2:FiO2 ratio, chronic obstructive pulmonary disease, hypercholesterolemia, and type 2 diabetes [14]. In our study, there was no difference between the groups in terms of age, Horowitz, Fio2, PEEP, comorbidities (CCI) and other respiratory parameters (respiratory rate, Ppeak, WOB, DP, PaO2). The number of male patients in the stem cell group wasstatistically higher, and associated with high values forMPrs, TV and MV. The high density of male patients in the stem cell group may be related to the high mortality in the intensive care unit. It is thought that the elevation in PEEP and BMI worsens COVID-19 outcomes in the UC-MSC treatment group [14-16]. CRP, liver enzymes, ferritin, D-dimer elevation, low leukocyte and lymphocyte counts are used forthe diagnosis of COVID-19 patients as well as for the determination of prognosis [17].
In our study, a significant decrease was observed in CK, LDL, AST, ferritin, and d-dimer values in the stem cell group on the 7th day after stem cell administration compared to the control group. The CRP level was also low in the stem cell group at admission, but it was lower than the control group atthe 7th day follow-up.
Many studies revealed that treatment with MSC reduces CRP levels and proinflammatory cytokines and chemokines such as IL-6 and TNF-α [6,18,19]. A study by Changsha also observed that LDH is an important biomarker for disease severity. In this study, LDH was significantly elevated in severe COVID-19 patients [20]. In our study, while LDH levels were similar in both groups at the beginning, by the 7th day after stem cell administration mean values were significantly lower in the stem cell group. Likewise, CK and AST values, which can be associated with disease severity and increase secondary to cell destruction, were also significantly lower after stem cell use.
UC-MSCs may have beneficial effects in severe COVID-19 patients by modulating CRP and serum ferritin plays an important role in the production of d-dimer proinflammatory cytokines and act as acute phase reactants,altering immune responses and the immunopathogenic cytokine storm [6]. In the study by Sengupta et al., a significant decrease was observed in acute phase reactants in patients given stem cells [10]. A study in Wuhan, China, found a strong association with serum ferritin as a marker for severe disease [21]. In our study, while ferritin levels were similar between the groups at the beginning, they were significantly lower in the stem cell group at follow-up.
Most of the studies focused on investigating the clinical features and the role of biomarkers in predicting the severity of COVID-19 and found D-dimer to be an effective predictor, while some associated it with increased mortality and ARDS [22].In our study, while there was no difference in d-dimer level between the groups at the beginning, a significant decrease was observed after stem cell therapy.
In our study, the decrease in acute phase reactants after stem cell administration was statistically significant compared to the control group.
There are several limitations of our study. Firstly, due to the retrospective nature of our study and the fact that it progressed under pandemic conditions, there may be problems in terms of group randomization. Secondly, the study of 82 patients includes limitations of sample size and potential bias. Thirdly, secondary infection and thrombotic conditions that may affect mortality werenot described in detail. Fourthly, no serious side effects that could be associated with stem cells were observed in the patients, but this wasnot statistically examined.
Conclusion
The absence of serious side effects and the presence of clinical response indicate that stem cells may be promising for the treatment of COVID-19 pneumonia in intensive care patients with severe ARDS. Prospective randomized controlled studies are needed to support our findings.
References
- Huang C, Wang Y, Li X (2020) Clinical features of patients infected with 2019 novel coronavirus in Wuhan China published correction appears in Lancet. Lancet 395:497-506.
- Connick P, Kolappan M, Crawley C, Webber DJ, Patani R, et al. (2012) Autologous mesenchymal stem cells for the treatment of secondary progressive multiple sclerosis an open label phase 2a proof of concept study. Lancet Neurology 11: 150-156.
- Wilson JG, Liu KD, Zhuo NJ, Caballero L, McMillanLeng Z, et al. (2014) Mesenchymal Stem stromal Cells for Treatment of ARDS A Phase 1 Clinical trial. Lancet Respiratory Medicine3:24-32.
- Walter J, Ware LB, Matthay MA (2014) Mesenchymal stem cells mechanisms of potential therapeutic benefit in ARDS and sepsis. Lancet Respir Med 2: 1016-1026.
- Khoury M, Cuenca J, Cruz FF (2020) Current status of cell-based therapies for respiratory virus infections: Applicability to COVID-19. Eur Respir J
- Leng Z, Zhu R, Hou W (2020) Transplantation of ACE2 mesenchymal stem cells improves the outcome of patients with COVID-19 pneumonia. Aging Dis11:216-228.
- ARDS Definition Task Force,RanieriVM,RubenfeldGD,Thompson BT, Ferguson ND et al (2012) Acute respiratory distress syndrome the Berlin Definition.JAMA.307:2526-2533.
- Republic of Turkey ministry of health general directorate of public health Covid-19 diagnosis and treatment management scientific advisory board study (2020)
- Matthay MA, Calfee CS, Zhuo H, Taylor B, Wilson JG,et al.(2019) Treatment with allogeneic mesenchymal stromal cells for moderate to severe acute respiratory distress syndrome START study a randomised phase 2a safety trial. Lancet Respir Med. 7:154-162.
- Sengupta V, Sengupta S, Lazo A, Woods P, Nolan A, et al. (2020) Exosomes Derived from Bone Marrow Mesenchymal Stem Cells as Treatment for Severe COVID-19. Stem Cells Dev 29:747-754.
- Yang X, Yu Y, XuJ, Shu H, Xia J,et al. (2020) Clinical course and outcomes of critically ill patients with SARS CoV 2 pneumonia in Wuhan China a single-centered, retrospective observational study. Lancet Respirat Med 8: 475-481.
- Wu C, Chen X, Cai Y, Xia V, Zhou X,et al.(2020) Risk factors associated with acute respiratory distress syndrome and death in patients with coronavirus disease 2019 pneumonia in Wuhan China. JAMA Intern Med 180: 934-943.
- Lanzoni G,Linetsky E, Correa D, Cayetano SM, Alvarez RA,et al.(2021) Umbilical cord mesenchymal stem cells for COVID-19 acute respiratory distress syndrome A double blind, phase 1/2a randomized controlled trial. STEM CELLS Transl Med 10:660-673.
- Cecconi M, Greco M, Zanella A, Albano G, Antonelli M,et al.(2020) Risk Factors Associated With Mortality Among Patients With COVID-19 in Intensive Care Units in Lombardy Italy.JAMA Intern Med 180:1345-1355.
- Kang Z, Luo S, Gui Y, Zhou H, Zhang Z,et al. (2020) Obesity is a potential risk factor contributing to clinical manifestations of COVID-19. Int J Obes Lond44:2479-2485.
- Soeroto AY, Soetedjo NN, Purwiga A, Santoso P, Kulsum ID, et al. (2020) Effect of increased BMI and obesity on the outcome of COVID-19 adult patients: A systematic review and meta-analysis. Diabetes MetabSyndr 14:1897-1904.
- Lippi G, Plebani M (2020) Laboratory abnormalities in patients with COVID-2019 infection. Clinical Chemistry and Laboratory Medicine CCLM58:1131-1134.
- Tang L, Jiang Y, Zhu M, Chen L, Zhou X, et al.(2020) Clinical study using mesenchymal stem cells for the treatment of patients with severe COVID-19. Frontiers of medicine 14:664-673.
- Guo Z, Chen Y, Luo X, He X, Zhang Y, et al.(2020) Administration of umbilical cord mesenchymal stem cells in patients with severe COVID-19 pneumonia. Critical Care 24: 420.
- Zheng F, Tang W, Li H, Huang YX, Xie YL, et al. (2020) Clinical characteristics of 161 cases of coronavirus disease 2019 (COVID-19) in Changsha. Eur Rev Med Pharmacol Sci 24:3404-3410.
- Qin C, Zhou L, Hu Z, Zhang S, Yang S,et al.(2020) Dysregulation of immune response in patients with COVID-19 in Wuhan, China. Clin Infect Dis71:762-768.
- Chen G, Wu D, Guo W, Cao Y, Huang D, et al.(2020) Clinical and immunological features of severe and moderate coronavirus disease 2019. J Clin Invest 130:2620-2629.
Citation: Yilmaz R, Asar S, Tontu F,Çukurova Z, Hergünsel GO (2022) Does Mesenchymal Stem Cell therapy affect clinical outcomes in COVID-19-associated ARDS?J Anesth Clin Care 9: 071.
Copyright: © 2022 Rabia Yilmaz, et al. This is an open-access article distributed under the terms of the Creative Commons Attribution License, which permits unrestricted use, distribution, and reproduction in any medium, provided the original author and source are credited.