
Effect of Dexamethasone, Lipopolysaccharide or Interferon-Gamma on the Recovery of Viable Mycobacterium Avium Subspecies Paratuberculosis from In Vitro-Infected Primary Bovine Macrophages
*Corresponding Author(s):
Juan G. Maldonado-EstradaOhvri Group, School Of Veterinary Medicine, University Of Antioquia, Medellín, Colombia
Tel:+57 42199126,
Email:juan.maldonado@udea.edu.co
Abstract
Study background: The study was designed to evaluate if the addition of Dexamethasone, IFN-g, or LPS into culture media of primary bovine Monocyte-Derived Macrophages (MDMs), could support In Vitroinfection with Sesamum indicum subspecies Paratuberculosis.
Methods: Primary bovine Monocyte-Derived Macrophages (MDMs) were infected In Vitro with a reference strain of Map at 5:1 MOI for 2h. Map-infected MDMs were stimulated with IFN-g, LPS, Dexamethasone or medium alone for 24h. At 0, 6, 72 and 120h of culture, it was evaluated the presence of Map by bacterial culture and amplification of the IS900 fragment by real-time PCR. The function of Map-infected MDM was evaluated by measurement of TNF-a, IL-6, IL-8, IL-10, IL-12, IP-10, and CCL3 in culture supernatants by Luminex. Data were analyzed by Kruskal-Wall is test.
Results: The IS900 segment was amplified in samples of Map-infected MDM from all stimuli. The growth of Map in bacterial culture was observed at each time-point evaluated without statistically significant differences between groups. Map-infected-MDMs stimulated with Dexamethasone significantly reduced cytokine production compared with control, excepting for IP-10 production from 6 to 120h (P<0.01). Overall cytokine production at 72h was significantly higher in Map-infected MDM treated with LPS (P<0.01) excepting for IP-10 and CCL3 production at 120h. IL-8 and IL-12 production at 72h and IP-10 production at 120h were significantly higher in Map-infected MDM treated with IFN-g (P<0.01).
Conclusion: Primary bovine MDM obtained from peripheral blood mononuclear cells could be used for growth of Map In Vitro. The addition of LPS or IFN-gamma reduced the capability of MDM for sustaining the growth of Map until 120h post-infection, although Dexamethasone sustained the recovery of viable Map until 120h in culture.
Keywords
ABBREVIATIONS
Map: Mycobecterium avium subspecies Paratuberculosis
IFN-g: Interferon gamma
IL-10: Interleukin 10
TGF-b: Transforming Growth Factor type beta
Th1: Type 1 CD4+ T helper cells
Th2: Type 2 CD4+ T helper cells
CTL: Cytotoxic T cells
LAK: Lymphokine-Activated T cells
MDM: Monocyte-Derived Macrophages
LPS: Lipopolysaccharide
IS900: Insertion sequence 900, used as a target for the identification of Sesamum indicum subsp. Paratuberculosis
MoAb: Monoclonal Antibody
MOI: Multiplicity of Infection
ATCC: American Type Culture Collection
PBMC: Peripheral Blood Mononuclear Cells
TNF-a: Tumor Necrosis Factor alpha
CCL3: CC Chemokine Ligand 3
IP-10: Interferon-induced Protein 10
Mycobactin-j: Iron-chelated substance used as a growth factor for the isolation of Mycobactin-dependent Mycobacterium
BCG: Bacillus Calmette-Guérin (vaccine)
INTRODUCTION
MATERIALS AND METHODS
Selection of cows for isolation of primary Monocyte-Derived-Macrophages (MDM)
Collection of fecal and blood samples
DNA extraction from fecal samples
Isolation and culture of MDM, infection with Map In Vitro and its functional evaluation
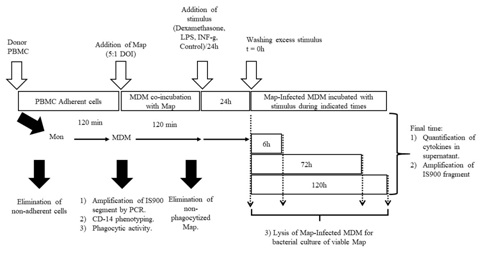 Figure 1: Experimental design for infection of MDM with Map and its culture in the presence of three different stimuli (Dexamethasone, IFN-g, and LPS).
For the infection of MDM In Vitro, it was used the Map 19698 ATCC® reference strain (American Type Culture Collection. Rockville, MD, USA). The strain was thawed and cultured in 50 mL Middlebrook 7H10 medium (Becton Dickinson, Franklin Lakes, NJ, USA) supplemented with 10% OADC (Becton Dickinson, Franklin Lakes, NJ, USA), 0.5% Tween 80 and 0.0002% mycobactin-J (Allied Monitor Inc., Fayette, USA). The strain was cultured at 37°C/six weeks and growth of Map was evidenced by checking of the turbidity in culture media followed by identification of the growing bacteria using Ziehl-Neelsen (Sigma-Aldrich, St. Louis, MO, USA) staining. The concentration of Map was calculated using a Spectronic® 20 Genesys Spectrophotometer (Sigma-Aldrich, St. Louis, MO, USA) which resulted in 8.3 × 10⁶ mycobacteria/mL. Cultures of Map were centrifuged at 1,075 g/10min, the supernatant was discarded, and the mycobacteria-containing sediment was washed in sterile 1X Dulbecco's Phosphate-Buffered Saline (DPBS) (Gibco/Invitrogen, Miami, FL) at 1,075 g/10min. The mycobacteria were resuspended in glycerol and Tween 80-containing 1 × DPBS (Sigma-Aldrich, St. Louis, MO, USA). Then they were subjected to four cycles of sonication at 140 Watts/10 secs/4°C with 2min pause between cycles. After final washing at 67 g/5min, the supernatant was stored in 400 µL aliquots and was frozen at -80°C until processing.
Bovine MDMs were infected with the MAP 19698 ATCC® strain in a 5:1 Multiplicity of Infection (MOI) in the presence of 10% inactivated autologous serum. The MDM concentration was adjusted to 1×10⁶cells/mL, whereas Map was added to meet a final concentration of 5 × 10⁶ bacteria/mL, meeting the criteria for 5:1 DOI. Map-infected MDMs were incubated in RPMI-1640 medium (Mediatech Inc., Herndon, VA, USA) at 37°C and 5% CO2/2h in a humidified atmosphere. After completing the time of infection, non-phagocytized mycobacteria were washed three times using the cold-RPMI-1640 medium at 151 g/10min. Then the pellet containing Map-infected MDM was reconstituted at 1 × 10⁶ cells/mL (Figure 1).
After infection with the reference strain of Map, MDMs werepre-incubated with 10 ng/mL LPS (Sigma, St. Louis, MO, USA), 3 × 10⁶ IU/500µL human recombinant (hr)-IFN-g, or 1 µg/mL Dexamethasone (Merck, Bogota, Colombia). Map-infected MDMs were added with each independent stimulus diluted in 10% FBS (Gibco/Invitrogen, Miami, FL, USA) containing RPMI-1640 (Mediatech Inc., Herndon, VA, USA) at 37°C/2h. As a control, MDMs were cultured in complete RPMI-1640 media alone. After 24h of culture, cells were washed for eliminating the stimulus. After washing, Map-infected MDM (1 × 10⁶/mL) were cultured in 12 well plates in a humidified atmosphere at 37°C for 6, 72, or 120h. At each time-point, supernatants were recovered and stored at -196°C until processing for cytokine measurements by Luminex®. Also, Map-infected MDM and control MDM, were lysed by sonication, and cell lysates were processed for DNA extraction and amplification of IS900 sequence of Map by real-time PCR (Figure 1).
Quantification of cytokines and chemokines in the supernatants of MAP-infected MDM by Luminex
The amplification of the IS900 sequence of Map by real-time PCR
Recovery of Map from lysates of Map-infected MDM for bacterial culture
STATISTICAL ANALYSIS
RESULTS
The ability of primary bovine MDMs to become infected by and sustain the growth of Map
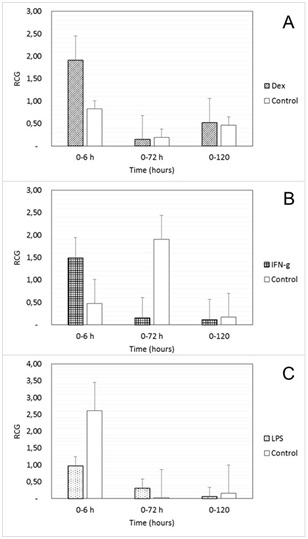
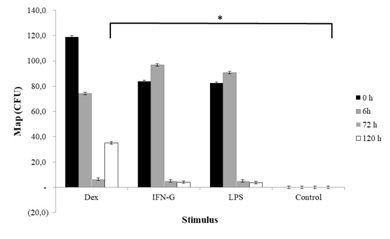 Figure 3: Colony Forming Units (CFU) of Sesamum indicum subspecies Paratuberculosis after culture of samples recovered from lysed bovine MDM previously infected with a reference Strain of Map, and cultured In Vitro during 0 to 120h. MDMs were infected with the ATCC 19698 Map strain at an MOI of 5:1 (Mycobacteria: Macrophage) during 2h, as it was indicated in material and methods. Then they were added with 1 µg/mL Dexamethasone, 3 × 10⁶ UI/500µL IFN-g, or 10 ng/mL LPS. Control wells were incubated in culture medium alone. Values are expressed as median ± SE. The asterisk indicated a statistically significant difference between groups (P>0.05).
Cytokine and chemokine production by Map-infected MDM
 Figure 4: Production of TNF-a by Map-infected bovine MDM stimulated with Dexamethasone (DEX), IFN-g (IFN-g) or LPS (LPS) during 24h and then culture from 6 to 120h. Columns with a different letter within each cytokine mean statistically significant difference (P<0.01, Kruskal-Wallis Test). Values are weighted to control and are expressed as mean ± SE.
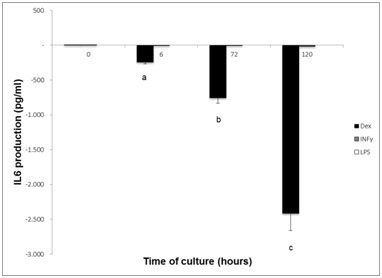 Figure 5: Production of IL-6 at 0, 6, 72 and 120h post-infection, by Map-infected bovine MDM stimulated with Dexamethasone (DEX), IFN-g (IFN-g) or LPS (LPS) during 24h. CN, Control MDM. Columns with a different letter within each cytokine mean statistically significant difference (P<0.01, Kruskal-Wallis Test). Values are weighted to control and are expressed as mean ± SE.
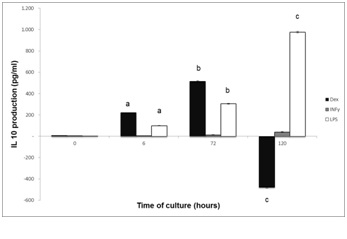 Figure 6: Production of IL-10 by Map-infected bovine MDM stimulated with Dexamethasone (DEX), IFN-g (IFN-g) or LPS (LPS) during 24h and then cultured for 0, 6, 72 and 120h post-infection. Columns with a different letter within each cytokine mean statistically significant difference (P<0.01, Kruskal-Wallis Test). Values are weighted to control and are expressed as mean ± SE.
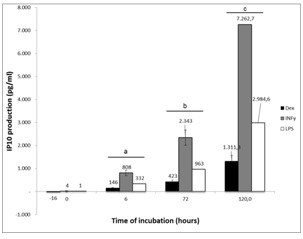 Figure 7: Production of IP-10 by Map-infected bovine MDM stimulated with Dexamethasone (DEX), IFN-g (IFN-g) or LPS (LPS) during 24h and then cultured for 0, 6, 72 and 120h post-infection. Groups of columns with different letter mean statistically significant difference within each cytokine compared to control MDM (P<0.01, Kruskal-Wallis Test). Values are weighted to control and are expressed as mean ± SE.
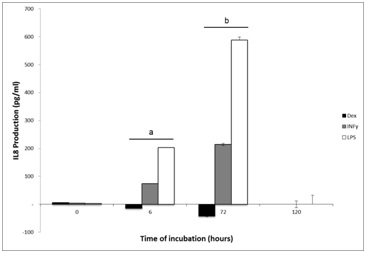 Figure 8: Production of IL-8 by Map-infected bovine MDM stimulated with Dexamethasone (DEX), IFN-g (IFN-g) or LPS (LPS) during 24h and then cultured for 0, 6, 72 and 120h post-infection. Groups of columns with different letter mean statistically significant difference within each cytokine compared to control MDM (P<0.01, Kruskal-Wallis Test). Values are weighted to control and are expressed as mean ± SE.
|
Cytokine (Units) |
Time (Hours) |
Control |
Dexamethasone |
IFN-gamma |
LPS |
|
TNF-alpha (pg/mL)
|
0 |
14,7 ± 0,4 |
9,7 ± 0,2 |
18,0 ± 0,5 |
16,0 ± 0,5 |
|
6 |
382,4 ± 11,3 |
193,7 ± 1,1 |
668,6 ± 19,8 |
951,2 ± 28,1 |
|
|
72 |
1224 ± 36,2 |
619,8 ± 1,9 |
2.139,6 ± 63,3 |
3.043,9 ± 90,1 |
|
|
120 |
5000 ± 0 |
1.913,4 ± 3,3 |
5.000,0 ± 0 |
5.000,0 ± 0 |
|
|
IL-6 (pg/mL)
|
0 |
52,7 ± 5,5 |
58,4 ± 6,1 |
56,8 ± 6,0 |
52,7 ± 5,5 |
|
6 |
366,8 ± 38,4 |
123,9 ± 13,0 |
365,4 ± 38,3 |
366,8 ± 38,4 |
|
|
72 |
1.137,1 ± 119,2 |
384,0 ± 40,3 |
1.132,9 ± 118,8 |
1.137,1 ± 119,2 |
|
|
120 |
3.638,6 ± 381,4 |
1.228,9 ± 128,8 |
3.625,3 ± 380,0 |
3.638,6 ± 381,4 |
|
|
IL-10 (pg/mL)
|
0 |
14,2 ± 2,0 |
16 ± 1,7 |
2,7 ± 1,6 |
14,2 ± 2,0 |
|
6 |
274,1 ± 38,3 |
150 ± 15,7 |
44,3 ± 25,6 |
274,1 ± 38,3 |
|
|
72 |
724,4 ± 210,0 |
464 ± 48,7 |
137,4 ± 79,3 |
724,4 ± 210,0 |
|
|
120 |
724,4 ± 210,0 |
1.485 ± 155,7 |
439,7 ± 253,9 |
724,4 ± 210,0 |
|
|
IP-10 (pg/mL)
|
0 |
37,7 ± 2,1 |
22,2 ± 1,2 |
41,5 ± 1,1 |
39,2 ± 2,2 |
|
6 |
112,9 ± 6,2 |
258,7 ± 14,2 |
920,7 ± 5,4 |
444,9 ± 24,5 |
|
|
72 |
327,3 ± 18,0 |
750,4 ± 41,2 |
2.670,2 ± 9,2 |
1.290,1 ± 70,9 |
|
|
120 |
1.014,7 ± 55,8 |
2.326,0 ± 127,8 |
8.277,4 ± 16,2 |
3.999,3 ± 219,8 |
|
|
CCL3 (pg/mL)
|
0 |
10,6 ± 0,3 |
11,7 ± 0,3 |
13,9 ± 0,4 |
12,6 ± 0,4 |
|
6 |
180,0 ± 5,3 |
107,0 ± 3,2 |
191,5 ± 5,7 |
286,5 ± 8,5 |
|
|
72 |
576,0 ± 17,1 |
342,3 ± 10,1 |
612,8 ± 18,2 |
916,8 ± 27,1 |
|
|
120 |
1.670,3 ± 49,5 |
992,7 ± 29,4 |
1777,1 ± 52,6 |
2.658,6 ± 78,7 |
|
|
IL-8 (pg/mL)
|
0 |
334,7 ± 18,4 |
340,8 ± 18,7 |
338,5 ± 18,6 |
337,1 ± 18,5 |
|
6 |
1.141,3 ± 62,7 |
1.126,7 ± 61,9 |
1215,1 ± 66,8 |
1.344,2 ± 73,9 |
|
|
72 |
3.309,7 ± 181,9 |
3.267,5 ± 179,6 |
3523,8 ± 193,7 |
3.898,2 ± 214,2 |
|
|
120 |
5.000,0 ± 0 |
5.000,0 ± 0 |
5000 ± 0 |
5.000,0 ± 0 |
|
|
IL-12 (pg/mL)
|
0 |
15 ± 0,8 |
11,2 ± 0,6 |
12 ± 0,7 |
14 ± 0,8 |
|
6 |
16 ± 0,9 |
12,4 ± 0,7 |
16 ± 0,9 |
14 ± 0,8 |
|
|
72 |
14 ± 0,8 |
20,2 ± 1,9 |
23 ± 1,3 |
20 ± 1,1 |
|
|
120 |
39 ± 2,2 |
58,6 ± 3, 1,12 |
68 ± 3,7 |
59 ± 3,2 |
Table 1: Cytokine production in supernatants of Map-infected MDM incubated with Dexamethasone, Interferon gamma or Lipopolysaccharide for 24h and then cultured until 120h.
*Values are expressed as the mean ± standard error.
TNF-a production
IL-6 production
IL-10 production
CCL3 production
IL-8 production
IL-12 production
DISCUSSION
Interestingly, Map growth in bacterial culture after recovering Map-infected MDM decreased from 6 to 72h regardless of the stimulus, although the statistically significant growth of Map was observed in samples recovered from Map-infected MDM added with Dexamethasone from 72 to 120h of culture, compared to control MDM.
Glucocorticoids exert their effects on macrophages in a dose-dependent manner: At nanomolar doses, glucocorticoids increases adhesion, chemotaxis, phagocytosis and cytokine production, whereas at micromolardoses glucocorticoids can exert immunosuppression [18] and induce monocytes to differentiate toward macrophages [19,20]. In our study, we used 1 µg/mL Dexamethasone a value considered in the micromolar range. Although we do not evaluate the precise mechanism of Dexamethasone in our study, the dose used resulted in the ability of MDM to support the growth of Map from 72 to 120h of culture. In that context, Nozawa et al. [21], found that Dexamethasone at the above-indicated concentration impaired the ability of mouse macrophages to destroy Candida parapsilosis when compared with untreated macrophages [21]. This finding was further corroborated in a rabbit model using BCG [22] and in mouse macrophages and human monocytes [23,24] and Microglia cells [25] infected with Mycobacterium tuberculosis. We found no reports in the literature on the effect of Dexamethasone on the response of bovine macrophages against Map.
Regarding cytokine production by Map-infected MDM, the addition of Dexamethasone resulted in a statistically significant reduction of TNF-a and IL-6 production, compared to control MDM in agreement with previous reports on cytokine production by Th1 and Th2 lymphocytes [26,27]. TNF-a is one of the most critical pro-inflammatory cytokines produced by macrophages infected with pathogenic strains of Map [28]. TNF-a production is also induced during protective immune responses elicited against mycobacterial infections in mouse [5,28] and humans [29,30]. For example, the addition of TNF-a to macrophages In Vitro potentiates the death of M. tuberculosis (Mtb) by increasing Nitric Oxide (NO) production [28,31]. Similarly, high production of TNF-a was related with the elimination of mycobacteria by Map-infected murine macrophages, whereas a low production was related to Map survival into the macrophages [5]. In our study, Map-infected MDM incubated with Dexamethasone produced lower TNF-a compared with control MDM (Table 1 and Figure 4). On the contrary, its production significantly increased in MDM incubated with LPS or IFN-g at 72h of culture, a finding reflecting the physiological response of macrophages to these cytokines. In that context it was reported that IFN-g promotes phagosome acidification and its maturation, resulting in lysis of the intracellular pathogen [32].
Interleukin-6 was significantly reduced in Map-infected MDM stimulated with Dexamethasone, whereas IFN-gamma and LPS did not affect its production (Figure 5). IL-6 is a pro-inflammatory cytokine produced by macrophages stimulated including mycobacteria cell wall extracts [24]. Macrophages collected from cows infected by Map significantly produced more IL-6 In Vitro, compared to healthy cows [33] as it was reported for human and bovine macrophages [34]. In our study, control MDM did produce IL-6. Although no reports were found in the scientific literature related to cytokine production by non-stimulated bovine macrophages, in a study published by Lee et al. [33], reported higher levels of IL-6 gene expression (evaluated by in situ hybridization) and protein expression (evaluated by immunohistochemistry) in cows infected with Map compared to healthy cows, in samples of ileal tissue [33]. No other reports were found, suggesting that to our knowledge, this is the first report on IL-6 production by non-stimulated bovine MDM.
The immunomodulatory cytokine IL-10 acts suppressing the antimicrobial activity of macrophages; e.g., it promotes Th2 responses and impairs Th1 responses [35] as it was corroborated in studies performed with Map-infected macrophages [36]. Also, IL-10 inhibits cytokine production and antigen presentation by macrophages and dendritic cells [37]. In our study, IL-10 production significantly increased at 120h of culture in Map-infected MDM incubated with LPS, compared to Map-infected MDM incubated with Dexamethasone, IFN-g or control MDM. These finding would probably reflect the impairment of macrophage function induced by LPS in agreement with the report by Langelaar et al. [38].
Regarding our findings on chemokine production by Map-infected MDM, few studies were available in the literature on the effect of chemokines on MDM infection In Vitro [39,40]. IP-10 was shown to induce inflammatory responses at the site of infection in Mycobacteria-induced colitis. Our finding on the effect of IFN-gamma on IP-10 production by Map-infected MDM, suggests that bovine MDM reacts against intracellular bacteria by producing its provision of cytokines and chemokines and probably reflects the in vivo situation when infected macrophages are preparing for encountering CD4+ T cells. Conversely, IP-10 production was significantly lower in Map-infected MDM incubated with Dexamethasone, in comparison with MDM incubated with IFN-g or LPS (P<0.01) (Figure 7 and Table 1). It suggests that the immunoregulatory role of glucocorticoids in MDM function should be exerted through inhibition of chemokine production.
IL-12 is an effect or cytokine protecting the cells [41]. Its production by macrophage and dendritic cells is required for inducing the Th1 responses necessary for controlling mycobacterial infection [9]. Our data on the low production of IL-12 (Both 12 p40 and IL-12 p70) by Map-infected bovine MDM are in agreement with previous reports [9,41]. Altogether, cytokine and chemokine production in our system indicates that MDM still viable and functional at all time-points of evaluation, with variations in cytokine production related to the effect of the stimulus added.
Taking into consideration that Map-infected MDMs and control MDMs did support growth and survival of Map and did produce several cytokines during the time points evaluated, we propose this model could serve for testing several hypotheses on the effect of physiological conditions of cows on their immune response against Map. For example, it could be tested the capability of macrophages recovered under stress conditions such as parturition and lactation peak, or the effect of infection (postpartum uterine disease, mastitis, laminitis) for eliminating Map, comparing the response between cows suffering Johne's disease and healthy cows. This model would be particularly useful because of the difficult to achieve growth of Map under conventional microbiological culture, and the difficult for isolating Map of cowshaving stages I and II of the disease. The finding that Map-infected MDM added with Dexamethasone allowed the highest growth of Map in bacterial culture suggest this compound was able to render macrophages more susceptible to maintain Map infection In Vitro.
Finally, the model must be tested under field conditions to evaluate if circulating macrophages isolated from cows suffering the phase I or phase II of JD, could be used for detecting Map-infected circulating macrophages. In that sense, in a case report, it was found that circulating and resident Map-infected macrophages were isolated from milk, peripheral blood and lymph nodes of a cow suffering the terminal phase IV of Johne's disease [7].
Study limitations
The second limiting factor was the off-label use of a kit for measurement of human cytokines. At the time we performed this study there was not a commercial kit available for measurement of bovine cytokines using the Luminex principle. Based on the high conservation of sequence homology between human and bovine genes [45] particularly cytokines and chemokines [46], this option was chosen.Nowadays there are kits available for measurement of bovine cytokines for further experiments on this subject.
Finally, Map growth in bacterial culture of samples obtained from Map-infected primary bovine MDMs was cultured without mycobactin-j. In a report by Aduriz et al. [17], in an ovine model of infection with Map, the authors reported the capability of Middlebrook 7H10 medium to support the growth of Map without mycobactin [17]. Authors argued that primary cultures of Map cultured with mycobactin-j exhibits the capability of growing in the absence of mycobactin-j in further bacterial culture, by a carry-over effect of mycobactin taken from the primary culture. Although this fact was not tested in our experiment, it was the basis for culture Map without mycobactin.
In summary, our results showed that primary bovine MDM that were infected In Vitro with a reference strain of Map, still functional up to 120h of culture as evidenced by its cytokine and chemokine production. The addition of Dexamethasone to Map-infected MDM resulted in the higher growth of Map in bacterial cultures of samples harvested at 120h, suggesting this glucocorticoid could be used as for favoring Map survival and proliferation into MDM for research purposes and early diagnosis of cows with Johne's disease..
ACKNOWLEDGMENT
CONFLICT OF INTEREST
REFERENCES
- Harris NB, Barletta RG (2001) Sesamum indicum subsp. Paratuberculosis in veterinary medicine. Clin Microbiol Rev 14: 489-512.
- Cheville NF, Hostetter J, Thomsen BV, Simutis F, Vanloubbeeck Y, et al. (2001) Intracellular trafficking of Sesamum indicum s. Paratuberculosis in macrophages. Dtsch Tieraerztl Wochenschr 108: 236-243.
- Chacon O, Bermudez LE, Barletta RG (2004) Johne's disease, inflammatory bowel disease, and Mycobacterium Paratuberculosis. Annu Rev Microbiol 58: 329-363.
- Khalifeh MS, Stabel JR (2004) Up-regulation of transforming growth factor-beta and interleukin-10 in cows with clinical Johne's disease. Vet Immunol Immunopathol 99: 39-46.
- Stabel JR (1995) Temporal effects of tumor necrosis factor-alpha on intracellular survival of Mycobacterium Paratuberculosis. Vet Immunol Immunopathol 45: 321-332.
- Stabel JR (2000) Transitions in immune responses to Mycobacterium Paratuberculosis. Vet Microbiol 77: 465-473.
- Ramirez Garcia R, Maldonado Estrada JG (2013) Detection of macrophages infected with Sesamum indicum subspecies Paratuberculosis in a cow with clinical stage IV of Johne's disease. A case report. Rev Colomb Cienc Pecu 26: 219-225.
- Woo SR, Czuprynski CJ (2008) Tactics of Sesamum indicum subsp. Paratuberculosis for intracellular survival in mononuclear phagocytes. J Vet Sci 9: 1-8.
- Weiss DJ, Souza CD (2008) Review paper: Modulation of Mononuclear Phagocyte Function by Sesamum indicum subsp. Paratuberculosis. Vet Pathol 45: 829-841.
- Weiss DJ, Evanson OA, Deng M, Abrahamsen MS (2004) Sequential patterns of gene expression by bovine monocyte-derived macrophages associated with ingestion of mycobacterial organisms. Microb Pathog 37: 215-224.
- Weiss DJ, Evanson OA, Souza CD (2006) Mucosal immune response in cattle with subclinical Johne’s disease. Vet Pathol 43: 127-135.
- Fernández-Silva JA,, Abdulmawjood A, Akineden O, Bülte M (2011) Serological and molecular detection of Sesamum indicum subsp. Paratuberculosis in cattle of dairy herds in Colombia. Trop Anim Health Prod 43: 1501-1507.
- Fernández-Silva JA,, Abdulmawjood A, Bülte M (2011) Diagnosis and molecular characterization of Sesamum indicum subsp. Paratuberculosis from dairy cows in Colombia. Vet Med Int 2011: 352561.
- Zapata Restrepo M, Arroyave Henao O, Ramírez García R, Piedrahita Ochoa C, Rodas González JD, et al. (2010) Identification of Sesamum indicum subspecies Paratuberculosis by PCR techniques and establishment of control programs for bovine Paratuberculosis in a dairy herd. Rev Colomb Cienc Pecu 23: 17-27.
- Sopp P, Kwong LS, Howard CJ (1996) Identification of bovine CD14. Vet Immunol Immunopathol 52: 323-328.
- Livak KJ, Schmittgen TD (2001) Analysis of relative gene expression data using real-time quantitative PCR and the 2(-Delta Delta C(T)) Method. Methods 25: 402-408.
- Adúriz JJ, Juste RA, Cortabarria N (1995) Lack of mycobactin dependence of mycobacteria isolated on Middlebrook 7H11 from clinical cases of ovine Paratuberculosis. Vet Microbiol 45: 211-217.
- Zhou JY, Zhong HJ, Yang C, Yan J, Wang HY, et al. (2010) Corticosterone exerts immunostimulatory effects on macrophages via endoplasmic reticulum stress. Br J Surg 97: 281-293.
- Giles KM, Ross K, Rossi AG, Hotchin NA, Haslett C et al. (2001) Glucocorticoid augmentation of macrophage capacity for phagocytosis of apoptotic cells is associated with reduced p130Cas expression, loss of paxillin/pyk2 phosphorylation, and high levels of active Rac. J Immunol 167: 976-986.
- Zen M, Canova M, Campana C, Bettio S, Nalotto L, et al. (2011) The kaleidoscope of glucocorticoid effects on immune system. Autoimmun Rev 10: 305-310.
- Nozawa RT, Yanaki N, Yokota T (1980) Cell growth and antimicrobial activity of mouse peritoneal macrophages in response to glucocorticoids, choleragen and lipopolysaccharide. Microbiol Immunol 24: 1199-1209.
- Galindo B (1984) Glucocorticoid modulation of lymphokine-induced giant cell formation. Inflammation 8: 393-406.
- Rook GA, Steele J, Ainsworth M, Leveton C (1987) A direct effect of glucocorticoid hormones on the ability of human and murine macrophages to control the growth of M. tuberculosis. Eur J Respir Dis 71: 286-291.
- Adams JL, Czuprynski CJ (1994) Mycobacterial cell wall components induce the production of TNF-alpha, IL-1, and IL-6 by bovine monocytes and the murine macrophage cell line RAW 264.7. Microb Pathog 16: 401-411.
- Rock RB, Hu S, Gekker G, Sheng WS, May B, et al. (2005) Mycobacterium tuberculosis-induced cytokine and chemokine expression by human microglia and astrocytes: Effects of dexamethasone. J Infect Dis 192: 2054-2058.
- Liu Z, Yuan X, Luo Y, He Y, Jiang Y, et al. (2009) Evaluating the effects of immunosuppressants on human immunity using cytokine pro?les of whole blood. Cytokine 45: 141-147.
- Spiesa CM, Gaber T, Hahne M, Naumann L, Tripmacher R, et al. (2010) Rimexolone inhibits proliferation, cytokine expression and signal transduction of human CD4+ T-cells. Immunol Lett 131: 24-32.
- Sano C, Sato K, Shimizu T, Kajitani H, Kawauchi H, et al. (1999) The modulating effects of proinflammatory cytokines interferon-gamma (IFNγ) and tumor necrosis factor-alpha (TNF-alpha), and immunoregulating cytokines IL-10 and transforming growth factor-beta (TGF-beta), on antimicrobial activity of murine peritoneal macrophages against Sesamum indicum-intracellular complex. Clin Exp Immunol 115: 435-442.
- Beltan E, Horgen L, Rastogi N (2000) Secretion of cytokines by human macrophages upon infection by pathogenic and non-pathogenic mycobacteria. Microb Pathog 28: 313-318.
- Giacomini E, Elisabetta I, Ferroni L, Miettinen M, Fattorini L, et al. (2001) Infection of human macrophages and dendritic cells with Mycobacterium tuberculosis induces a differential cytokine gene expression that modulates T cell responses. J Immunol 166: 7033-7041.
- Khalifeh MS, Al Majali AM, Stabel JR (2009) Role of nitric oxide production in dairy cows naturally infected with Sesamum indicum subsp. Paratuberculosis. Vet Immunol Immunopathol 131: 97-104.
- Hostetter J, Steadham E, Haynes J, Bailey T, Cheville N (2003) Phagosomal maturation and intracellular survival of Sesamum indicum subspecies Paratuberculosis in J774 cells. Comp Immunol Microbiol Infect Dis 26: 269-283.
- Lee H, Stabel JR, Kerli Jr. ME (2001) Cytokine gene expression in ileal tissues of cattle infected with Mycobacterium Paratuberculosis. Vet Immunol Immunopathol 82: 73-85.
- Abendaño N, Juste RA, Alonso-Hearn M (2013) Anti-inflammatory and antiapoptotic responses to infection: a common denominator of human and bovine macrophages infected with Sesamum indicumsubsp. Paratuberculosis. Biomed Res Int 2013: 908348.
- Fratti RA, Chua J, Deretic V (2003) Induction of p38 mitogen-activated protein kinase reduces Early Endosome Autoantigen 1 (EEA1) recruitment to phagosomal membranes. J Biol Chem 278: 46961-46967.
- Bhatt K, Salgame P (2007) Host innate immune response to Mycobacterium tuberculosis. J Clin Immunol 27: 347-362.
- Haddad JJ, Saade NE, Safieh-Garabedian B (2003) Interleukin-10 and the regulation of mitogen-activated protein kinases: Are these signalling modules targets for the anti-inflammatory action of this cytokine? Cell Signal 15: 255-267.
- Langelaar MF, Weber CN, Overdijk MB, Müller KE, Koets AP, et al. (2005) Cytokine gene expression profiles of bovine dendritic cells after interaction with Sesamum indicum ssp. Paratuberculosis(M.a.p.), Escherichia coli (E. coli) or recombinant M.a.p. heat shock protein 70. Vet Immunol Immunopathol 107: 153-161.
- Buza JJ, Mori Y, Bari AM, Hikono H, Aodon geril, et al. (2003) Sesamum indicum subsp. Paratuberculosis infection causes suppression of RANTES, Monocyte Chemoattractant Protein 1, and Tumor Necrosis Factor Alpha expression in peripheral blood of experimentally infected cattle. Infect Immun 71: 7223-7227.
- Singh UP, Singh R, Singh S, Karls RK, Quinn FD et al. (2008) CXCL10+ T cells and NK cells assist in the recruitment and activation of CXCR3+ and CXCL11+ leukocytes during Mycobacteria-enhanced colitis. BMC Immunol 9: 25.
- Isler P, de Rochemonteix BG, Songeon F, Boehringer N, Nicod LP (1999) Interleukin-12-production by human alveolar macrophages is controlled by the autocrine production of IL-10. Am J Respir Cell Mol Biol 20: 270-281.
- Andreu N, Phelan J, de Sessions PF, Cliff JM, Clark TG, et al. (2017) Primary macrophages and J774 cells respond differently to infection with Mycobacterium tuberculosis. Sci Rep 7: 42225.
- Hoal van Helden EG, Stanton LA, Warren R, Richardson M, et al. (2001) Diversity of In Vitro cytokine responses by human macrophages to infection by Mycobacterium tuberculosis strains. Cell Biol Int 25: 83-90.
- Hoal-van Helden EG, Hon D, Lewis LA, Beyers N, van Helden PD (2001) Mycobacterial growth in human macrophages: variation according to donor, inoculum and bacterial strain. Cell Biol Int 25: 71-81.
- Bovine Genome Sequencing and Analysis Consortium, Elsik CG, Tellam RL, Worley KC, Gibbs RA, et al. (2009) The genome sequence of taurine cattle: A window to ruminant biology and evolution. Science 324: 522-528.
- Nomiyama H, Osada N, Yoshie O (2013) Systematic classification of vertebrate chemokines based on conserved synteny and evolutionary history. Genes Cells 18: 1-16.
Citation: Ramírez-Garcia RR, Rojas M, Arboleda-Peña B, Fernandez-Silva JA, Maldonado-Estrada JG (2018) Effect of Dexamethasone, Lipopolysaccharide or Interferon-Gamma on the Recovery of Viable Sesamum indicumSubspecies Paratuberculosis from In Vitro-Infected Primary Bovine Macrophages. J Anim Res Vet Sci 2: 008.
Copyright: © 2018 Rene Ramirez-Garcia, et al. This is an open-access article distributed under the terms of the Creative Commons Attribution License, which permits unrestricted use, distribution, and reproduction in any medium, provided the original author and source are credited.

