Effect of Inclusion of Different Levels of Rice (OryzaSativa) Bran on the Production Performance of Broiler Chicken
*Corresponding Author(s):
Chala EdeaEthiopian Institute Of Agricultural Research, DebreZeit Agricultural Research Center And Jimma University, College Of Agriculture And Veterinary Medicine, Ethiopia
Abstract
The aim of this experiment was to evaluate the carcass composition; meat quality characteristics, serum and partial budget analysis of broiler chicks fed with different levels of Rice Bran (RB) for duration of 56 days. A total of 384 unsexed day old Cobb 500 broiler chicks were randomly divided into 24 groups each with 16 chicks and assigned to six dietary treatments in a completely randomized design with 4 replicates both during the starters and finishing phases. The dietary treatments studied comprised of basal ration containing 0, 5, 10, 15, 20 and 25% of RB. The starters and finishers treatment rations were formulated to be iso-caloric and iso-nitrogenous. Appropriate vaccinations were given and standard bio-security measures were employed, mortality registered as it occurred and general health status monitored throughout the experimental period. On the 49th and 56th days of the feeding trial, two birds (one male and one female) and eight birds /treatment were randomly selected from each replicate for carcass evaluation. From the same birds used for carcass evaluation, blood was taken for serum Total Cholesterol (TC) and Total Protein (TP) determination. Meat samples from breast, thigh and drumstick were evaluated for color, taste, flavor, juiciness tenderness and over all acceptability by panelists. The proximate chemical composition analysis of the breast and thigh muscles carried out. The partial budget was calculated as the difference between the feed costs incurred during the experimental period per bird and sale of live birds at the end of the experimental period. The results obtained indicated that there were significant differences (P < 0. 05) in most of gastrointestinal tract. The weight of gizzard and small intestine significantly increased as the dietary levels of rice bran increased. There were no significant (P>0. 05) difference between all the treatment groups in the slaughter and heart weight on the 56th day of the feeding trial. All the groups fed on the treatments containing 0-20% of rice bran recorded statistically similar drumstick weight of 231. 25-276. 88g. There was significant difference between the groups fed on 5-25% of RB rice bran in terms of percent composition of EE of breast muscle meat. The roasted breast meat thigh and drumstick of the experimental broiler fed on all the treatment diets were similarities in taste, color, flavor, juiciness, tenderness and overall acceptability. The results of the current study indicate that rice bran can be included at up to 15-20% in starter and finisher broilers diet without negative effects on carcass parameters, total serum cholesterol, total serum proteins and sensory test. Moreover, inclusion of up to 20% rice bran in broilers ration could result in reduction of 11% production cost compared to the groups fed on control diet.
Abbreviations
ADG: Average Daily Gain; BW: Body Weight; CF: Crude Fiber; CP: Crude Protein; CRD: Completely Randomized Design; DM: Dry Matter; DZARC: DebreZeit Agricultural Research Centre; EE: Ether Extract; FCR: Feed Conversion Ratio; GIT: Gastro Intestinal Tract; GLM: General Linear Model; Kcal: Kilocalorie; ME: Metabolize Energy; NSC: Nougseed Cake; RB: Rice Bran; SBM: Soybean Meal; SD: Standard Deviation; TC: Total Cholesterol; TP: Total Protein
Introduction
Poultry production plays a major role in bridging the protein gap in developing countries where average daily consumption is far below recommended standards [1]. The egg and meat are very significant source of high quality protein, vitamins and minerals in human diet. Chicken meat has a high biological value, relatively low price, affordable by almost every social stratum, and being served from small restaurants to starred hotels. A broiler farm is relatively easy to handle from farm scale management and investment, as well as time needed for the broiler chicken farming is very short period. The great potential of broiler chicken cannot be optimal when it is not supported by required feed both in quantity or quality [2].
Feed accounts for about 70-75% of cost of poultry production [2]. This situation is resulted to the unaffordable of poultry products (meat and eggs) in developing countries, including Ethiopia compared to that of the developed regions where ample quantities of conventional feed ingredients are available. This situation also made the developing countries weaker and weaker to compete with the global market for the products. Due to scarcity and consequent high price of the conventional protein and energy sources, productivity of poultry has been limited in the tropical regions [3]. Thus, poultry producers in Ethiopia are always complaining over the high cost and quality of poultry feed on the market. The known conventional plant protein sources for poultry feeding include soybean and other oil seed meal; and various agro-industrial by-products are very expensive. There is increased market price and demand for oil seed cake, particularly that of soybean meal[4]. On the other side, the country is not self-sufficient in grains production, that competing for poultry feed production [5,6]. Similarly, availability of land for cultivation of soybean and other plant protein sources is diminishing in developing countries [7].
Profitability of the poultry industry to the producers and the affordability of poultry products to the consumers are very much dependent on the efficient and effective utilization of cheap and locally available feed resources which have a comparative nutritional value as the conventional sources. Under local conditions, rice bran is probably the cheapest feed resource for a unit of many nutrients and energy for poultry and, thus the feeding cost can substantially be reduced and feed value enhanced through proper utilization of rice bran in the poultry industry.
Rice bran is a major cereal by-product, which is widely used in rice producing countries as a feed ingredient in poultry ration. Bran is the coarse outer covering of grains separated during processing. It contains considerable amounts of fat, protein, amino acids, metabolizable energy and a good source of B-group vitamins [8,9]. Its high oil and starch content make it an important energy ingredient. Its amino acid composition is generally superior to that of other cereal grains [10]. Rice bran protein has high lysine content (4. 31%) and the limiting amino acids are threonine and isoleucine [11]. Its nutritional value is higher than wheat bran. These being the cases the major objective of this study was to study the effect of different levels of rice bran on the production performance of Cobb 500 broiler chicken with the following specific objectives:
a)To evaluate the carcass characteristics and nutritional quality of Cobb 500 broiler chicken fed different levels of rice bran,
b) To evaluate serum profile of Cobb 500 broiler chicken fed different levels of rice bran,
c) To study into partial budget analysis of inclusion of different levels of rice bran in the diet of Cobb 500 broilers chicken.
Materials And Methods
Description of the study area
This experiment conducted at DZARC, located at 45 km from the south east of capital city, Addis Ababa. It has an altitude of 1900 meters above sea level and at 844'N latitude and 380, 38’ E longitudes. The average annual rainfall is 1100 mm and the average maximum and minimum temperature of the area are 28. 3 and 8. 9°C, respectively [12].
Experimental ration and treatments
The chemical composition of samples of the major feed ingredients (maize, RB, soybean, nougseed cake and meal bone and meat) was determined for proximate values of Dry Matter (DM), Crude Fiber(CF), total ash, Ether Extract (EE), Kjeldahl N, calcium and phosphorus prior to the experimental starter and finisher ration formulation. Crude protein content was calculated from the total N multiplied by 6. 25. The Metabolizable Energy (ME) content of the feed ingredients and the experimental diets was determined according to Wiseman (1987) as ME (kcal/ kg DM) = 3951+54. 4 EE-88. 7CF-40. 80 Ash.
Then six starters and finishers’ treatment rations were formulated based on the results of the laboratory chemical analytical data. The feed ingredients used in the formulation of the different experimental rations for the study were maize, rice bran, soybean meal, soybean oil, nougseed cake, meat and bone meal, lysine, methionine, limestone, premix general and salt. All the ingredients except the RB were purchased from the nearby market whereas the RB was collected from the cereal millings engaged in rice processing from Wereta area (Fogera District), Amhara region. The maize grain, nougseed cake, limestone and salt were run through a hammer mill sieve with a size of 3-5 mm to produce the meal. The starter phase treatment rations formulated to be nearly iso-caloric and iso-nitrogenous at 3000 kcal/kg DM of ME and CP content of 22%, respectively. The finisher phase treatment rations were also formulated to be iso-caloric and iso-nitrogenous that contains 3200 kcal/kg DM of ME and CP content of 20%, respectively.
Management of the experimental chicks
A total of 384 day old chicks with an average body weight 41. 86±1. 26 g were used for feeding trial and were randomly assigned to six dietary treatments and four replications per treatment in a completely randomized design experiment, thus having 16 chicks per replicate or pen and a total of 24 experimental pensTables 1 and 2. Finally, the six starters’ phase treatment rations were randomly assigned to the experimental chicks for the first 28 days of the feeding trials as shown in Table 3. Then the experimental chicks were switched to finisher’s treatment rations for further 28 days of the feeding trial.
Each group of the experimental chicks kept in deep litter house with enough floor space round feeders and drinkers. Infrared bulbs and fluorescent lumps were used as heat and light source, respectively. The experimental pens, watering and feeding troughs were thoroughly cleaned, disinfected and sprayed against external parasites in advance with the commencement of the feeding trialFigure 1. The birds were vaccinated against Newcastle and Infectious Bursal Disease (Gumboro) at the recommended vaccination dates, and other health precautions and sanitary measures were also routinely practiced throughout the study period. The chicks initially weighed and allowed to continue with the assigned diets for a 56 days feeding period. Fresh clean water and feed were provided adlibtum Figure 2.
|
Treatments |
Replications |
Birds per replication |
Total number of birds per treatment |
|
T1: Diets + 0% Rice Bran |
4 |
16 |
64 |
|
T2: Diets + 5% Rice Bran |
4 |
16 |
64 |
|
T3: Diets + 10% Rice Bran |
4 |
16 |
64 |
|
T4: Diets + 15% Rice Bran |
4 |
16 |
64 |
|
T5: Diets + 20% Rice Bran |
4 |
16 |
64 |
|
T6: Diets + 25% Rice Bran |
4 |
16 |
64 |
|
Total |
|
384 |
|
Table 1: Experimental design of the feeding trial with broiler chicks.
|
Feed ingredients |
Starter ration: 0-28 days (CP:22%, ME: 3000kcal/kg DM) |
Finisher ration: 29-56 days (CP:20%, ME: 3200kcal/kg DM) |
||||||||||
|
Treatments |
Treatments |
|||||||||||
|
T1 |
T2 |
T3 |
T4 |
T5 |
T6 |
T1 |
T2 |
T3 |
T4 |
T5 |
T6 |
|
|
Rice bran |
0 |
5 |
10 |
15 |
20 |
25 |
0 |
5 |
10 |
15 |
20 |
25 |
|
Maize |
55 |
50 |
45. 7 |
40. 7 |
36. 7 |
31. 7 |
60 |
55 |
50 |
45 |
40 |
35 |
|
SBM |
24 |
28. 7 |
29 |
30 |
30 |
30 |
17. 7 |
14. 7 |
13. 2 |
15. 7 |
15. 2 |
15. 2 |
|
NSC |
12. 7 |
8 |
7 |
5 |
4 |
3 |
9 |
10 |
12 |
11 |
11 |
11 |
|
Bone and meat meal |
3 |
3 |
3 |
4 |
4 |
5 |
8 |
10 |
9 |
7 |
7. 5 |
7. 5 |
|
Soybean oil |
2. 5 |
2. 5 |
2. 5 |
2. 5 |
2. 5 |
2. 5 |
2. 5 |
2. 5 |
3 |
3. 5 |
3. 5 |
3. 5 |
|
Limestone |
1. 5 |
1. 5 |
1. 5 |
1. 5 |
1. 5 |
1. 5 |
1. 5 |
1. 5 |
1. 5 |
1. 5 |
1. 5 |
1. 5 |
|
Premix |
0. 5 |
0. 5 |
0. 5 |
0. 5 |
0. 5 |
0. 5 |
0. 5 |
0. 5 |
0. 5 |
0. 5 |
0. 5 |
0. 5 |
|
Methionine |
0. 15 |
0. 15 |
0. 15 |
0. 15 |
0. 15 |
0. 15 |
0. 15 |
0. 15 |
0. 15 |
0. 15 |
0. 15 |
0. 15 |
|
Lysine |
0. 25 |
0. 25 |
0. 25 |
0. 25 |
0. 25 |
0. 25 |
0. 25 |
0. 25 |
0. 25 |
0. 25 |
0. 25 |
0. 25 |
|
Salt |
0. 4 |
0. 4 |
0. 4 |
0. 4 |
0. 4 |
0. 4 |
0. 4 |
0. 4 |
0. 4 |
0. 4 |
0. 4 |
0. 4 |
|
Total |
100 |
100 |
100 |
100 |
100 |
100 |
100 |
100 |
100 |
100 |
100 |
100 |
|
Calculated value |
|
|
|
|
|
|
|
|
|
|
|
|
|
Cp |
21. 04 |
21. 34 |
21. 07 |
21. 19 |
20. 82 |
20. 85 |
19. 94 |
19. 86 |
19. 29 |
18. 91 |
18. 83 |
18. 71 |
|
CF |
4. 91 |
4. 98 |
5. 43 |
5. 74 |
6. 18 |
6. 6 |
4. 01 |
4. 59 |
5. 43 |
6 |
6. 56 |
7. 15 |
|
EE |
6. 71 |
6. 38 |
6. 26 |
6. 18 |
6. 07 |
6. 05 |
7. 24 |
7. 44 |
7. 82 |
7. 93 |
7. 9 |
7. 81 |
|
ME |
2953. 17 |
2924. 28 |
2911. 07 |
2894. 62 |
2884. 65 |
2870. 4 |
3031. 43 |
3028. 08 |
3043. 03 |
3044. 88 |
3029. 58 |
3011. 03 |
|
Ca |
1. 06 |
1. 06 |
1. 06 |
1. 16 |
1. 16 |
1. 26 |
1. 56 |
1. 76 |
1. 66 |
1. 45 |
1. 5 |
1. 5 |
|
P |
0. 58 |
0. 57 |
0. 55 |
0. 58 |
0. 56 |
0. 59 |
0. 79 |
0. 87 |
0. 81 |
0. 7 |
0. 71 |
0. 69 |
Table 2: Ingredients used in formulating the experimental diets.
CF: Crude Fiber; CP: Crude Protein; DM: Dry Matter; EE: Ether Extract; NSC:Nug Seed Cake; ME; Metabolizable Energy; RB: Rice Bran; SBM: SoyabeanMeal; T1: Ration containing 0% RB; T2: Ration containing 5% RB; T3: Ration containing 10% RB; T4: Ration containing 15% RB; T5: Ration containing 20% RB; T6: Ration containing 25% RB;*Premix contained: vitamin A, 2,000,000 IU; vitamin D3, 400,000 IU; vitamin E, 1,000 mg; vitamin K3, 400 mg; vitamin B1, 300 mg; vitamin B2, 1,000 mg; vitamin B3, 1,800 mg; vitamin B6, 600 mg; vitamin B12, 2 mg; pantothenic acid, 6,000 mg; folic acid, 200 mg; choline chloride, 40,000 mg; iron, 9,000 mg; copper, 1,000 mg; manganese, 12,000 mg; cobalt, 200 mg; zinc, 14,000 mg; iodium, 200 mg; selenium, 80 mg; Ca, 27. 8%; antioxidant (butylatedhydroxytoluene), 500 mg.
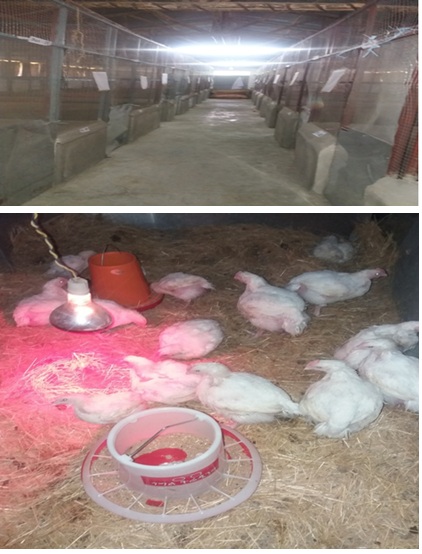 Figure 1: Experimental pen.
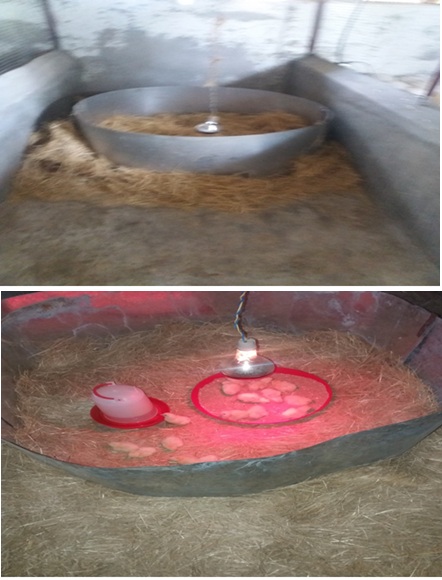 Figure 2: Brooding Ring.
Data collection
Carcass characteristic:On the 49th and 56th days of the feeding trial, two birds (one male and one female) and eight birds /treatment were randomly selected from each replicate. The selected birds were starved for 12 hours, weighed and slaughtered for carcass evaluation. The birds were dry de-feathered. Carcass parts (thigh and drumstick, breast, wings, back) and internal organs (heart, liver, gizzard and gastrointestinal tracts) were measured. Dressed and carcass cuts, edible and non-edible offal were weighed and recorded following to the procedure described [13,14]. Dressed carcass weight were determined after removing blood, feather, shank, head, kidney, lung, pancreas, crop, pro-ventricles, small and large intestine, caecum and urogenital tracts Figure 3.
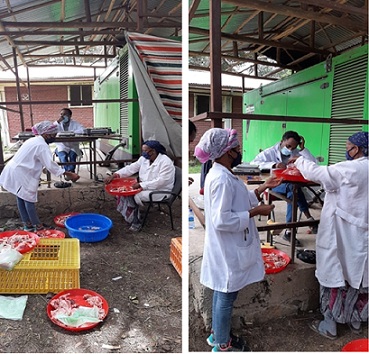 Figure 3: Data collection of Carcass trait and Offal.
The dressing percentages were determined as the proportion of dressed weight and slaughter weight multiplied by 100. Drumstick, thigh and breast, wings and back meat were separated and weighed. Fat deposition around the proventriculus, gizzard, abdominal wall and the cloacae were collected and weighed. The edible offal (giblets), which includes the heart, gizzard and liver were weighed. The weight of crop, proventriculus, liver, small intestinal (duodenum, jejunum and ileum), caeca and large intestine were weighed. The lengths of the parts were measured by using centimeter tape.
Serum evaluation:From the same birds used for carcass evaluation, blood was taken for serum Total Cholesterol (TC) and Total Protein (TP) determination. The blood samples were collected by inserting a sterile needle into the wing vein of the birds and 1ml of blood was collected. The blood samples were then placed inside plain vacutainers and centrifuged at 4000 rpm for 2 minutes in order to separate the serum. The collected sera were stored at-20°C pending analysis.
Organoleptic study:Meat samples from breast, thigh and drumstick were evaluated for color, taste, flavor, juiciness tenderness and over all acceptability by twelve panelists from DZARC staff members in accordance with procedure mentioned by [15]. The samples were cut into pieces and wrapped individually in aluminum foil and roasted in an oven at 180°C for 15 minutes. Pieces from each sample were provided to panelists randomly in such a way that everyone got sample from breast, thigh and drumstick. All panelists that participate in sensory evaluation had training prior to evaluation on sensory evaluation and also received the same training, instruction and understand the descriptors being used during these meat samples evaluations. Each panelist was provided with water to serve as neutralizers between the products. The samples assessed on 5-point hedonic scale (Excellent=5, Very good=4, Good=3, Fair=2 and Poor=1).
Chemical composition of meats:The proximate chemical composition analysis of the breast and thigh muscles carried out. The fresh samples of breast and thigh muscles without skin were separately minced and dried at 65°C for 48hours in oven dry, ground and homogenized and analyzed for DM, fat (EE), crude ash (AOAC 2000). About 2g of partially dried samples were weighed into a pre-weighed crucible dish, and dried in an oven at 102°C overnight to determine the DM. Total fat was extracted using Soxhlet apparatus for 6 hours with diethyl ether (boiling point of 34. 5°C) and the dried residue was weighed for fat content. Ashing carried out by burning the samples at 600°C for 6 hours.
Partial budget analysis
To estimate the profitability of feeding different levels of RB in the broiler production, the partial budget was calculated as the difference between the feed costs incurred during the experimental period per bird and sale of live birds at the end of the experimental period, according to the principles developed by [16]. Market prices of kg weight of birds and the different feed ingredients used for experimental ration formulation at the time of the experiment was considered in the analysis considering the other costs are similar among the treatments.
Statistical analysis
Data analyzed using the General Linear Model (GLM) procedures of [17], with the model containing treatments. Differences between treatment means were separated using Least Significant Difference test. The following model was used for the analysis.
Yij = µ + Ti + eij
Where,
Yij = Dependent variable
µ = Overall mean
Ti= Treatment effect of ith treatment and,
eij= Error term
Results And Discussion
Carcass characteristics
The results of the carcass characteristics and giblet of the experimental chicks fed different levels of rice bran on 49th days of feeding trial are presented in Table 3. The results showed that there was no significant (P>0. 05) difference between all the treatment groups in dressing percentage and the weights of dressed, breast, drumstick and back. On the other side there were significant (P < 0. 05) difference between all the treatment groups in the, slaughtering, thigh, wings, gizzard, heart and liver weights. Thigh weight recorded from the groups fed on the treatment containing 15% rice bran (T4) was significantly (P < 0. 05) higher than that of the groups fed on 10% of rice bran but comparable to that of all the others. Thigh weight of the groups fed on 10% rice bran was significantly less than the others. Wings weight recorded from the groups fed on the treatment containing 20% rice bran (T5) was significantly (P < 0. 05) higher than that recorded from the others and comparable to all treatments with except groups fed on diet containing 10% of rice bran, the value of which significantly less than the others.
The results obtained indicated that inclusion of rice bran into broilers diet had different impact on the anatomical and physiological makeup of the birds. There was slight increase in mean weight of gizzard with increase in the level of inclusion of rice bran in the diets of the experimental chicks. It has been speculated that poultry requires a moderate amount of diet structure, for proper gut development and functionality [18]. Diet structure is critical in stimulating gizzard development, in?uencing digesta passage rate and improving gut motility by enhancing endocrine cholecystokinin release which stimulates the secretion of pancreatic enzymes and gastro duodenal refluxes [18,19]. The results of the current study were in agreement with that of [20] who observed increased size of gastrointestinal tract of birds fed on rice bran. Extended gizzard retention time increases interaction of feed particles with gastric juices and improves digestion and feed ef?ciency [19]. However, the increased gizzard size of birds fed high level of rice bran did not result in increased body weight gain and feed conversion ratio in this study.
|
Parameters |
1Treatments |
|
|
|
|
|
|
|
|
T1 |
T2 |
T3 |
T4 |
T5 |
T6 |
SEM |
|
Slaughtering weight(kg) |
1. 76c |
2. 23a |
2. 01abc |
2. 06ab |
1. 93bc |
2. 00abc |
0. 21 |
|
Dressed weight(kg) |
1. 18 |
1. 42 |
1. 23 |
1. 27 |
1. 19 |
1. 29 |
0. 16 |
|
Dressing % |
68. 15 |
63. 41 |
62. 2 |
61. 94 |
61. 5 |
64. 53 |
5. 41 |
|
Thigh weight (g) |
167. 75ab |
193. 13ab |
165. 63b |
197a |
169ab |
176. 88ab |
89. 64 |
|
Breast weight (g) |
536. 88 |
648. 75 |
561. 25 |
599. 13 |
581. 38 |
600. 63 |
28. 81 |
|
Drumstick weight (g) |
197. 63 |
215. 63 |
195. 63 |
194. 88 |
205. 75 |
189. 38 |
20. 72 |
|
Back weight (g) |
188. 63 |
213. 38 |
181. 25 |
196. 63 |
184. 88 |
196. 25 |
29. 68 |
|
Wing weight (g) |
71. 25ab |
76. 75ab |
65. 00b |
74. 75ab |
79. 13a |
76. 25ab |
8. 28 |
|
Gizzard weight (g) |
31. 73c |
35. 2bc |
35. 28bc |
37. 06abc |
41. 55ab |
42. 03a |
4. 37 |
|
Heart weight (g) |
8. 85c |
13. 08ab |
14. 88a |
12. 95ab |
12. 46ab |
11. 8b |
1. 92 |
|
Liver weight (g) |
39. 45ab |
44. 03a |
38. 313ab |
42. 76a |
44. 05ab |
36. 68b |
3. 97 |
a-cMeans within a row with different superscripts differ significantly (P < 0. 05). RB: rice bran; SEM: standard error of the mean. 1T1: Ration containing 0% RB; T2: Ration containing 5% RB; T3: Ration containing 10% RB; T4: Ration containing 15% RB; T5: Ration containing 20% RB; T6: Ration containing 25% RB.
Table 3: Carcass characteristics and Giblet of the experimental Chicks on 49th day of the feeding trial.
The results of the carcass characteristics and giblet of the experimental chicks fed different levels of rice bran on 56th days are presented in Table 4. The results obtained showed that there were no significant (P>0. 05) difference between all the treatment groups in the slaughter, heart weight on the 56th day of the feeding trial. On the contrary, there were significant (P < 0. 05) difference between the treatment groups in the dressed weight, and dressing percentage and breast, thigh, drumstick, back and wings, gizzard, and liver weights. Significantly higher dressed weight was recorded from T2, the value of which comparable with that of the group fed on T1 and T5 and significantly different from the others. Dressing percentage recorded from the groups fed on the control diet was significantly (P < 0. 05) higher than that recorded from the groups fed on diet containing 15% (T4), and 25% (T6) of rice bran, but comparable with that of all the others. Thigh weight recorded from the groups fed on 5% rice bran (T2) was significantly (P < 0. 05) higher than that of the group fed on 15 and 25% rice bran. Breast weight was recorded from the groups fed on the treatment containing 5% rice bran (T2) was significantly (P < 0. 05) higher than that recorded from the group fed on 10% rice bran. All the groups fed on 0-20% of rice bran were comparable in drumstick weight (231. 25- 276. 88g).
The weight of gizzard significantly increased as the dietary levels of rice bran increased. This may be due to the increased level of dietary fiber contributed by rice bran, which probably stimulated the activity of the gizzard resulting in increased musculature. This result was in agreement with that of [21], who reported that, in the gizzard, the particle size of ingestion is reduced by means of grinding, while the chyme is mixed with the secretions of the proventriculus. To function properly, the gizzard requires mechanical stimulation. Here, the excitatory effect of fibrous materials on the gizzard is well documented [22]. Once ingested items have been ground to a critical size, the particles move into the small intestine. Poultry reflux digests between various locations of the alimentary canal and fibers present in the feed are believed to influence gastro duodenal reflux of digesta[23].
|
Parameter |
Treatments |
|
|||||
|
T1 |
T2 |
T3 |
T4 |
T5 |
T6 |
SEM |
|
|
Slaughtering weight(kg) |
2. 54 |
2. 63 |
2. 31 |
2. 43 |
2. 50 |
2. 33 |
0. 21 |
|
Dressed weight (kg) |
1. 68ab |
1. 73a |
1. 52bc |
1. 49bc |
1. 60abc |
1. 44c |
0. 14 |
|
Dressing% |
66. 06a |
65. 756a |
65. 256ab |
61. 422b |
63. 819ab |
61. 597b |
2. 62 |
|
Thigh weight (g) |
225. 63ab |
228. 75a |
205. 00abc |
200. 00bc |
215. 00abc |
190. 63c |
76. 93 |
|
Breast weight (g) |
733. 13ab |
783. 75a |
658. 13b |
691. 25ab |
762. 50ab |
673. 75ab |
21. 11 |
|
Drumstick weight (g) |
265. 00a |
276. 88a |
245. 63ab |
231. 25ab |
246. 88ab |
225. 63b |
18. 90 |
|
Back weight (g) |
215. 63ab |
231. 25a |
198. 75ab |
211. 88ab |
212. 50ab |
195. 00b |
22. 85 |
|
Wings weight (g) |
80. 63abc |
77. 50bc |
70. 63c |
86. 88ab |
95. 63a |
86. 25ab |
10. 24 |
|
Gizzard weight (g) |
39. 38b |
43. 75a |
36. 88b |
40. 00ab |
45. 00a |
42. 50ab |
4. 35 |
|
Heart weight (g) |
14. 00 |
14. 38 |
13. 13 |
12. 50 |
12. 50 |
11. 25 |
2. 69 |
|
Liver weight (g) |
54. 38ab |
58. 13a |
49. 38bc |
49. 38bc |
46. 25c |
45. 00c |
4. 79 |
a-cMeans within a row with different superscripts differ significantly (P < 0. 05). RB: rice bran; SEM: standard error of the mean. 1T1: Ration containing 0% RB; T2: Ration containing 5% RB; T3: Ration containing 10% RB; T4:Rationcontaining 15% RB; T5: Ration containing 20% RB; T6: Ration containing 25% RB.
Table 4: Carcass characteristics and Giblet of the experimental Chicks on 56th day of the feeding trial.
Weight and length of the gastro intestine
The results of the weight and length of the gastro-intestine of the experimental chicks fed on different levels of rice bran are presented in Table 5. The results obtained showed that there were no significant (P>0. 05) difference between all the treatment groups in mean weight of Gastro-Intestinal Tract (GIT) with content, proventriculus and proventriculus length. On the contrary, there was significant (P < 0. 05) difference between the treatment groups in the mean empty weight of GIT, crop, caeca, abdominal fat, small intestinal, large intestinal and length of crop, small intestine, large intestine and caeca. The mean intestinal weights of the birds fed on the control diet was signi?cantly lighter (P < 0. 05) than that of the others. The empty GIT of birds fed on control diet was significantly different from that of birds fed on different levels of rice bran. The mean empty weight of the GIT, small intestinal and caeca showed slight increase with increased levels of inclusion of rice bran in to the diets of the experimental birds Figure 4.
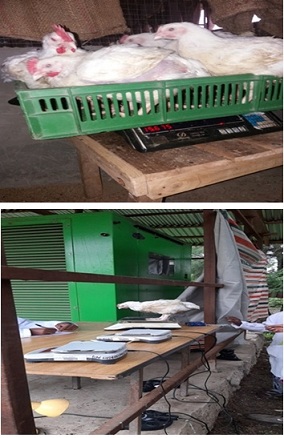 Figure 4: Body weight weighing.
Higher intestine weights could be due to the presence of higher level of dietary ?ber. The results of this study was in agreement with that of [24]who reported that elevated levels of ?ber increased the size of the digestive system. The length of intestine, particularly the length and weight of the cecum increased with increased level of ?ber in the diet. Caecum length of the groups fed on 5-25% of rice bran was significantly higher (p < 0. 05) than the groups fed on control treatment diet and found to be pronounced in the case of the groups fed on 20-25% rice bran. [21] Stated that fibrous diets have increased the weight of viscera due to increase in gizzard and intestine activity. Factor responsible for this, may include arabinoxylans which constitute the bulk of the hemcelluloses in rice bran. Moreover, it was reported that gizzard erosion increased with high levels of rice bran inclusion due to high silicon content of nature of rice bran.
|
Parameter |
Treatments |
|
|||||
|
T1 |
T2 |
T3 |
T4 |
T5 |
T6 |
SEM |
|
|
GIT with contentweight (g) |
93. 34 |
91. 18 |
89. 58 |
92. 9 |
81. 96 |
92. 06 |
11. 09 |
|
GIT without content weight(g) |
61. 59b |
70. 65ab |
66. 75ab |
72. 45a |
72. 39a |
74. 8a |
6. 67 |
|
Crop weight (g) |
4. 78b |
6. 24ab |
6. 44a |
5. 75ab |
7. 11a |
6. 8a |
1. 07 |
|
Proventriculus weight (g) |
9. 29 |
9. 36 |
8. 9 |
9. 59 |
8. 76 |
8. 69 |
1. 24 |
|
Weight of small intestine(g) |
43. 45c |
61. 88ab |
56. 33b |
68. 4a |
60b |
56. 4b |
5. 13 |
|
Weight of large intestine(g) |
3. 24a |
2. 79ab |
1. 99b |
2. 55ab |
2. 93ab |
2. 5ab |
0. 69 |
|
Caeca weight (g) |
7. 19ab |
11. 91a |
6. 04b |
9. 23ab |
7. 65ab |
7. 61ab |
3. 4 |
|
Abdominal fat weight (g) |
6a |
5. 75a |
4. 63b |
5. 44ab |
5. 7a |
5. 44ab |
0. 72 |
|
Crop length (cm) |
4. 69a |
3. 56b |
4ab |
3. 94ab |
3. 75ab |
4. 19ab |
0. 71 |
|
Proventriculus length (cm) |
188. 88 |
206. 25 |
192. 88 |
202. 75 |
200. 25 |
208. 38 |
15. 4 |
|
Length of SI (cm) |
6. 7c |
9a |
7. 75bc |
6. 75c |
7. 125c |
9. 875a |
0. 96 |
|
Length of LI (cm) |
18. 05b |
22. 313a |
17. 25b |
19b |
17. 625b |
22. 75a |
1. 84 |
|
Caeca Length(cm) |
11. 24b |
14. 1ab |
17. 75a |
17. 33ab |
18. 41a |
19. 48a |
4. 21 |
a-cMeans within a row with different superscripts differ significantly (P < 0. 05). LI: large intestine; RB: rice bran; SEM: standard error of the mean; SI: small intestine. 1T1: Ration containing 0% RB; T2: Ration containing 5% RB; T3: Ration containing 10% RB; T4: Ration containing 15% RB; T5: Ration containing 20% RB; T6: Ration containing 25% RB.
Table 5: The weight and length of the gastro intestinal parts of the experimental Chicks.
Chemical composition of meat
The results of the chemical composition of the meat (breast and thigh muscles) are presented in Tables 6 and 7 respectively. The percent composition of moisture, EE and ash of the breast muscle was significantly affected (P < 0. 05) by inclusion of rice bran in the diet (Table 6). The percentage of dry matter of the breast meat of birds fed on control diet (T1) was significantly higher (P < 0. 05) than the groups fed on the treatment containing 10% rice bran (T3). The percentage composition of EE of the breast muscle of the groups fed on the control treatment (T1) and the groups fed on the treatment containing 20% rice bran(T5) were significantly lower (p < 0. 05) than the others without showing difference between each other’s. Significantly higher (P < 0. 05) content of EE (7. 51) was recorded from the groups fed on the treatment containing 15% rice bran (T4). There was no significant difference (P>0. 05) between the groups fed on the treatment containing 5,10 and 25% of rice bran (T2, T3 and T6) in terms of percent composition of EE of breast muscle meat. There was increase in the ash content of breast muscle meat of the experimental chicks with increase in the level of inclusion of rice bran in the diets (Table 6). The dry matter content of breast muscle of the groups fed on 10% rice bran (T3) was significantly lower than the groups fed on control diet(T1) and crude ash content of breast muscle of birds fed control diet (T1) was lower than that of the birds fed on 25% of rice bran. The dry matter content of thigh meat of birds fed on the control diet (T1) was significantly higher (P < 0. 05) than that of the groups fed on the treatment containing 15 and 25% of rice bran (T4 and T6). The EE content of the thigh meat of the groups fed on control diet (T1) was similar with the groups fed on the treatment containing 5 and 20% of rice bran (T2 and T5).
Poultry meat contains more of poly unsaturated fatty acids [25]. In this study fat and ash content ranging between 4. 68-7. 51 and 6. 1-9. 03% was recorded from the groups fed on the treatments containing 0-25% of rice bran respectively. The fat content obtained from the current study was in line with that of [26]who reported fat content ranging between 1. 0 to 17. 4% from the chicks fed on different levels rice bran. On the other side, the ash content obtained from the current study was contrary to that of [26]who reported ash content ranging between 0. 7% and 3. 6% from the chicks fed on different levels rice bran.
|
Parameter |
Treatments |
|
|||||
|
T1 |
T2 |
T3 |
T4 |
T5 |
T6 |
SEM |
|
|
DM |
90. 31ab |
88. 87bc |
88. 54c |
90. 07abc |
90. 80a |
90. 29ab |
0. 98 |
|
EE |
4. 69c |
5. 71b |
5. 46b |
7. 51a |
4. 68c |
5. 42b |
0. 32 |
|
Ash |
5. 57b |
6. 06b |
9. 03a |
8. 44a |
6. 1b |
8. 67a |
0. 88 |
a-cMeans within a row with different superscripts differ significantly (P1 = Ration containing 0% rice bran. T2 = Ration containing 5% rice bran, T3 = Ration containing 10% rice bran. T4 = Ration containing 15% rice bran. T5 = Ration containing 20% rice bran and T6 =Ration containing 25% rice bran.
Table 6: Chemical composition of breast muscle of broilers fed ration containing different levels of rice bran.
|
Parameter |
Treatments |
|
|||||
|
T1 |
T2 |
T3 |
T4 |
T5 |
T6 |
SEM |
|
|
DM |
90. 54a |
90. 75a |
89. 96ab |
88. 43c |
89. 52abc |
89. 28bc |
0. 7 |
|
EE |
7. 53b |
7. 71b |
9. 60a |
4. 67c |
8. 09b |
10. 05a |
0. 34 |
|
Ash |
11. 38b |
7. 71de |
8. 81cd |
12. 71a |
9. 02c |
6. 73e |
0. 71 |
a-e Means within a row with different superscripts differ significantly (P < 0. 05);SEM: Standard Error of the Mean;DM: Dry Matter; EE: Ether Extract; T1 = Ration containing 0% rice bran. T2 = Ration containing 5% rice bran, T3 = Ration containing 10% rice bran. T4 = Ration containing 15% rice bran. T5 = Ration containing 20% rice bran and T6 =Ration containing 25% rice bran.
Table 7: Chemical composition of thigh muscle of broilers fed ration containing different levels of rice bran
Sensory evaluation
The results of the sensory test on breast, thigh and drumstick are presented in Tables 8 and 9 respectively. The results obtained indicated that inclusion of 5-25% of rice bran into starters and finishers broilers diet had no effect on the taste, flavor, and tenderness and over all acceptability of roasted breast, thigh and drumstick meat. All the treatment groups recorded grade point of >3 on the hedonic scaleFigure 5. There was no statistically significant difference (P>0. 05) in the breast meat of all the treatment groups in juiciness. On the other side the juiciness of thigh and drumstick of birds fed on the treatment containing 5% of rice bran (T2) was significantly different from that of the birds fed on 10-25% of rice bran. The breast meat of birds fed on 15% (4. 33) rice bran was (P < 0. 05) significantly different among all treatments. There was significant difference (P < 0. 05) in the color and juiciness of roasted thigh and drumstick. The colour registered from roasted thigh and drumstick (4. 33 & 4. 22) of the birds fed on the treatment containing 15% rice bran (T4) was significantly different (P < 0. 05) from the others, but comparable to that of the groups fed on control treatment diet(T1).
 Figure 5: Sensory of evaluation of roasted breast, thigh and drumstick meat.
There are several factors that influence consumer preferences for broiler meat, the major one being meat flavor. Chicken meat flavor results from volatile compounds generated from lipid degradation and maillard reaction or the interaction between these two factors after heating [27]. Flavor is therefore a reserve of roasted meat as opposed to raw meat. Taste and smell are the two sensory attributes that are collectively termed as flavor. Chicken diet, fatty acid composition, lipid class and glutamic acid content of the meat, are among other factors that influence roasted chicken meat flavor [28]. Appearance, flavor, aroma and texture of the meat can lead the decision of a consumer to purchase meat [28].
[29] Indicated that color of the meat is important attributes consumers use to select poultry products, and to purchase and evaluate the final quality. According to [30], color is a major indicator of quality of meat, as the appearance influences consumer acceptance. The main factors that contribute to the color of poultry meat are the myoglobin content, and pH of the meat [31]. In the current study the color registered from roasted thigh and drumstick was higher than that of breast meat. The results of the current study were in agreement with that of [32] who reported myoglobin content is higher in thigh in comparison to breast. The similar colour of breast meat of the birds fed control diet with that of birds fed on the diet containing rice bran in this study is an indication that rice bran did not imparted strange color to the meat.
The juiciness of drumstick and thigh increased slightly, with the increased level of inclusion rice bran in broiler diets. The control diet did not differ significantly from the diet containing different levels of rice bran in juiciness in drumstick and thigh, indicating that inclusion of rice bran into broiler diet has not effect on meat juiciness. Juiciness in meat arises from moisture released by meat during chewing, and moisture from saliva[33]. Juicier meat appears more palatable than less juicy ones. It has been suggested that the juiciness feeling is made up of two organoleptic elements. The impression of wetness during first chews produced by the rapid release of meat fluid, and sustained juiciness largely is due to the stimulatory effect of fat on salivation [34]. Juiciness is directly related to tenderness. More tender meat readily liberates juices during chewing, compared with tougher meat [33].
In the current study, the results of roasted breast meat thigh and drumstick of the experimental broiler fed on all the treatment diets were similar (>3) in taste, color, flavor, juiciness, tenderness and overall acceptability. The sensory test results suggest that inclusion of rice bran in to broiler diets had no negative implication on consumer preference.
|
Parameter |
Treatments |
|
|||||
|
T1 |
T2 |
T3 |
T4 |
T5 |
T6 |
SEM |
|
|
Color |
3. 75ab |
3. 42b |
4. 33a |
3. 58b |
3. 25b |
3. 33b |
0. 81 |
|
Taste |
3. 19 |
3. 58 |
3. 58 |
3. 75 |
3. 58 |
3. 5 |
0. 89 |
|
Flavor |
3. 5 |
3. 8 |
3. 83 |
3. 42 |
3. 67 |
3. 42 |
0. 79 |
|
Juiciness |
3. 75 |
4. 08 |
3. 83 |
4. 08 |
4. 08 |
3. 67 |
0. 81 |
|
Tenderness |
3. 92 |
3. 58 |
3. 58 |
3. 75 |
3. 58 |
3. 5 |
1. 01 |
|
Over all acceptability |
3. 67ab |
3. 67ab |
4ab |
3. 83ab |
3. 42b |
3. 5ab |
0. 66 |
a-bMeans within a row with different superscripts differ significantly (P1T1: Ration containing 0% RB; T2: Ration containing 5% RB; T3: Ration containing 10% RB; T4: Ration containing 15% RB; T5: Ration containing 20% RB; T6: Ration containing 25% RB.
Table 8: Effect of rice bran inclusion in the diets of Broiler on the sensory evaluation ofbreast meats.
|
Parameter |
Treatments |
|
|||||
|
T1 |
T2 |
T3 |
T4 |
T5 |
T6 |
SEM |
|
|
Color |
3. 58c |
4. 17abc |
4. 42a |
4. 17abc |
3. 75bc |
4. 33ab |
0. 78 |
|
Taste |
3. 83 |
3. 75 |
3. 58 |
3. 67 |
3. 75 |
4. 17 |
0. 76 |
|
Flavor |
3. 5 |
3. 5 |
3. 75 |
3. 67 |
3. 67 |
3. 58 |
0. 87 |
|
Juiciness |
3. 92ab |
3. 42b |
4. 08a |
4. 25a |
4. 08a |
4. 17a |
0. 79 |
|
Tenderness |
3. 83 |
3. 67 |
4. 33 |
4. 33 |
3. 75 |
4 |
0. 83 |
|
Over all acceptability |
3. 92 |
3. 83 |
4. 00 |
4. 08 |
3. 92 |
4. 08 |
0. 61 |
a-bMeans within a row with different superscripts differ significantly (P < 0. 05). RB: rice bran; SEM: standard error of themean. 1T1: Ration containing 0% RB; T2: Ration containing 5% RB; T3: Ration containing 10% RB; T4: Ration containing 15% RB; T5: Ration containing 20% RB; T6: Ration containing 25% RB.
Table 9: Effect of rice bran inclusion into Broilers diets on the sensory evaluation of thigh and drumstick meats.
Serum evaluation
The results of the blood serum cholesterol and protein content are presented in Table 10. There was no statistically significant difference (P>0. 05) between all the treatment groups in serum concentration of cholesterol and protein. According to Table10, the serum cholesterol level of all the treatment groups ranged between 117. 93 and 119. 73 mg/dl. Total serum protein has been reported as an indication of the protein retained in the animal body [35]. The total serum proteins obtained from the current study was in the range of 2. 93 -3. 50g/dl. The relatively greater total serum protein content of broilers receiving dietary rice bran might be an indication of the good protein content. Blood or serum cholesterol is much affected by genetic, feed, and medicines factors [36]. Cholesterol is originated from feed (exogen cholesterol) and cholesterol produced by bodies itself (endogen cholesterol). Cholesterol originated from feed play an important role since it is the major source of sterol in the body, cell surface component, and intracellular membrane [36]. The results of the current study were contrary to that of [37] who reported that fiber has correlation with low cholesterol level of blood or serum of broilers. In the present study, bird’s fed diet containing rice bran tended to have lower cholesterol level than birds fed on control diet and there was tendency of decrease in serum cholesterol level with increased level of inclusion of rice bran in the diet of the experimental chicks Figure 6.
|
Parameters |
Treatments |
SEM |
|||||
|
T1 |
T2 |
T3 |
T4 |
T5 |
T6 |
|
|
|
Cholesterol level (mg/L) |
119.73 |
118.80 |
119. 07 |
118. 63 |
118. 13 |
117. 93 |
1. 04 |
|
Protein level (g/dl) |
2. 94 |
2. 93 |
3. 50 |
3. 03 |
3. 24 |
3. 13 |
0. 36 |
RB: Rice Bran; SEM: Standard Error of the Mean. 1T1: Ration containing 0% RB; T2: Ration containing 5% RB; T3: Ration containing 10% RB; T4: Ration containing 15% RB; T5: Ration containing 20% RB; T6: Ration containing 25% RB.
Table 10: Serum total cholesterol and protein levels of the experimental Broilers
 Figure 6: Serum Centrifuges.
Partial budget analysis
The results of the partial budget analysis based on 56 days of the feeding trial are presented in Table 11. During the analysis, it was assumed that the cost of ingredients and the sale of live birds at the end of the feeding trial were the only source of costs and profits respectively. The other costs including transportation cost were considered as similar among all treatments. The results obtained indicated that the price of starter and finisher broiler diets (birr/Kg) showed proportional reduction with replacement of maize with rice bran in the diet of the experimental chicks. During the starter phase the mean daily feed consumption of the birds placed on control diet (T1) and the diets containing 5, 10 and 25% of rice bran were comparable and different from that of birds placed on diets containing 15 and 20% of rice bran. There was no significant difference (P>0. 05) between all the treatment groups in mean feed consumption during the finisher’s period.
The results obtained showed that cost of feed (birr/bird) was significantly lower (P5 and T6) than the others both during starters and finishers phases. Thus, the results obtained indicate that the birds placed on the diets containing 20-25% of rice bran produced at cheaper rate compared to the others. Feed cost (birr/bird) was significantly (P
The results obtained showed that feeding broilers on the diet containing 20-25% rice bran was found to be cheapest because of the lower cost of starter feed which ranged between 20. 95 and 21. 25 birr/kg. The cost of control treatment diet was 18. 62birr/kg indicating that 26. 38birr/bird was required in rearing birds during the starters phase. Feeding of the experimental birds on finishers ration containing 20-25% rice bran resulted in comparatively lower cost of production (76. 16birr- 75. 53birr/bird) than the control diet. Production feed cost was higher for the groups fed on groups fed on 0-15% rice bran (82. 8-80. 4 birr/bird). Raising of the groups fed on the control treatment diet to an age of 56 days required 109. 175birr/bird, the value of which was significantly higher(P < 0. 05) than the groups raised on the treatment containing 20-25% rice bran.
The groups fed on the control treatment diet attain live body weight of 2. 64 kg/head at an age of 56 days while the groups fed on 25% rice bran attained live body weight of 2. 39 kg/head at an age of 56 days. Market price of live birds at the end of feeding trial was determined by negotiation between seller and buyer and it was estimated that the 3kg of birds were sold 400 birr. Thus, the market price of the bird at the time of conducting the experiment was calculated to be 133birr/kg and heavier birds fetched higher prices. The groups fed on control treatment diet are calculated to be sold at 352. 56 birr/head, while the groups fed on the treatment containing 25% of rice bran was calculated to be sold at 318. 58birr/head. Gross profit margins were assumed to be the difference between the total cost of feeds and sale of birds on a live weight basis. According to these assumptions birds fed on all experimental diets recorded statistically similar gross profit margins, cost benefit ratio and return on investment. Based on economic analysis it can be summarized that there is feasibility of replacing 25% of energy value of maize with rice bran in broilers ration.
|
Item |
Experimental diets |
SEM |
|||||
|
|
T1 |
T2 |
T3 |
T4 |
T5 |
T6 |
|
|
Cost of feed (birr/Kg) |
|
|
|
|
|
|
|
|
Starter |
18. 62a |
17. 89b |
17. 31c |
16. 84d |
16. 23e |
15. 66f |
0. 00 |
|
Finisher |
17. 49a |
16. 85b |
16. 21c |
15. 93d |
15. 5e |
15. 10f |
0. 00 |
|
Feed intake in Kg |
|
|
|
|
|
|
|
|
Starter |
1. 47a |
1. 34a |
1. 37ab |
1. 32b |
1. 29b |
1. 36ab |
0. 09 |
|
Finisher |
4. 73 |
4. 82 |
4. 498 |
5. 05 |
4. 92 |
5. 01 |
0. 27 |
|
Cumulative feed intake |
6. 2 |
6. 16 |
6. 34 |
6. 37 |
6. 21 |
6. 36 |
0. 30 |
|
Cost of feed (birr/bird) |
|
|
|
|
|
|
|
|
Starter |
26. 38a |
23. 97b |
23. 68b |
22. 2bc |
20. 95c |
21. 25c |
1. 48 |
|
Finisher |
82. 8a |
81. 13ab |
80. 58ab |
80. 4ab |
76. 16b |
75. 53b |
4. 35 |
|
Total feed cost (C) |
109. 18a |
105. 10a |
104. 26ab |
102. 6abc |
97. 11bc |
96. 79c |
5. 00 |
|
LW at end feeding trial |
2644. 8a |
2632a |
2474. 5ab |
2457. 1ab |
2473. 6ab |
2389. 9b |
160. 00 |
|
Sale of birds |
352. 56a |
350. 85a |
329. 86ab |
327. 53a |
329. 74ab |
318. 58b |
21. 33 |
|
Gross profit margin |
243. 38 |
247. 76 |
225. 6 |
224. 93 |
232. 63 |
221. 79 |
19. 82 |
|
Cost benefit ratio |
2. 23 |
2. 34 |
2. 17 |
2. 19 |
2. 4 |
2. 29 |
0. 20 |
|
Return on Investment |
134. 25 |
140. 66 |
121. 34 |
122. 33 |
135. 52 |
125. 01 |
19. 51 |
a-fMeans within a row with different superscripts differ significantly (P < 0. 05). LW: Live weight; RB: Rice Bran;SEM: Standard Error of the Mean. 1T1: Ration containing 0% RB; T2: Ration containing 5% RB; T3: Ration containing 10% RB; T4: Ration containing 15% RB; T5: Ration containing 20% RB; T6: Ration containing 25% RB.
Table 11: Economic analysis of including Rice bran in Broiler diets.
Conclusion and Recommendation
Conclusion
The aim of this experiment was to evaluate carcass composition and meat quality characteristics and economic feasibility of broiler chicks fed different levels of rice bran for duration of 56 days. The results obtained indicated that there was significant difference between the treatment groups in the carcass composition, meat quality characteristics and economic feasibility of the experimental birds. The results obtained also indicated that rice bran can be included at up to 15-20% in starter and finisher broilers diet without detrimental effects on the production performance of the birds. Depending on the production parameters measured and the availability and market price of rice bran, the use of this by-product in poultry replacing energy value of cereal grains seems to be appealing under the current Ethiopian conditions.
Recommendation
Based on the results of the current study 15 and 20% of rice bran could safely and economically be included in to starters and finishers broilers ration respectively. Further research is required in the area of treatment of rice bran aimed at the inclusion of higher levels in poultry feeding system in Ethiopia.
References
- Onyimonyi AE, Olabode A, Okeke GC(2009) Performance and economic characteristics of broilers fed varying dietary levels of Neem leaf meal (Azadirachtaindica). Int J PoultSci 8: 256-259.
- Abd El-Hack M, Alagawany M, Farag M,Dhama K (2015) Use of maize distiller’s dried grains with soluble (DDGS) in laying hen diets: Trends and advances. Asian J Ani Veter Advance10: 690-707.
- Atawodi S, Mari J, Atawodi, YahayaY (2008) Assessment of Leucaenaleucocephalaleaves as feed supplement in laying hens. African Journal of Biotechnology7: 317-321.
- Maurer V,Holinger M,AmslerZ, Früh B,Wohlfahrt J,et al. (2016) Replacement of soybean cake by Hermetiaillucens meal in diets for layers. J Insect Food Feed 2:83-90.
- Shiferaw B,Prasanna B,Hellin J,Bänziger M (2011) Crops that feed the world 6. Past successes and future challenges to the role played by maize in global food security. Food security 3: 307.
- Kanengoni A,Chimonyo M,Ndimba B,Dzama K (2015) Potential of using maize cobs in pig diets—A review. Asian-Australas J AnimSci28: 1669-1679.
- Tacon A,Metian M (2009) Fishing for Aquaculture: Non-food use of small pelagic forage fish-a global perspective. Rev Fish Sci 17: 305-317.
- DenizG,Orhan F,Gencoglu H,Eren M,Gezen S, et al. (2007) Effects of different levels of rice bran with and without enzyme on performance and size of the digestive organs of broiler chickens Revue Médicinal. Vétrinary 158: 336-343.
- Rezaei M (2006) Utilization of rice bran in laying hen diets. Pakistan Biology Science 9: 1420-1423.
- Warren B,Farrel D (1990a) The nutritive value of full-fat and defatted Australian rice bran III. The apparent digestibility energy content of defatted rice bran in rats and pigs and the metabolizable energy and nutrients in broiler chicken and adult cockerels. Anim Feed Sci Tech 27: 247-257.
- Parakash J (1996) Rice bran proteins: Properties and food uses. Crit Rev Food SciNutr 36: 537-552.
- DZARC (DebreZeit Agricultural Research Center)(2003) Annual Research Report 2002/03, Ethiopian Institute of Agricultural Research, DebreZeit, Ethiopia.
- Kubena LF, Deaton JW, Chen TC, Reece FN(1974) Factors influencing the quality of abdominal fat in broilers. III. Feed and dietary levels. J Poultry Sci 53: 974-978.
- Kekeocha (1985) Introduction to poultry keeping. In: Poultry production hand book, Pfizer Corporation, Nairobi pp. 1-15.
- Peryam D,Girardot N (1952) Advanced taste-test method. Food Engineering 24: 58-61.
- Upton M (1979) Farm management in Africa: the principle of production and planning. Oxford University Press, Great Britain pp: 282-298.
- SAS(2002) Statistical analysis systems for mixed models. SAS Institute Inc, Cary, NC, USA.
- Mateos G, Jimenez E, SerranoM, Lazaro R (2012) Poultry response to high levels of dietary ?RP sources varying in physical and chemical characteristics. J Appl Poultry Res 21:156e74.
- Xu Y, Stark C,Ferket P, Williams C, Pacheco W,et al. (2015) Effect of dietary coarsely ground corn on broiler live performance, gastrointestinal tract development, apparent ileal digestibility of energy and nitrogen, and digesta particle size distribution and retention time. Poultry Science 94:53-60.
- Wang G, Marquardt R,GuenterW, ZhangM, Han Z (1997) Effects of enzyme supplementation and irradiation of rice bran on the performance of growing Leghorn and broiler chickens. Animal Feed SciTechnol 66:47-61.
- Yakubu B,Adebgola T,Bogoro S,Yussuf H (2007) Effect of urea treated and Untreated rice offal on the performance of Broiler Chickens, carcass yield and Characteristics of internal organs. J Sustainable Development in Agric Environ 3: 14-19.
- Rogel A,Balnave D,Bryden W,Annisan E (1987) Improvement of raw potato starch. Digestion in chickens by feeding oat hulls and other fibrous feedstuffs. Australian JAgricRes38:629-637.
- Duke G (1988) Alimentary canal: Anatomy, regulation of feeding and motility. Avian physiology pp. 269-288.
- Jorgensen W, Maxwell D, Tirado-Rives J (1996) Development and testing of the OPLS all-atom force field on conformational energetics and properties of organic liquids. J Am ChemSoc 118: 11225-11236.
- Valsta LM,Tapanainen H,Männistö S (2005) Meat fats in nutrition. Meat Sci 70: 525-530.
- Demby J, Cunningham F (1980) Factors affecting composition of chicken meat. A Literature review. World’s Poultry SciJ 36: 25-67.
- Shi H,Ho C (1994) The flavour of poultry meat. In: Flavor of meat and meat products pp. 52-70.
- Jayasena D, Jo C (2013) Essential oils as potential antimicrobial agents in meat and meat products: A review. Trends Food Sci Tech 34: 96-108.
- Qiao M, Fletcher DJ, Northcutt JK, Smith D (2002) The relationship between raw broiler breast meat color and composition. Poultry Sci 81:422-427.
- Bell DD, Weaver WD(2002) Commercial chicken meal and egg production (5thedn). Kluwer Academic Publishers.
- Wattanachant S (2008) Factors affecting the quality characteristics of the indigenous chicken meat. Suranaree. JSciTechnol 15:317-322.
- Cori M,Michelangeli C,Basilio V, Figueroa R, Rivas N (2014) Protein solubility, myoglobin content, color and pH in chicken, hen and quail meat. Archivos de Zootecnia 63: 133-143.
- Christensen, et al. (2000).
- Thompson JM(2004) The effects of marbling on flavour and juiciness scores of cooked beef, after adjusting to a constant tenderness. Australian J ExpAgric 44: 645-652.
- Esonu B,Emenalom A,Udedibie U, Herbert C,Ekpor I,et al. (2001) Performance and blood chemistry of weaner pigs fed raw mucuna (Velvet bean) meal. Tropical Anim Prod 4: 49-54.
- Muchtadi D,Palupi N,Astawan M (1993)MetabolismeZatGizi: Sumber, FungsidanKebutuhanbariTubuhManusiaJilid II (Jakarta:PustakaSinarHarapan).
- Delaney B,Nicolosi R,Wilson T, Carlson T, Frazer S,et al. (2003) β-Glucan fractions from barley and oats are similarly antiatherogenic in hypercholesterolemic Syrian golden hamsters. J Nutr133: 468-475.
Citation: Edea C, Alewi M, Demeke S, Tesfaye E (2021) Effect of Inclusion of Different Levels of Rice (OryzaSativa) Bran on the Production Performance of Broiler Chicken. J Anim Res Vet Sci 5: 031.
Copyright: © 2022 Chala Edea, et al. This is an open-access article distributed under the terms of the Creative Commons Attribution License, which permits unrestricted use, distribution, and reproduction in any medium, provided the original author and source are credited.