FTIR Spectroscopy - A Potential Tool to Identify Metabolic Changes in Dementia Patients
*Corresponding Author(s):
Alexandra NunesDepartment Of Medical Sciences, IBiMED, University Of Aveiro, Aveiro, Portugal
Tel:+351 234370213,
Email:alexandranunes@ua.pt
Abstract
Alzheimer’s Disease (AD) diagnosis frequently relies on patient’s cognitive evaluation deficits and exclusion criteria often implemented in advanced stages of dementia, when it is too late for effective therapeutic intervention. In order to improve early AD diagnosis and therapeutic interventions, novel approaches for AD biomarker identification and validation need to be developed. These comprise metabolomics based strategies, including Fourier Transform Infrared Spectroscopy (FTIR) that has gained increasing attention in the clinical diagnostics field.
The present work aims to contribute to identify the main metabolic changes that occur during neurodegeneration, by monitoring plasma biochemical alterations that can aid in dementia/cognitive impairment diagnosis, through FTIR analysis. Principal Component Analysis (PCA) was applied to spectral data (45 plasma samples) at 3 specific regions: 3500-2700 cm-1, 1700-1400 cm-1 and 1200-900 cm-1. Plasma samples from cognitive impaired individuals exhibit the presence of higher content of saturated lipids, carboxylic acids, reactive carbonyls, and other molecules related to oxidative stress (ROS and NOS species), and protein modifications. Taken together the data obtained in this preliminary work strongly supports that FTIR has potential in diagnosing cognitive impairment, identification of disease states and may prove to also be of prognostic value.
Keywords
INTRODUCTION
Dementia is associated with neurodegenerative diseases, characterized by chronic and progressive cognitive decline. Typically dementia affects individuals 65 years old or more, but can affect younger individuals. The most common symptom is memory loss, but other mental abilities such as communication and language, learning, problem solving, visual perception of space, capacity to make judgments and ability to concentrate can be affected. Furthermore, motor skills and social capacities can also suffer. These alterations are related to neuronal damage and loss of communication at different and specific brain areas that characterize each type of dementia [1,2].
Dementia affects individuals all over the world; the last report of Alzheimer’s Disease International, estimates that in 2015, 46.8% of the world population was living with dementia and that probably in 2030 the number will double to affect 74.7 million people. In Europe it is estimated that 10.5 million individuals develop some type of dementia [3,4]. There are different types of dementia like Alzheimer’s Disease (AD), Vascular Dementia (VaD), Frontotemporal Dementia (FTLD), Dementia with Lewy Bodies (DLB) and Parkinson’s Disease Dementia (PDD). Alzheimer’s disease is the most common type of dementia and accounts for 60% of all dementia cases. The second most common form of dementia is DLB [5,6].
Current diagnosis of AD is based on medical history, physical examination, laboratory tests, neuroimaging and neuropsychological evaluation, that leads to diagnosis accuracy of around 80%. Although tests are available for excluding certain causes of dementia, the results rarely allow the clinician to make a conclusive diagnosis, particularly at early stages of cognitive decline. For AD, full diagnosis involves postmortem analysis of the brain by confirming the presence of neuropathological hallmarks (accumulation of neuritic plaques and neurofibrillary tangles). Thus, it is important to have an early and accurate diagnosis of dementia to exclude other types of problems that can lead to cognitive impairment, such as depression, anxiety and sleep disorders and subsequently to choose the appropriate therapy. Early diagnosis can take advantage of biomarkers that may likewise aid the prognosis and assist in controlling the medication’s side effects [7-9].
AD biomarkers are important for early diagnosis; the core CSF(Cerebrospinal Fluid) biomarkers of neurodegeneration (T-tau, P-tau and Aβ42), CSF NFL and plasma T-tau were strongly associated with AD and associated with mild cognitive impairment. T-tau, P-tau, Aβ42 and NFL in CSF should be used in clinical practice and clinical research [10].
A range of biomarkers exists, among them metabolites. In fact metabolomics has been used to identify biochemical pathways alterations linked to several diseases and recently it has started to be applied as a non-targeted approach to biomarkers discovery in neurodegenerative disorders. This technique involves the detection and quantitation of all the low-molecular-weight molecules and metabolites present in cells, tissues or organisms under a set of given conditions and can be used either in biological fluids (plasma, urine and CSF), animal models and tissue or cell cultures, being thus useful for dementia/cognitive impairment diagnosis [11]. Among metabolic techniques used are Infrared (IR) and Raman spectroscopy, which can provide information of the chemical composition and molecular structure of analyzed samples [8,12-15].
Spectroscopy has recently appeared as one of the major tools for biomedical applications and has made significant progress in the field of clinical diagnostics. Vibrational spectroscopy has some advantages because it is a reagent-free screening method that allows a non-destructive diagnosis. These techniques are relatively simple, reproducible, involve a minimum sample preparation and needs small amounts of biological material [16,17].
FTIR, a type of vibrational spectroscopy, is a global, sensitive, and highly reproducible physicochemical analytical technique that identifies structural moieties of biomolecules on the basis of their IR absorption. The basic principle of this technique is when an organic molecule is exposed to infrared radiation, the radiant energy matches the energy of a specific molecular vibration and absorption occurs. FTIR can help to identify unknown materials, determine the quality or consistency of a sample and define the amount of components in a mixture. Some advantages of FTIR include the following: accuracy; reproducibility and reliability for positive identification of virtually any sample; it is also very sensitive allowing the identification of even the smallest contaminant making it useful for quality control or quality assurance. The sensitivity and accuracy of the detectors and a wide variety of software algorithms increased the practical use of infrared for quantitative analysis [18,19]. Thus, FTIR is a rapid, high-throughput and non-destructive technique that can be used in the analysis of different types of samples. At the same time it can analyze carbohydrates, amino acids, fatty acids, lipids, proteins, nucleic acids and polysaccharides with a minimum amount of sample preparation. FTIR is also less expensive than other techniques (mass spectrometry or resonance magnetic spectroscopy) because the equipment is cheaper and requires no specialized personnel to operate [13,20].
The use of blood-based biomarkers in the diagnosis of neurodegenerative diseases can have advantages because it involves minimally invasive procedure and could potential contribute to increase diagnostic accuracy, prognosis and monitoring of therapeutic interventions. In contrast with CSF based diagnosis, the experimental methodology to obtain blood-based biomarkers can be easily repeated [21]. Though there are challenges to overcome in the use of blood-based biomarkers. Firstly, only small hydrophobic, lipophilic molecules are more easily transported from CSF into blood, through Blood-Brain Barrier (BBB), which implies that the most relevant markers will be in low abundance in plasma. Secondly, it is necessary to develop standard protocols regarding sample collection and storage, chemical analyses, data processing and information exchange. However, given that these markers are further away from the brain, they will need to be correlated with accepted markers of dementia. Finally, another challenge is the overlap of major brain pathologies; thus increasing the need for differential dementia diagnoses [15,22,23].
Some studies have already used FTIR with the purpose of discovering blood-based biomarkers that could aid in dementia diagnosis [14,24-26]. Promising results have been obtained but more work is needed to characterize patients’ profiles and validate this procedure for dementia diagnosis. The work here described applies FTIR to discriminate samples from control and cognitive impaired patients. Multivariate analysis was used to find the more significantly altered metabolites and to identify the eventual spectroscopic profile of the disease context. This preliminary work shows that FTIR, coupled with multivariate analysis, can discriminate control from disease patients, thus revealing disease associated profiles and supporting the use of metabolic techniques in dementia diagnosis.
MATERIALS AND METHODS
Study group
| Characteristics | Control | Putative AD | |
| Gender | Male | 5 | 4 |
| Female | 20 | 16 | |
| Age | Mean | 75 | 77 |
| MMSE | + | 0 | 20 |
| - | 25 | 0 | |
| CDR | + | 0 | 18 |
| - | 25 | 2 | |
Based on the cognitive evaluation, 20 putative AD cases were identified and a control group was age and sex matched. The distribution with respect to gender, CDR and MMSE scores is shown in table 1.
Sample preparation
Drying process
Three approaches were made: arithmetic subtraction of water spectrum from the plasma spectra; the use of pure water in the background single beam acquisition and the drying process.
The drying process was the chosen method for samples acquisition spectra because this process, although time consuming, requires less computational manipulations and was shown to be capable of eliminating the water spectral contribution, maintaining a reasonable Signal-to-Noise Ratio (SNR). Each sample was dried for 40 minutes, a time period that permits obtaining a spectrum with more spectroscopic information and enhanced SNR, whose peaks can be assigned, enabling a qualitative analysis of the sample.
Thus, by simply allowing water to evaporate from the sample, while spectra are being acquired, it is possible to observe alterations in spectroscopic signals over time, ensuring that the last spectrum obtained reached a constant drying stage. This information is not available by a single spectrum acquisition of the film at the end of the drying process.
FTIR spectral acquisition using the drying process
For spectral acquisition the background single beam was performed against air (with the empty crystal) and to spectra acquisition 8 μl of plasma of each sample was placed on the ATR crystal (diamond crystal). The liquid sample (plasma) was simply poured onto the crystal that should be fully covered. The spectra acquisition started after the software being programed to automatically acquire 16 consecutive spectra. At the end of the acquisition the sample was completely dry (approximately 40 minutes). The recording of the 16 spectra aims to follow up the drying process and to ensure that the drying process was complete. The 16th spectrum that corresponds to the fully dried sample was used for further multivariate analysis. Each sample was analyzed in triplicate.
To effectively clean ATR crystal avoiding the interference of the previously analyzed sample, the following sequence of solvents was used: acetone, 70% ethanol and water. Before applying a new sample onto the crystal, it was dried with absorbent paper. To ensure that the crystal was properly cleaned the acquisition of a spectrum with empty crystal was made and a new sample was analyzed when the obtained spectrum shows no spectroscopic signs.
Multivariate data analysis
For multivariate analysis, the three last spectra of one of each sample were selected and were transferred through JCAMP-DX format into the data analysis software, which had been developed at the Institut National Agronomique Paris-Grignon in collaboration with the University of Aveiro.
PCA was applied to the mid-infrared spectra of plasma samples in order to extract the main sources of variability. It was applied to specific spectral regions, at ranges of 3500-2700 cm-1 (related to the presence of lipids (e.g., especially saturated fatty acids and phospholipids); 1800-1400 cm-1 (mainly related to protein conformation mode and to chemical properties of nucleic acids bases, fatty acids and carbohydrates) and 1200–900 cm-1 (dominated by the symmetric stretching of PO2 groups in nucleic acids and polysaccharides and nucleic acids structural and functional information). Standard Normal Variate (SNV) was the pre-treatment applied to all spectral regions; the data set was auto-scaled, to equalize the spectra to the same scale (standardize) and decrease the differences among them (divided by the standard deviation).
RESULTS AND DISCUSSION
FTIR spectra upon water removal
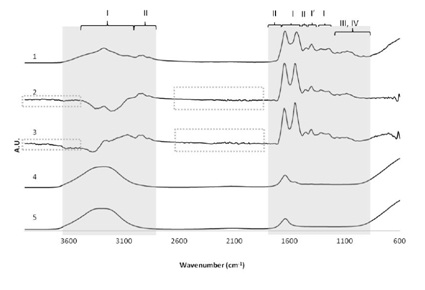 Figure 1: Comparison of the FTIR spectra upon water removal. Comparison of the effect of 3 different methods of minimizing water signals of plasma samples. 5) Water spectra; 4) Raw serum spectrum; 3) Spectrum resulting from the arithmetic subtraction of the water spectrum (5) to serum spectrum (4); 2) Spectrum obtained after the acquisition of background single beam with water; 1) Typical serum spectrum after drying process. Shaded regions contain spectral information of interest, and dashes indicate regions with noise. Regions mainly associated with the presence of proteins (I), amino acids (I’), lipids (II), carbohydrates (III) and DNA/RNA (IV); A.U - Arbitrary Units.
Additionally in figure 1, it is also possible to observe that water (spectrum 5) clearly dominates the overall spectra of the plasma sample (spectrum 4). This justifies the need to eliminate the water signal for further spectral interpretation.
For all methods tested, after water removal, bands that are absent in the spectrum 4 became visible. After water peaks’ elimination, it is possible to identify typical peaks of the major component groups (proteins (I), amino acids (I´), lipids (II), carbohydrates (III) and DNA/RNA (IV)) present in samples. Although it has been shown that spectra 1, 2 and 3 have almost equivalent information (similar spectroscopic signals), spectrum 1 was the unique spectrum that presents the most intense and well defined peaks.
Moreover, the quality of baseline found in the spectrum 1, is not observed in the spectra 2 and 3. In fact, these spectra are noisier than spectrum 1 as it can be observed in the regions of 4000-3400 cm-1 and 2300-1800 cm-1 (Figure 1, highlighted by dashed rectangle).
In the regions between 3500 cm-1 and 3000 cm-1 of spectra 2 and 3, negative peaks can be observed due to the excessive subtraction factor used, showing the subjectivity of these methods in the removal of the water contribution.
Apart from being less subjective, the drying method used to obtain spectra 1, even though it is time consuming, requires less computational manipulations and the obtained spectra present better Signal to Noise Ratio (SNR), than those obtained from the other methods described; that at the first glance would be more desirable because they are faster to acquire.
In summary, drying process is a methodology that allows eliminating the water contribution, maintaining a reasonable SNR and allows for the optimization of the experimental design; it is possible to observe changes in spectroscopic signals over time, ensuring that the last spectrum obtained reached a constant drying stage. This information cannot be obtained with other processes and, for this reason; this was the chosen method for the acquisition of the spectra in the present study.
Having said that, figure 2 shows the typical sequence of FTIR spectra of plasma sample as a function of drying time. The first spectra obtained as the plasma sample drop is placed in the crystal (spectrum 1), is dominated by the broad water absorption bands at 3400-3200 cm−1 and at 1700-1500 cm−1 due to O-H stretching and H-O-H bending, respectively and in agreement with previous reports [27].
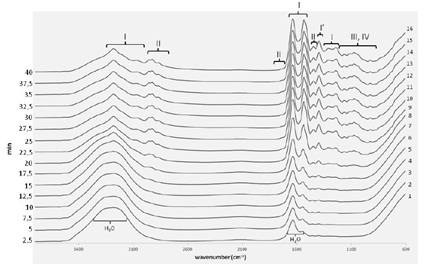 Figure 2: Typical FTIR spectra of dried plasma sample. FTIR spectra acquired during the drying process (film preparation) of a plasma sample. Spectroscopic regions mainly associated with the presence of proteins (I) amino acids (I’), lipids (II), carbohydrates (III) and DNA/RNA (IV).
Along the drying process, (Figure 2) it is possible to observe bands that gradually become much sharper as the water evaporates, mainly in the ranges of broad water signals, corresponding to spectroscopic regions directly overlapped with H2O vibrational modes. These spectral features correspond to vibrations of functional groups of specific solutes present in plasma/serum, mainly proteins (I), amino acids (I´) and lipids (II). There are other compounds (carbohydrates (III) and DNA/RNA (IV)) whose spectroscopic signals are not directly hidden with water signals but can be identified after the drying process [24,28]. This is due to the increase concentration of these solutes that naturally occurs when water evaporates.
Thus, for each sample, after 40 minutes of the drying process, it was possible to obtain a spectrum with more spectroscopic information and enhanced SNR whose peaks can be assigned; enabling a qualitative analysis of the sample. The dried spectra show apparent contributions of proteins in the frequencies range of 3400-3030 cm-1 [29], 1720-1480 cm-1 [24,28,29] and 1301-1229 cm-1 [30]; lipids in the range of 3020-2819 cm-1 [24,29], 1750-1725 cm-1 [16] and 1480-1430 cm-1 [24,28]; carbohydrates and nucleic acids (DNA/RNA) in the frequencies range of 1200-900 cm-1. In the latter region, vibrations of some functional groups of proteins and lipids are also detected [16,28].
The last three spectra (spectra 14, 15 and 16) were considered completely dry and do not compromise the reproducibility. The 16th spectrum will be used for further analysis.
Direct FTIR spectra analysis
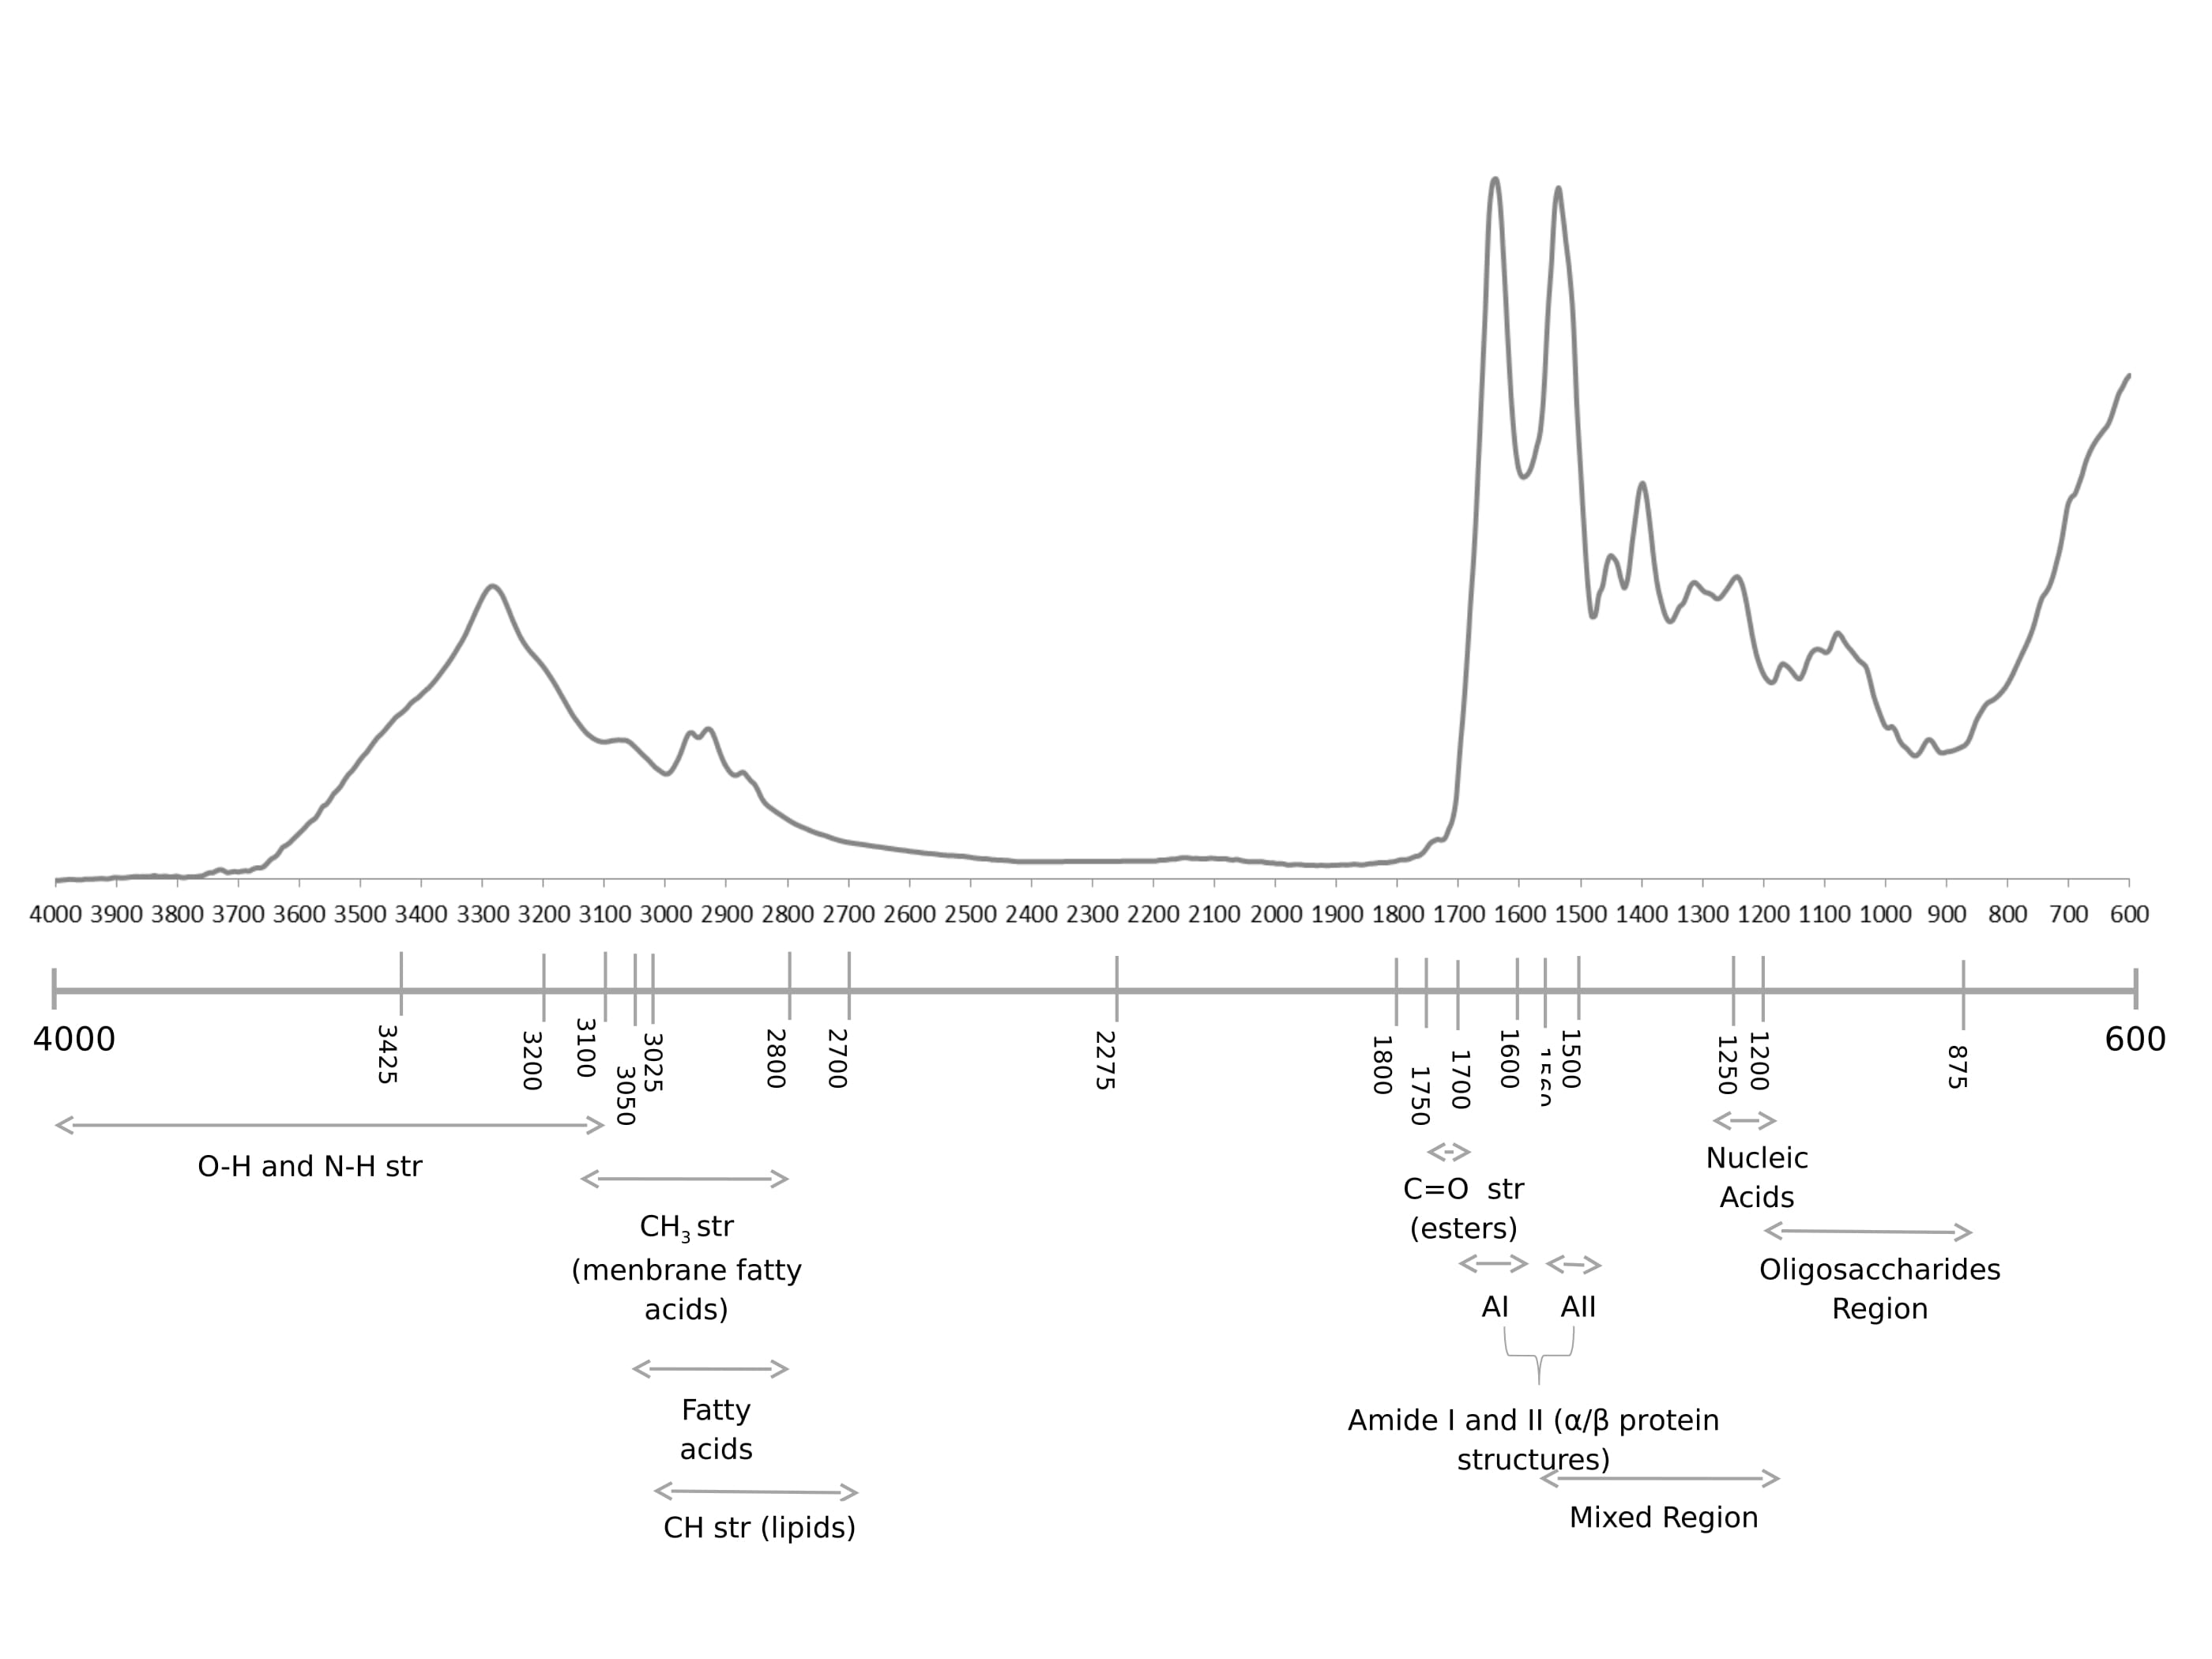
According to the literature review by Lopes et al. [11] the spectral band at 3718 cm-1 might be related to a higher level of plasma acidity, which is usually found at perturbations of acid/base blood balance mechanisms that in turn might be associated to the presence of general oxidative stress responses. In acidic conditions, such as brain ischemia and hypoxia, I2 PP2A (inhibitor-2 of protein phosphatase-2A) is cleaved into a C-terminal and an N-terminal fragments that are known to bind to PP2A (protein phosphatase-2A) catalytic subunit inhibiting its activity. PP2A decreased activity can be a cause of tau abnormal hyperphosphorylation in AD, thus it might be possible that brain acidosis is involved in AD pathogenesis [33]. Furthermore other proteins phosphatases,namely PP1 and PP2B, have been shown to be involved in dephosphorylating AD relevant proteins.
Peptide bond could exhibit nine characteristic IR-active amide bands (Figure 2 I-VII). Nonetheless, in the present study, only amide A, B and I-III were identified in the FTIR spectrum. The N-H stretching vibration gives rise to the amide A band between 3310 and 3270 cm-1, it is exclusively localized on the NH group and is therefore insensitive to the conformation of the polypeptide backbone. The amide A band is usually part of a Fermi resonance doublet with the second component absorbing weakly between 3100 and 3030 cm-1 (amide B). Amides I and II, are the major bands in the protein FTIR spectrum, with amide I providing the most insight into the secondary structure. Amides III and IV are very complex bands resulting from mixtures of several coordinate displacements. Out-of-plane motions could be found in amides V, VI and VII. Given the technical and theoretical limitations, only amide bands I, II and III are used for analysis of protein secondary structure [25,34].
It has been reported that in neurodegenerative disorders there is significant lipid damage in 23 brain tissues. In the FTIR spectrum here presented, lipids have characteristic C-H stretching 24 vibrations between 3025 and 2700 cm-1. For the -CH2 functional group, the asymmetric and 25 symmetric C-H stretching vibrations are found at ≈2920 and 2850 cm-1, respectively and for CH3 functional groups are found at ≈ 2957 and 2872 cm-1, respectively. In addition, unsaturated olefinic C=C-H stretching vibration has a unique vibrational frequency of 3012 cm-1 [26,35].
The presence of a carbonyl group in a compound can be identified by the strong IR band at the 1650-1850 cm-1 region, which corresponds to the C=O stretching vibration. In the present study, FTIR spectra analysis reveals some peaks in this region (1740, 1716 and 1638 cm-1), which might be related to lipid hyperoxidation, especially 1740 cm-1 band. Indeed, the 1638 cm-1 band corresponds to β-sheet of amide I, which was reported to be related to conformational changes of protein α-helices [36].
Tyrosine is a relative strong infrared absorber due to its polar character and the ring mode near 1517 cm-1 is one of its most intensive bands [37] also present in our spectra. In relation to nucleic acid biochemistry, in a FTIR spectra the most characteristic findings are the C=O stretching vibrations from the purine (1717 cm-1) and pyrimidine (1666 cm-1) bases, besides antisymmetric (1224 cm-1) and symmetric (1087 cm-1) PO2- stretching vibrations at the 1500-1000 cm-1 region [34], these were likewise observed in our spectra. In AD, changes in the tertiary structure at the 780-739 cm-1 spectral range can also be detected [38] (Figure 3).
Multivariate analysis of spectra data
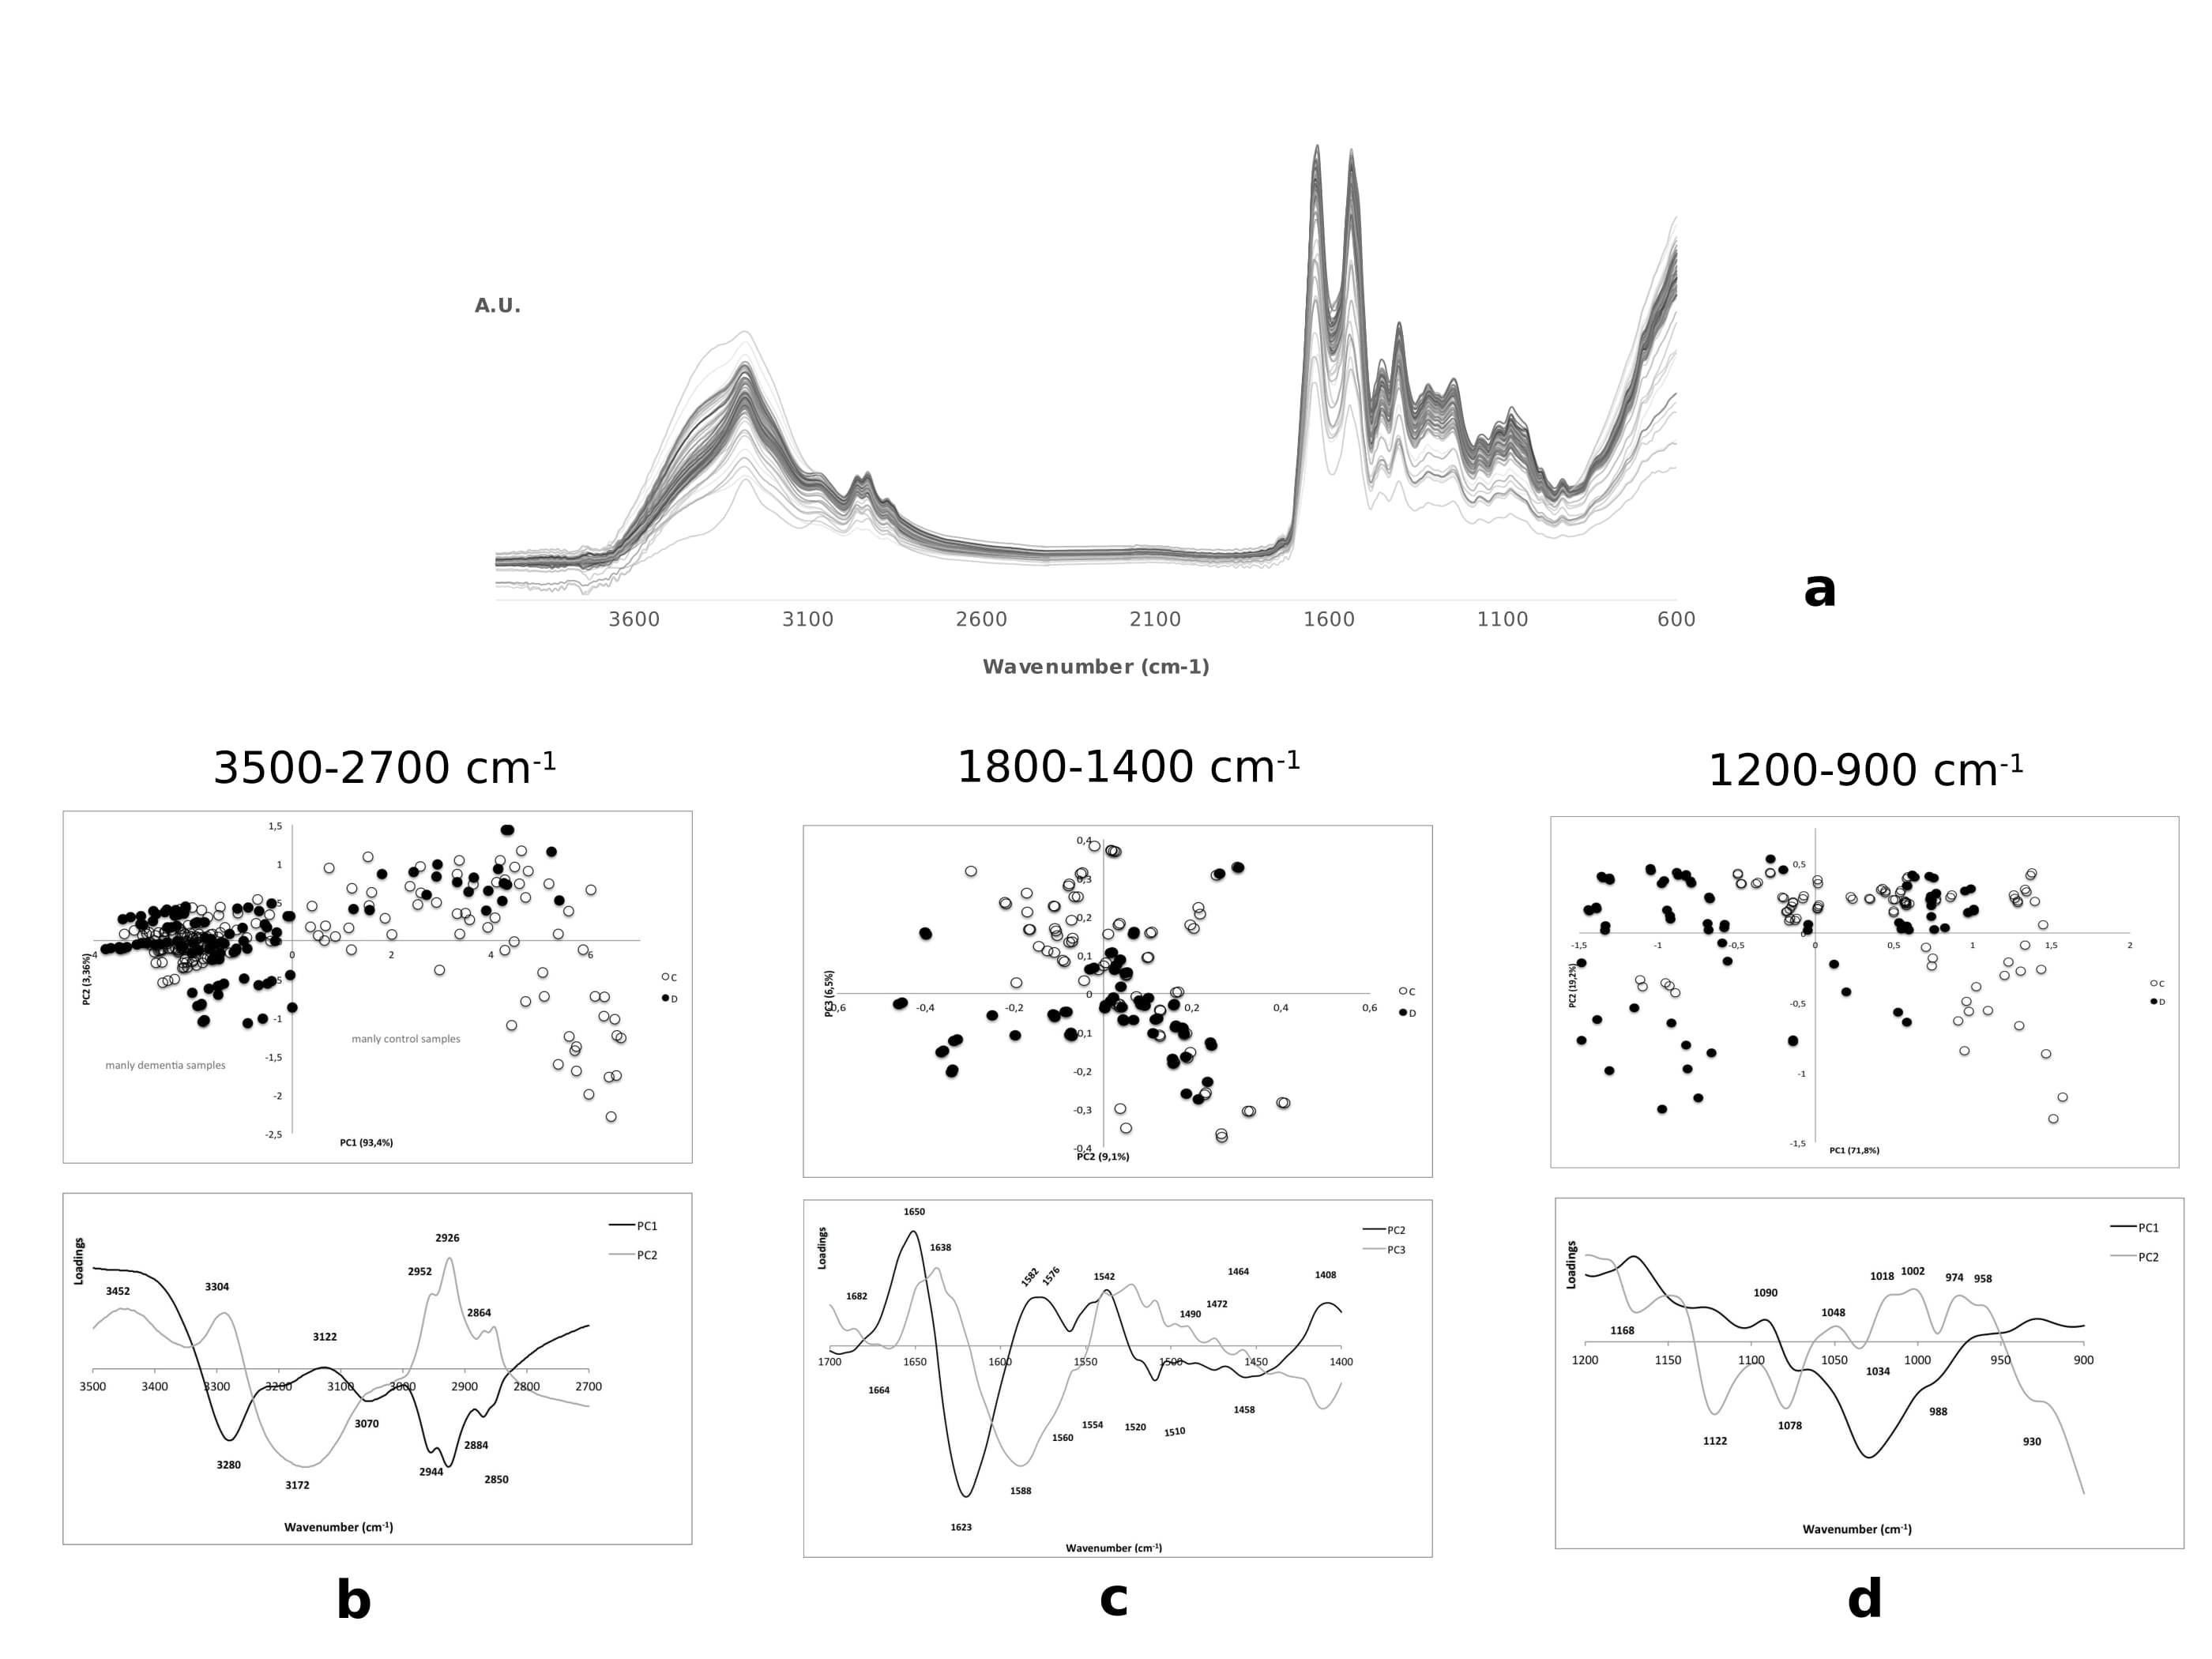
Spectral range of 3500-2700 cm-1
| Peak (cm-1) | PCs | Assignment |
| 3400 | PC1 (+) | N-H stretching of amide A |
| 3286 | PC1 (-)PC2 (+) | N-H stretching of amide A |
| 3172 | PC1 (-)PC2 (-) | O-H stretching band of carboxylic acids |
| 3070 | N-H stretching of amide B | |
| 3026 | N-H stretching of amide B | |
| 2952 | PC1 (-)PC2 (+) | C-H asymmetric stretching of -CH3 (fatty acids) |
| 2926 | C-H asymmetric stretching of -CH2 (fatty acids) | |
| 2884 | C-H asymmetric stretching of -CH2 (membrane lipids) | |
| 2864 | C-H symmetric stretching of -CH3 (membrane fatty acids) | |
| 2850 | C-H symmetric stretching of -CH2 (membrane fatty acids) |
As already mentioned the PC1 positive region is composed mainly of control samples, but some dispersed disease samples in this region can also be observed (Figure 4b). The region mainly constituted by control samples is characterized by the presence of assignment for amide A related to the peak 3400 cm-1 as described [34]. The fact that some controls are at negative PC1 indicates that these samples present similar biochemical pattern to the disease samples.
Spectral range of 1800-1400 cm-1
| Peak (cm-1) | PCs | Assignments |
| 1682 | PC3 (+) | C=O guanine deformation N-H in plane; unordered random coils, turns and loops (amide I) |
| 1664 | PC2 (+) | C=O band of α-helical structure (amide I)*, turns and loops |
| 1650 | PC2 (+) | C=O symmetric stretching band of α-helical structure (amide I) |
| 1638 | PC3 (+) | C=O stretching band of parallel β-sheet (amide I) |
| 1623 | PC3 (+) | C=O stretching band of parallel β-sheet (amide I) |
| 1588 | PC3 (-) | N-H bending in plane and C-N stretching (amide II); benzene ring vibrations from arginine |
| 1582 | PC3 (-) | C=N imidazole ring stretching (nucleic acids); benzene ring vibrations from arginine |
| 1576 | PC3 (-) | N-H bending in plane and C-N stretching (amide II); NH3+ symmetric bending (membrane lipids); C=N imidazole ring stretching (nucleic acids) |
| 1560 | PC2 (+) | N-H bending in plane and C-N stretching of amino acids (amide II); CO2- asymmetric stretching from glutamic acid |
| 1554 | PC2 (+) | N-H deformation mode of α-helical band (amide II)*; CO2- asymmetric stretching from glutamic acid |
| 1542 | PC2 (+) | N-H bending in plane and C-N stretching of amino acids (amide II) |
| 1520 | PC2 (-)PC3 (+) | N-H bending in plane and C-N stretching of amino acids (amide II) |
| 1510 | PC2 (-)PC3 (+) | N-H bending in plane and C-N stretching of amino acids (amide II); C-H in plane bending of phenyl rings (tyrosine) |
| 1490 | PC2 (-)PC3 (+) | N+(CH3)3 asymmetric bending (membrane lipids) |
| 1472 | PC2 (-)PC3 (+) | CH2 scissoring of proteins and CH3 scissoring of phospholipids (membrane lipids) |
| 1464 | PC3 (-) | CH2 scissoring and CH3 scissoring and asymmetric bending of phospholipids (membrane lipids) |
| 1458 | PC3 (-) | C=O symmetric stretching of COO- of amino acid side chains; CH2 bending of mainly fatty acids (membrane lipids) |
| 1408 | PC3 (-) | C=O symmetric stretching of COO- of amino acid side chains and fatty acids; N+(CH3)3 symmetric bending (membrane lipids) |
Two important contributing factors for degenerative disorders are oxidative stress and free radical damage. Therefore, it is not surprising to detect decreased intensity of the 1455 cm-1 peak (Table 3 and figure Fc). According to several authors, this results from deformation and stretching vibrations of CH2groups of acids present in cellular membrane [35,41].
The 1582 cm-1 band might be associated to alterations of the conformational state and structural stability of nucleic acid molecules. The same may also be stated for 1576 cm-1 that may represent structural changes in lipids. Altered protein conformation and aggregation typical of AD lead to different localization for amide II that can be seen in 1588 cm-1 peak in disease cases (Figure 4c and Table 3). 1464 cm-1 and 1408 cm-1 peaks are mainly due to structural changes of associated membrane lipids, namely fatty acids and phospholipids, as reported by other studies [27,34,39,42].
For all control samples the identified 1520 cm-1 and 1510 cm-1 peaks are related with unaltered protein conformation, without signals that could indicate protein aggregation or presence of intermediate damaging forms (like oligomers). These results are consensual with the biochemical pattern of a control sample [25,43].
The other peaks, 1472 cm-1 and 1490 cm-1 observed in patient cases are associated to structural properties of membrane lipids. The 1490 cm-1 peak is particularly connected to membrane injury probably due to the action of oxidative stress and free radicals inductors of cell damage. The peaks 1682 cm-1, 1638 cm-1 and 1623 cm-1 observed in control samples are associated to protein conformation differences between control and patients (Figure 4c). Indeed, 1623 cm-1 peak has been considered as characteristic of a protein in an aggregated state, during FTIR analysis of cerebral tissue from putative AD patients [25,35,44].
Contrarily to fibrils, oligomers present peaks at 1630 and 1695 cm-1, which correspond to an anti-parallel β-sheet conformation (Figure 4C). In the present study there are two peaks near to 1630 cm-1 (i.e. 1623 cm-1 and 1638 cm-1), which are related to highly stable parallel β-sheet, usually associated to the presence of fibrils. A higher proportion of Aβ fibril forms correlate to the later stages of the disease, and Aβ soluble oligomers are an intermediate form that precedes Aβ fibrils. In addition, the absence of the 1695 cm-1 peak suggested that Aβ fibrils are present in higher content than Aβ 13 oligomers [45].
Most of the proteins present a mixture of secondary structures, and thus, the amide I band represents a combination of these components. Amorphous aggregates may also present aspectral band at 1623 cm-1and do not associate to a higher content of β-sheet structure, contrarily to protein fibrils. The presence of a band at 1623 cm-1 (Figure 4c) might indicate that, besides protein fibrils, there are also some amorphous aggregates. This may arise from a relatively unfolded-like partially folded and a native like conformation, respectively [25,35,44].
Components of C=O band with α and β forms are related to spectral peaks at 1658 cm-1 and 1629 cm-1, respectively, thus the 1664 and 1623 cm-1 peaks found in the present study are related to α and β forms. In addition, the identified peaks at 1554 and 1542 cm-1 are related to N-H deformation mode [25].
On the other hand, control samples are associated to signal peaks identified at 1664 cm-1 and 1650 cm-1that are related to the typical localization of amide I of proteins mainly constituted by α-helix structures. This is corroborated by protein structural information given by 1560 cm-1, 1554 cm-1, 1542 cm-1 and 1538 cm-1 peaks. Nevertheless, given the proximity of these samples to the disease states, from both Q1 (protein aggregates) and Q4 (lipid and nucleic acids altered biochemistry), it is possible that control samples share some biochemical characteristics with the disease samples; namely that all samples are older and exhibit age related patterns.
Spectral range of 1200-900 cm-1
The PCA scores in the figure 4d showed that it is possible to identify some disease samples localized at positive PC1 and some at negative PC1. Consequently, as described in table 4, the analysis of main maximum peaks in PCA loadings does not allow to clearly identifying the spectroscopic and consequent biochemical pattern of disease samples groups.
| Peak (cm-1) | PCs | Assignment |
| 1168 | PC1 (+) | C-O stretching of ribose from nucleic acids; CO-O-C asymmetric stretching (membrane lipids) |
| 1122 | PO stretching of phosphodiester backbone and C-O stretching of deoxyribose and ribose (nucleic acids) | |
| 1090 | PO2- symmetric stretching of sugar rings (nucleic acids) and membrane lipids | |
| 1078 | PC1 (-) | CO-O-C symmetric stretching (membrane lipids) |
| 1062 | Ester C-O-C symmetric stretching (phospholipids); ribose C-O stretching (nucleic acids) | |
| 1048 | C-O stretching of sugar rings (nucleic acids) | |
| 1034 | C-N symmetric stretching of amino acid (aliphatic amines); ribose C-O stretching (RNA) | |
| 1018 | C-O stretching in osidic and protein structures; symmetric stretching of dianionic phosphate monoester (nucleic acids, especially DNA) | |
| 1002 | C-O stretching in osidic and protein structures; uracil ring bending (RNA); symmetric stretching of dianionic phosphate monoester (nucleic acids, especially DNA) | |
| 988 | C-O stretching in osidic and protein structures; symmetric stretching of dianionic phosphate monoester (nucleic acids, especially DNA) | |
| 974 | C-O stretching in osidic and protein structures; N+(CH3)3 asymmetric stretching (membrane lipids); symmetric stretching of dianionic phosphate monoester (nucleic acids, especially DNA) | |
| 958 | PC1 (+) | C-O stretching in osidic and protein structures; symmetric stretching of dianionic phosphate monoester (nucleic acids, especially DNA) |
| 930 | C-O-H out of plane bending of carboxylic acids; C-O stretching in osidic and protein structures; symmetric stretching of dianionic phosphate monoester (nucleic acids, especially DNA) |
Table 4: Assignments of the main maximum peaks from PCA loadings, at the spectral range of 1200-900 cm-1.
In this study it is possible to relate the presence of hydroxyl compounds, products of lipid peroxidation that have already been reported as markers of oxidative damage in AD, with the C-O stretching bands found in the 1150-1000 cm-1 spectral region (Figure 4c and Table 4). In the 1200-1100 cm-1 range it is possible to detect saturated lipids (aliphatic esters), which can lead to a higher content of saturation and consequently to a higher risk of membrane damage and vascular events. Disease subjects can have hyperoxidation of lipids, phospholipids and membranes; that can occur during the dementia atherogenesis process [27,36,46].
With the spectral peaks at 1122 cm-1, 1090 cm-1, 1048 cm-1, and 1020-930 cm-1 region, it is possible to observe that nucleic acids, especially DNA, represent a major target for free radicals when the capacity of intracellular free radical scavengers and antioxidants is overcome. It is expected that the accumulation of DNA damages can contribute to progressive neuronal cell loss, since non-repaired DNA can lead to programmed cell death [41].
CONCLUSIONS
Direct analysis of spectra, allows for the recognition of the main chemical FTIR assignments in plasma, which will help in creating a pattern of chemical vibrations and identify the principal spectral regions with relevant information. Despite this huge advantage, it is still necessary to use multivariate data analysis techniques, such as PCA, to draw out the significant and no redundant spectra information, since biological samples are very complex and direct analysis of spectra proved to be insufficient to discriminate between the spectra of control and dementia samples.
Our data revealed that IR spectral regions are relevant for extracting important information at 3500-2700 cm-1, 1800-1400 cm-1 and 1200-900 cm-1. For the first region, the main finding is that there is an unbalance content of saturated and unsaturated lipids, favoring the first one that can lead to a high potential brain damage. It could also be observed that the presence of carboxylic acids are usually related to lipid peroxidation, production of reactive carbonyls, and protein structural and functional disturbances. In relation to the second region, related to protein conformation, data suggests the presence of protein aggregates and the change in protein conformation for highly stable parallel β-sheet, which agrees with the presence of Aβ fibrils. The 1200-900 cm-1 region showed the presence of lipid peroxidation products related to impairment of membranes, and oxidative damage of nucleic acids.
There are some relevant clinical factors that could influence the results of this preliminary work, in particular the presence of several comorbidities, unknown and/or undiagnosed genetic predisposition factors, use of medication capable of affecting biochemical plasma levels, or the presence of a neurodegenerative disorder of mixed nature.
With this study it was possible to establish a method to identify the main metabolic changes that occur during neurodegeneration, by monitoring plasma biochemical alterations through FTIR analysis. Further it was also possible to reveal some common changes in dementia patients, suggesting that FTIR analysis can be used to build classification models that in the future may aid in the diagnosis of cognitive impairment or in the identification of disease or risk development. Additionally clinical trials with enlarged data sets and samples fully characterized would be necessary to validate the use of FTIR in dementia diagnosis and prognosis. This study is a valuable contribution to the area and authors expect that in the future, it will be possible by the use of a single drop of plasma, FTIR and multivariate classification models to diagnose dementia patients, complementing the usual cognitive tests.
ACKNOWLEDGEMENT
First and foremost we would like to thank the volunteers and their families as well as all the health professionals in the Aveiro district that made this study possible, by contributing with the biological material.
This work was financed by UID/BIM/04501/2014, iBiMED, University of Aveiro and the Fundação para a Ciência e Tecnologia of the Ministério da Educação e Ciência; and supported by the project JPND/0006/2011-BIOMARKAPD.
REFERENCES
- Longo DL, Fauci AS, Kasper DL, Hauser SL, Jameson JL, et al. (2011) Harrison’s Principles of Internal Medicine, (18th edn), McGraw-Hill Professional, New York, USA.
- Porth CM (2005) Pathophysiology: Concepts of Altered Health States. Lippincott Williams & Wilkins, Philadelphia, Pennsylvania, USA.
- Alzheimer’s Disease International (2015) World Alzheimer Report 2015. The Global Impact of Dementia. An analysis of prevalence, incidence, cost and trends. Alzheimer’s Disease International (ADI), London, UK.
- Alzheimer’s Association (2012) 2012 Alzheimer’s disease facts and figures. Alzheimers Dement 8: 131-168.
- Pasqualetti G, Brooks DJ, Edison P (2015) The role of neuroinflammation in dementias. Curr Neurol Neurosci Rep 15: 17.
- Limor R, Janice K, Kiran B (2015) Summary for Policymakers. In: Stocker TF, Qin D, Plattner GK, Tignor M, Allen SK, et al. (eds.). Climate Change 2013: The Physical Science Basis. Contribution of Working Group I to the Fifth Assessment Report of the Intergovernmental Panel on Climate Change. Cambridge University Press, Cambridge, UK and New York, USA. Pg no: 1-30.
- Dubois B, Padovani A, Scheltens P, Rossi A, Dell'Agnello G (2015) Timely Diagnosis for Alzheimer’s Disease: A Literature Review on Benefits and Challenges. J Alzheimers Dis 49: 617-631.
- Xu XH, Huang Y, Wang G, Chen SD (2012) Metabolomics: a novel approach to identify potential diagnostic biomarkers and pathogenesis in Alzheimer’s disease. Neurosci Bull 28: 641-648.
- Eisenmenger LB, Huo EJ, Hoffman JM, Minoshima S, Matesan MC, et al. (2016) Advances in PET Imaging of Degenerative, Cerebrovascular, and Traumatic Causes of Dementia. Semin Nucl Med 46: 57-87.
- Olsson B, Lautner R, Andreasson U, Öhrfelt A, Portelius E, et al. (2016) CSF and blood biomarkers for the diagnosis of Alzheimer’s disease: a systematic review and meta-analysis. Lancet Neurol 15: 673-684.
- Lopes J, Correia M, Martins I, Henriques AG, Delgadillo I, et al. (2016) FTIR and Raman Spectroscopy Applied to Dementia Diagnosis Through Analysis of Biological Fluids. J Alzheimer’s Dis 52: 801-812.
- El-Ansary A, Al-Afaleg N, Al-Yafaee Y (2009) Biomarker discovery in neurological diseases: a metabolomic approach. Open Access J Clin Trials 1: 27-41.
- Ellis DI, Dunn WB, Griffin JL, Allwood JW, Goodacre R (2007) Metabolic fingerprinting as a diagnostic tool. Pharmacogenomics 8: 1243-1266.
- Krafft C, Sergo V (2006) Biomedical applications of Raman and infrared spectroscopy to diagnose tissues. Spectroscopy 20: 195-218.
- Bazenet C, Lovestone S (2012) Plasma biomarkers for Alzheimer’s disease: much needed but tough to find. Biomark Med 6: 441-454.
- Movasaghi Z, Rehman S, Ihtesham ur Rehman (2008) Fourier Transform Infrared (FTIR) Spectroscopy of Biological Tissues. Appl Spectrosc Rev 43: 134-179.
- Mitchell AL, Gajjar KB, Theophilou G, Martin FL, Martin-Hirsch PL (2014) Vibrational spectroscopy of biofluids for disease screening or diagnosis: translation from the laboratory to a clinical setting. J Biophotonics 7: 153-165.
- Thermo Nicolet Corporation (2001) Introduction to Fourier Transform Infrared Spectrometry. Thermo Nicolet Corporation, Madison, USA.
- Petibois C, Cazorla G, Cassaigne A, Déléris G (2001) Plasma protein contents determined by Fourier-transform infrared spectrometry. Clin Chem 47: 730-738.
- Ma Y, Zhang P, Yang Y, Wang F, Qin H (2012) Metabolomics in the fields of oncology: a review of recent research. Mol Biol Rep 39: 7505-7511.
- Circulating biomarkers of protein oxidation for Alzheimer disease: expectations within limits. Biochim Biophys Acta 1814: 1785-1795.
- Dong S, Duan Y, Hu Y, Zhao Z (2012) Advances in the pathogenesis of Alzheimer’s disease: a re-evaluation of amyloid cascade hypothesis. Transl Neurodegener 1: 18.
- Alves L, Correia AS, Miguel R, Alegria P, Bugalho P (2012) Alzheimer’s disease: a clinical practice-oriented review. Front Neurol 3: 63.
- Kanagathara N, Thirunavukkarasu M, Jeyanthi CE, Shenbagarajan P (2011) FTIR and uv-visible spectral study on normal blood samples. Int J Pharm Biol Sci 1: 74-81.
- Kumar S, Chaudhary S, Sweety, Jain DC (2014) Vibrational Studies of Different Human Body Disorders Using FTIR Spectroscopy. Open J Appl Sci 4: 103-129.
- Leskovjan AC, Kretlow A, Miller LM (2010) Fourier transform infrared imaging showing reduced unsaturated lipid content in the hippocampus of a mouse model of Alzheimer’s disease. Anal Chem 82: 2711-2716.
- Stuart BH (2004) Infrared Spectroscopy: Fundamentals and Applications. John Wiley & Sons Ltd, Chichester, UK.
- Déléris G, Petibois C (2003) Applications of FT-IR spectrometry to plasma contents analysis and monitoring. Vib Spectrosc 32: 129-136.
- Barth A, Zscherp C (2002) What vibrations tell us about proteins. Q Rev Biophys 35: 369-430.
- Kong J, Yu S (2007) Fourier transform infrared spectroscopic analysis of protein secondary structures. Acta Biochim Biophys Sin (Shanghai) 39: 549-559.
- Ellis DI, Harrigan GG, Goodacre R (2003) Metabolic Profiling: Its Role in Biomarker Discovery and Gene Function Analysis. Springer, Boston, Massachusetts, USA.
- Naumann D (2001) FT-infrared and ft-raman spectroscopy in biomedical research. Appl Spectrosc Rev 36: 239-298.
- Basurto-Islas G, Iqbal K (2013) A molecular mechanism by which acidosis of the brain can lead to Alzheimer’s disease. Alzheimer’s Dement 9: 307.
- Garidel P, Schott H (2006) Fourier-Transform Midinfrared Spectroscopy for Analysis and Screening of Liquid Protein Formulations Part 2: Details Analysis and Applications. Bioprocess Int 1: 48-55.
- Severcan F, Harris PI (2012) Vibrational Spectroscopy in Diagnosis and Screening. IOS Press IOS Press, Amsterdam, Netherlands.
- Dritsa V (2012) FT-IR Spectroscopy in Medicine. Infrared Spectroscopy - Life and Biomedical Sciences, InTech, Rijeka, Croatia. Pg no: 271-288.
- Barth A (2000) The infrared absorption of amino acid side chains. Prog Biophys Mol Biol 74: 141-173.
- Carmona P, Molina M, Calero M, Bermejo-Pareja F, Martínez-Martín P, et al. (2013) Discrimination analysis of blood plasma associated with Alzheimer’s disease using vibrational spectroscopy. J Alzheimers Dis 34: 911-920.
- Tamm LK, Tatulian SA (1997) Infrared spectroscopy of proteins and peptides in lipid bilayers. Q Rev Biophys 30: 365-429.
- Calkins MJ, Johnson DA, Townsend JA, Vargas MR, Dowell JA, et al. (2009) The Nrf2/ARE pathway as a potential therapeutic target in neurodegenerative disease. Antioxid Redox Signal 11: 497-508.
- Peuchant E, Richard-Harston S, Bourdel-Marchasson I, Dartigues JF, Letenneur L, et al. (2008) Infrared spectroscopy: a reagent-free method to distinguish Alzheimer’s disease patients from normal-aging subjects. Transl Res 152: 103-112.
- Barth A, Harris PI (2009) Biological and Biomedical Infrared Spectroscopy. IOS Press, Amsterdam, Netherlands.
- Jabs A (2005) Determination of Secondary Structure in Proteins by Fourier Transform Infrared Spectroscopy (FTIR), Jena Library of Biologica Macromolecules.
- Shivu B, Seshadri S, Li J, Oberg KA, Uversky VN, et al. (2013) Distinct β-sheet structure in protein aggregates determined by ATR-FTIR spectroscopy. Biochemistry 52: 5176-5183.
- Cerf E, Sarroukh R, Tamamizu-Kato S, Breydo L, Derclaye S, et al. (2009) Antiparallel beta-sheet: a signature structure of the oligomeric amyloid beta-peptide. Biochem J 421: 415-423.
- Rincon F, Wright CB (2013) Vascular cognitive impairment. Curr Opin Neurol 26: 29-36.
Citation: Correia M, Lopes J, Silva R, MartinsRosa I, Henriques AG et al. (2016) FTIR Spectroscopy - A Potential Tool to Identify Metabolic Changes in Dementia Patients. J Alzheimers Neurodegener Dis 2: 007.
Copyright: © 2016 Marta Correia, et al. This is an open-access article distributed under the terms of the Creative Commons Attribution License, which permits unrestricted use, distribution, and reproduction in any medium, provided the original author and source are credited.