Journal of Anesthesia & Clinical Care Category: Clinical
Type: Research Article
Learning Curve of the Infant GlideScope® Cobalt Video Laryngoscope in Anesthesiology Residents
*Corresponding Author(s):
Cengiz KarsliDepartment Of Anesthesia And Pain Medicine, The Hospital For Sick Children, University Of Toronto, Toronto M5G 1X8, Canada
Tel:+1 4168137341,
Email:cengiz.karsli@sickkids.ca
Received Date: Feb 09, 2015
Accepted Date: Mar 31, 2015
Published Date: Apr 14, 2015
Abstract
Background: The ease of use and success rate associated with GlideScope® intubation of infant tracheas by anesthesiology residents in their first pediatric rotation is unknown.
Objective: The purpose of this study was to evaluate the learning curve associated with infant GlideScope® Cobalt Video Laryngoscope intubation by anesthesiology residents compared to direct laryngoscopy.
Methods: Sixteen anesthesiology residents who had no prior experience with infant airway management performed a total of 10 tracheal intubations each (5 GlideScope® and 5 direct laryngoscope, randomized) in infants weighing 10 kg or less. Primary end points included time to optimum view of the vocal cords and time to tracheal intubation. Multivariate ANOVA and pair-wise comparisons were used to analyze the data.
Results: There were no significant differences in time to optimum view of the cords or time to intubate between the 1st and 5th intubations for either device. Intubating conditions were similar for both devices.
Conclusion: The learning curve associated with infant GlideScope® laryngoscopy and intubation by resident’s novice to infant airway management seems to be flat and identical to that with direct laryngoscopy.
Keywords
GlideScope; Infant; Intubation; Learning curve
BACKGROUND
The GlideScope® Cobalt Video Laryngoscope (GCV, Verathon Medical, Bothell, USA) may improve visualization of the glottis in infants and small children [1]. It can be used to facilitate elective, emergent or difficult tracheal intubation in infants, and may be a valuable teaching tool due to the clarity of the image produced. Opportunities for trainees to use the Infant Cobalt GlideScope® tend to be sporadic. A university-affiliated tertiary care pediatric hospital allows anesthesiology trainees to gain concentrated experience with infant airway management; it also provides an opportunity to evaluate the learning experience in those novice practitioners. At our pediatric center, anesthesiology trainees in their 4th postgraduate year undergo a 6-month rotation in pediatric anesthesiology. It is their first exposure to infant and pediatric airway management. A recent study in adults revealed the learning curve for anesthesiology residents using the Airtraq® was faster than that for the Macintosh laryngoscope [2]. Other studies have evaluated the use of the Cobalt GlideScope® in manikins [3,4]. The purpose of this study is to evaluate the learning curve associated with the use of the Infant GCV by novice users, as compared to direct laryngoscopy for intubation of infants weighing 10 kg or less. We hypothesize there is no difference between the learning curve for the use of the GCV and DL by residents novice to infant airway management.
METHODS
This study received approval by the hospital Research Ethics Board. Written informed parental consent was obtained for each patient. One hundred and sixty infants weighing 10 kg or less requiring general anesthesia and tracheal intubation were enrolled. Patient exclusion criteria included infants with a known or suspected difficult airway or requiring rapid sequence induction. With informed written consent sixteen 4th year anesthesiology residents who had no prior experience with infant tracheal intubation were enrolled in the study as the novice users. Each study resident was polled as to his/her level of experience and satisfaction using the GCV in adult patients. Randomization of method of tracheal intubation for each study case was achieved using the equivalent of a sealed envelope technique. In each patient, inhalation induction with sevoflurane in oxygen/nitrous oxide mixture and application of standard monitors was followed by insertion of an intravenous cannula. Further anesthetic induction medication administration was left to the discretion of the attending anesthetist. Rocuronium 1 mgkg-1 was administered followed by bag-mask ventilation with 100% oxygen for 90 seconds. Laryngoscopy was then performed by the anesthesiology resident using either the Infant Cobalt GlideScope® or Wisconsin #1 blade direct laryngoscope, according to the randomization sequence. Each study resident performed a total of 10 tracheal intubations (5 with the GCV and 5 with the direct laryngoscope using a Wisconsin #1 blade). One of two experienced pediatric anesthetists (CK or MF) supervised each laryngoscopy and recorded the study data. Primary end points included Time to Optimum View (TOV) of the glottic structures and Time to Tracheal Intubation (TTI). The time to optimum view was recorded from the time the blade was inserted in the mouth to the best view of the vocal cords, as determined by the laryngoscopist. The time to tracheal intubation was recorded from the time the blade was inserted in the mouth to first detection of end-tidal CO2. Correct placement of the tracheal tube was confirmed by auscultation. The Adnet intubation difficulty score was also recorded on each occasion [5]. This is a clinical scale evaluating the number of intubation events, number of operators, alternative techniques used, Cormack-Lehane grade of view, lifting force required and vocal cord mobility seen on laryngoscopy. A score of 0 indicates easy intubation, a score of 1 to 5 indicates slight difficulty and a score greater than 5 indicates moderate to severe difficulty with intubation.
STATISTICAL ANALYSIS
Data were expressed as mean (± SD) unless otherwise stated. Demographic data were compared using unpaired t-test. Two-way Multivariate ANOVA (MANOVA) was used to test the null hypothesis that there is no difference between the learning curves of either device when used by novice residents. MANOVA was applied to verify the statistical significance among the five intubations performed by residents for each of the two devices (GCV and DL) where TOV and TTI were measured as dependent (outcome) variables. MANOVA was also used to test the hypothesis of interaction between the learning curves of both groups. The use of MANOVA was followed by one way ANOVA and pair-wise comparisons using Newman-Keul’s post hoc test to detect any difference in TOV or TTI at different intubation numbers within GCV and DL groups and between similar intubation numbers amongst both groups. A p value of < 0.05 was considered statistically significant. In cases of pair-wise multiple comparisons, the p-values included the family-wise error rate (α) where α = 1- (1-α per comparison)n [α per comparison = 0.05; n = number of comparisons]. To ensure that MANOVA could be used to analyze the data, Bartlett’s test was used to test for the homogeneity of variance. The homogeneity of variance was assessed among data pooled for all intubations (1st to 5th) for both devices in two sets, i.e., TOV and TTI. Similarly, homogeneity of variance was assessed for all intubations for each device separately for TOV and TTI respectively. Dixon’s Q test was used to exclude any outliers [6]. The normal distribution of data sets were assessed by the Shapiro-Wilk test and the smallest p-value was 0.352. Therefore, the data analyzed in this study did not show significant deviations from normality.
The sample size for this study was calculated assuming the expected ‘time to intubate’ using direct laryngoscopy is 20 ± 8 s and the expected mean difference between direct and GlideScope® laryngoscopy is 6 s [1] Thus the effect size is the mean difference divided by the standard deviation of mean difference, or 1.4. G*Power 3.1.5 software (Department of Psychology, Dusseldorf, Germany) determined the sample size of residents based on one sample two-tailed paired t-test. The calculated sample size was 8 residents [7]. We increased the number of residents from eight to sixteen in order to decrease the chance of a type I error.
The sample size for this study was calculated assuming the expected ‘time to intubate’ using direct laryngoscopy is 20 ± 8 s and the expected mean difference between direct and GlideScope® laryngoscopy is 6 s [1] Thus the effect size is the mean difference divided by the standard deviation of mean difference, or 1.4. G*Power 3.1.5 software (Department of Psychology, Dusseldorf, Germany) determined the sample size of residents based on one sample two-tailed paired t-test. The calculated sample size was 8 residents [7]. We increased the number of residents from eight to sixteen in order to decrease the chance of a type I error.
RESULTS
A total of 161 infants were initially recruited in the study; one patient was excluded when it was discovered after obtaining study consent that the patient had a mild form of Pierre Robin syndrome. Table 1 outlines the demographic characteristics of the study patients as well as average times to optimum view and tracheal intubation with both devices. All study residents reported a favorable experience with the use of GCV during the study. The Adnet score on each occasion was zero or one, indicating there were no cases of difficult tracheal intubation. The average time to optimum view of the cords in the GCV group for the 1st intubation was 6.3 ± 3.3s, compared to 8.1 ± 3.6s for the 5th intubation. In the DL group the average TOV for the 1st intubation was 16.7 ± 23.6s compared to 9.1 ± 6.6s for the 5th intubation (Figure 1). The TTI in the GCV group for the 1st and 5th intubations were 25.3 ± 9.6s and 22 ± 4.5s, respectively while in the DL group they were 31 ± 21s and 25.4 ± 10.9s (Figure 2).
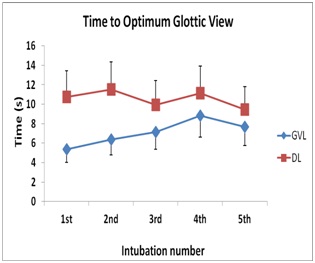 Figure 1: Time to optimum glottic view in seconds with intubation number using the Direct Laryngoscope (DL) or Infant GlideScope® Cobalt Video laryngoscope (GCV).
Figure 2: Time to tracheal intubation in seconds with intubation number using the Direct Laryngoscope (DL) or infant GlideScope® Cobalt Video laryngoscope (GCV).
| Glidescope Video Laryngoscopy | Direct Laryngoscopy | p-value | |
| Female/Male | 32/48 | 28/52 | 0.258 |
| Age (months) | 6.38 ± 3.14 | 6.20 ± 3.77 | 0.735 |
| Weight (kg) | 7.26 ± 1.98 | 6.61 ± 2.01 | 0.131 |
| Laryngeal view (1/2/3/4) | 78/0/0/2 | 76/4/0/0 | 0.407 |
| IDS (0/1/2) | 77/3/0 | 77/3/0 | 0.653 |
| Time to visualization (s) | 7.08 ± 4.34 | 11.38 ± 10.28 | 0.072 |
| Time to intubate (s) | 21.7 ± 9.61 | 24.36 ± 11.67 | 0.229 |
Table 1: Demographics of patients involved in the study.
IDS: Adnet Intubation Difficulty Scale; NS: denotes Not Significant
Two-way MANOVA was conducted to determine the effect of the successive intubations performed by residents when using the devices (GCV and DL) on the two dependent variables TOV and TTI. Bartlett’s test verified the hypothesis of equality of variances for the TOV and ITT data (p=0.12 and 0.156 respectively). Also, Bartlett’s confirmed the homogeneity of the variances among the time points in each group separately. Dixon’s Q test did not identify any outliers and all the values within every set of data had a Q value less than the limit value for the test at 95% confidence. Significant differences in times to optimum view or intubation were not found among the successive intubations performed by residents when using the GCV and DL devices on TOV and TTI, Wilks’ lambda = 0.88, F(18,178) = 0.67, p = 0.83. Figures 1 and 2, show the mean and standard deviations of the dependent variables for the intubations performed by residents for the two devices (GCV and DL). Additionally, MANOVA did not detect any difference between the mean TOV and TTI among the GCV or DL devices. The interaction between the intubation number (from 1 to 5) and the repeated use of the devices (GCV and DL) was not statistically significant, Wilks’ lambda = 0.95, F (8,178) = 0.57, p = 0.8. Subsequent one-way repeated measures ANOVA and pairwise comparisons did not show statistical significance within the GCV or DL durations, namely the TOV and TTI. There was also no statistically significant difference within the mean TOV and TTI at each intubation number when infants were intubated with the GCV or DL (Table 2).
| Cobalt GlideScope® | Direct Laryngoscope | Difference between means | CI 95% of difference (s)* | P value** | |
| Time to visualization (s) | |||||
| 1st Intubation | 6.30 | 16.70 | -10.40 | -28.43 to 7.63 | 0.338 |
| 2nd Intubation | 6.00 | 10.90 | -4.90 | -11.78 to 1.98 | 0.297 |
| 3rd Intubation | 7.80 | 10.40 | -2.60 | -8.00 to 2.80 | 0.378 |
| 4th Intubation | 8.90 | 11.50 | -2.60 | -6.64 to 1.44 | 0.316 |
| 5th Intubation | 8.10 | 9.10 | -1.00 | -7.08 to 5.08 | 0.585 |
| Time to intubate (s) | |||||
| 1st Intubation | 25.30 | 31.00 | -5.70 | -24.76 to 13.36 | 0.484 |
| 2nd Intubation | 23.80 | 25.20 | -1.40 | -11.85 to 9.05 | 0.610 |
| 3rd Intubation | 25.3 | 26.2 | -0.90 | -8.94 to 7.14 | 0.629 |
| 4th Intubation | 26.00 | 28.40 | -2.40 | -13.54 to 8.74 | 0.544 |
| 5th Intubation | 22.00 | 25.40 | -3.40 | -10.01 to 3.21 | 0.363 |
Table 2: Times to visualize the vocal cords and to intubate the trachea using the Cobalt GlideScope® Video laryngoscope and direct laryngoscope with successive intubations.
* The confidence interval for the difference between two means is defined by:
(M1 – M2) ± tCL × SEM1 – M2; where M1 – M2 is the difference between sample means, tCL is the t value for the desired level of confidence, i.e., 1-α=1-0.05=0.95 and the desired degrees of freedom (df), i.e., df = n – 1 for equal sample sizes for the paired t-test, and SEM1-M2 is the estimated standard error of the difference between sample means.
**P value <0.05 is considered statistically significant.
DISCUSSION
With the introduction of new fiber optic intubating devices options for challenging airways or education in advanced airway management have expanded considerably. Typically however most of these devices tend to be scaled-down versions of the adult device [8]. To our knowledge, this is the first study to look at the learning curve associated with the use of the GlideScope® Cobalt Video laryngoscope in infants by anesthesiology residents, as compared with direct laryngoscopy.
The main findings in this study include the following; 1) There is no significant difference in the time taken by residents with each intubation when using the GCV versus direct laryngoscopy. There was no difference between the learning curves for either device. 2) There was no significant difference in the times to optimum view or intubation over the 5 intubations for each of the devices separately. The learning curves for both devices are ‘flat’. 3) Using the Cobalt GlideScope® does not affect the time taken by residents to achieve visualization or intubation with the direct laryngoscope, and vice versa. The learning curve for one device does not affect the learning curve for the other device. These findings support the notion of teaching the use of the infant GCV to junior anesthesiology residents.
Previous studies have reported either prolonged or similar intubation times with video laryngoscopes when compared with direct laryngoscopy [9-11].
There are several limitations to this study. Residents involved in the current study had no previous experience intubating infants’ tracheas; however all had considerable experience with both direct laryngoscopy and GCV in adults. This may account for the apparent flat learning curves seen in the current study. It may be argued the learning curves came about earlier on in the residents’ training, and the skills and techniques learned in adult practice may have translated to early successful direct and GlideScope® laryngoscopy in small infants. In other words, perhaps the flat learning curves seen in the current study are due to the fact residents had “mastered” the use of this equipment in larger patients. A previous pediatric study suggested that the GlideScope® may provide an equal or better laryngoscopic view compared to direct laryngoscopy, however it required a longer time for intubation [11]. This study involved older children and evaluated the older generation of GlideScope®.
The majority of patients in the current study had an Adnet intubation difficulty score of zero (i.e., easy intubation). Interpretation of any differences in the Adnet scores between DL and GCV intubations using the Adnet Intubation Difficulty Scale is problematic. A recent analysis has found that when the scale is used with indirect laryngoscopes, it may not be indicative of true intubation difficulty [12]. Indeed, compared to direct laryngoscopy, GlideScope® video-laryngoscopy may be associated with improved glottic visualization [11].
The manufacturer’s guidelines for GCV blade sizing should be adhered to whenever possible, or until there is sufficient evidence to alter the current guidelines. Three sizes of single use blades are available for the infant GCV; the size 0 blade is for infants < 1.5 kg, size 1 is for infants weighing 1.5 - 3.6 kg and size 2 is for patients 1.8 - 10 kg. It is for this reason infants weighing 10 kg or less were enrolled, in order to adhere to manufacturer’s guidelines for use of the infant-sized blades. Based on similar learning curve studies for novel intubation devices, five laryngoscopies per device were deemed sufficient to identify or characterize any learning curve [13,14].
In conclusion, this study suggests that the use of the GlideScope® Cobalt Video laryngoscope in infants by anesthesiology residents is associated with a success rate and with times to optimum view of the vocal cords and tracheal intubation comparable to those with direct laryngoscopy. In the author’s opinion the infant GlideScope® Cobalt Video laryngoscope may be a useful teaching tool and intubation aide.
REFERENCES
- Armstrong J, John J, Karsli C (2010) A comparison between the GlideScope Video Laryngoscope and direct laryngoscope in paediatric patients with difficult airways - a pilot study. Anaesthesia 65: 353-357.
- Di Marco P, Scattoni L, Spinoglio A, Luzi M, Canneti A, et al. (2011) Learning curves of the Airtraq and the Macintosh laryngoscopes for tracheal intubation by novice laryngoscopists: a clinical study. Anesth Analg 112: 122-125.
- Iacovidou N, Bassiakou E, Stroumpoulis K, Koudouna E, Aroni F, et al. (2011) Conventional direct laryngoscopy versus video laryngoscopy with the GlideScope®: a neonatal manikin study with inexperienced intubators. Am J Perinatol 28: 201-206.
- White M, Weale N, Nolan J, Sale S, Bayley G (2009) Comparison of the Cobalt GlideScope video laryngoscope with conventional laryngoscopy in simulated normal and difficult infant airways. Paediatr Anaesth 19: 1108-1112.
- Adnet F, Borron SW, Racine SX, Clemessy JL, Fournier JL, et al. (1997) The Intubation Difficulty Scale (IDS): proposal and evaluation of a new score characterizing the complexity of endotracheal intubation. Anesthesiology 87: 1290-1297.
- David B Rorabacher (1991) Statistical Treatment for Rejection of Deviant Values: Critical Values of Dixon’s “Q” Parameter and Related Subrange Ratios at the 95% Confidence Level. Anal Chem 63: 139-146.
- Faul F, Erdfelder E, Lang AG, Buchner A (2007). G*Power 3: a flexible statistical power analysis program for the social, behavioral, and biomedical sciences. Behav Res Methods 39: 175-191.
- Fiadjoe JE, Gurnaney H, Dalesio N, Sussman E, Zhao H, et al. (2012) A Prospective randomized equivalence trial of the GlideScope® cobalt video laryngoscope to traditional direct laryngoscopy in neonates and infants. Anesthesiology 116: 622-628.
- Fiadjoe JE, Stricker PA, Hackell RS, Salam A, Gurnaney H, et al. (2009) The efficacy of the Storz Miller 1 video laryngoscope in a simulated infant difficult intubation. Anesth Analg 108: 1783-1786.
- Vlatten A, Aucoin S, Litz S, Macmanus B, Soder C (2009) A comparison of the STORZ video laryngoscope and standard direct laryngoscopy for intubation in the Pediatric airway--a randomized clinical trial. Paediatr Anaesth 19: 1102-1107.
- Kim JT, Na HS, Bae JY, Kim DW, Kim HS, et al. (2008) GlideScope video laryngoscope: a randomized clinical trial in 203 paediatric patients. Br J Anaesth 101: 531-534.
- McElwain J, Simpkin A, Newell J, Laffey JG (2011) Determination of the utility of the Intubation Difficulty Scale for use with indirect laryngoscopes. Anaesthesia 66: 1127-1133.
- Savoldelli GL, Schiffer E, Abegg C, Baeriswyl V, Clergue F, et al. (2009) Learning curves of the Glidescope, the McGrath and the Airtraq laryngoscopes: a manikin study. Eur J Anaesthesiol 26: 554-558.
- Malik MA, Hassett P, Carney J, Higgins BD, Harte BH, et al. (2009) A comparison of the Glidescope, Pentax AWS, and Macintosh laryngoscopes when used by novice personnel: a manikin study. Can J Anaesth 56: 802-811.
Citation: Faden M, El-Beheiry H, Pehora, Karsli C (2015) Learning Curve of the Infant GlideScope® Cobalt Video Laryngoscope in Anesthesiology Residents. J Anesth Clin Care 1: 006.
Copyright: © 2015 Mazen Faden, et al. This is an open-access article distributed under the terms of the Creative Commons Attribution License, which permits unrestricted use, distribution, and reproduction in any medium, provided the original author and source are credited.
© 2026, Copyrights Herald Scholarly Open Access. All Rights Reserved!