Metabolism in the Diabetic Brain: Neurochemical Profiling by 1H Magnetic Resonance Spectroscopy
*Corresponding Author(s):
João MN DuarteLaboratory For Functional And Metabolic Imaging, École Polytechnique Fédérale De Lausanne, Lausanne, Swaziland
Tel:+41 216937995,
Email:joao.duarte@epfl.ch
Abstract
Diabetes is associated with decrements in cognitive function and with abnormalities in brain morphology. In addition, alterations of metabolism have been reported in the diabetic brain. Magnetic Resonance Spectroscopy (MRS) is a non-invasive technique that can be employed to determine the concentration of metabolites in a fully non-invasive manner under normal physiological conditions. The present article reviews major findings from 1H MRS studies in the brain of diabetes patients, and of pre-clinical models of both insulin-dependent and insulin-resistant diabetes. Metabolic alterations measured in vivo by MRS are closely associated to events of the neurodegenerative process at cellular level, and thus allow understanding the pathophysiology of diabetes-associated brain complications. Moreover, MRS constitutes an excellent toll for tracking outcomes of therapeutic interventions. However, further studies are required to clearly establish the links between diabetes-induced alterations of metabolism, structure and function in the brain.
Keywords
ABBREVIATIONS
MRI : Magnetic Resonance Imaging
MRS : Magnetic Resonance Spectroscopy
NAA : N-acetylaspartate
INTRODUCTION
While type 1 diabetes is linked to autoimmune destruction of insulin-releasing β-cells, type 2 diabetes is closely associated with obesity, a pandemic that in western societies is favoured by a sedentary lifestyle and the widespread consumption of palatable food products rich in saturated fat and refined carbohydrates [1]. Both type 1 (insulin-dependent) and type 2 (insulin-resistant) diabetes affect brain structure and function. Diabetes is associated with chronic hyperglycaemia, microvascular complications, insulin resistance, dyslipidaemia, and hypertension, which are all important risk factors for cognitive dysfunction [2,3]. A plethora of studies in rodent models of diabetes suggest that both glucose neurotoxicity and deficient insulin signalling trigger a neurodegenerative process that leads to behavioural and cognitive alterations. In particular, diabetic conditions cause synaptic deterioration that is accompanied by alterations of neuromodulation systems namely in the hippocampus [2]. These modifications likely result in defective neurotransmission and synaptic plasticity, with behavioural consequences. Notably, the brain of diabetes patients also displays important atrophy of the hippocampus, which can be detected by Magnetic Resonance Imaging (MRI) [3-6]. While neurodegeneration has been largely studied in diabetes, metabolic modifications require elucidation. Neuronal loss and tissue atrophy are measurable by conventional imaging modalities. However neuronal dysfunction begins with biochemical modifications much before symptoms and irreversible tissue damage occurs [7,8]. Since the impact of diabetes on brain metabolic pathways may precede synaptic degeneration, neuronal loss and tissue atrophy, the ability of detecting such brain metabolic alterations early in the neurodegenerative process will allow for effective pharmacological and/or behavioural interventions. Early interventions exerting metabolic control may prevent future irreversible tissue deterioration, and halt the cognitive decline in diabetes.
NEUROCHEMICAL PROFILING BY PROTON MAGNETIC RESONANCE SPECTROSCOPY
Magnetic resonance techniques provide unique capabilities for studying brain function in living tissues and thus received considerable attention in the past couple of decades. The physical mechanism by which nuclei with magnetic moment produce magnetic resonance signals is out of the scope of this review. A simple explanation of Magnetic Resonance Spectroscopy (MRS) principles and techniques can be found elsewhere [9].
MRI is usually employed to detect protons (1H) of water. Given the large concentration of water in brain tissue, it has been possible to image structure and function of healthy and diseased central nervous system in high detail. On the other hand, 1H MRS is a non-invasive technique based on the 1H resonance of carbon-bound hydrogen atoms in metabolites. Each 1H in the sample experiences a slightly different magnetic field depending on its chemical environment, therefore resonating at a slightly different frequency. Most of the signal in 1H MRS will come from the bulk tissue water, but by suppressing the signal from water protons, one is then able to observe a spectrum containing signals from a variety of molecules occurring in the µmol/g, that is, at concentrations several orders of magnitude smaller than tissue water. The assessment of metabolite concentrations in vivo by MRS thus provides information complementary to MRI.
In the particular case of the brain, 1H MRS provides a set of biomarkers - the neurochemical profile - that can be employed for non-invasive assessment of disease development and outcome of therapeutic interventions [8]. The number of quantifiable metabolites depends on many factors in the MRS acquisition process, namely the pulse sequence parameters, and the spectral signal-to-noise ratio and spectral resolution [7]. To simplify the spectral analysis at low magnetic fields, many studies performed 1H MRS with long echo times. With this approach, the major resonances observed are from N-Acetylaspartate (NAA), total creatine (creatine plus phosphocreatine), choline-containing compounds, glutamate plus glutamine (often called “Glx”), and myo-inositol. The role of each MRS-detectable metabolite in the brain was reviewed and discussed previously [7]. Importantly, NAA is present in neurons but not in glial cells of the mature brain, which makes it an important biomarker for neuronal integrity. In contrast, elevated myo-inositol has been generally considered to represent astrogliosis, and choline has been referred as a marker for increased membrane turnover, cellular proliferation, or inflammation. Since glutamate is mostly present in neurons and glutamine is synthetized in glial cells, “Glx” variations are of difficult interpretation. Total creatine is generally assumed to be uniformly distributed across brain cells and thus has been used as normalisation factor for the remaining MRS signals.
Over the last couple of decades, major methodological improvements allied to increases in sensitivity and spectral resolution at high magnetic fields provide absolute quantification of an extended number of metabolites in the brain in both humans and small animals (Figure 1). At high magnetic field, nowadays considered 7 T and above, state-of-the-art brain MRS provides a neurochemical profile composed of the chemical species present in the brain at a concentration above ~0.2 μmol/g, in practice about 20 metabolites. The concentrations of metabolites measured in vivolikely reflect the activity of metabolic processes in the living tissue [10], and the ability to measure an extended neurochemical profile affords insight into key biochemical processes at the cellular level. In line with this, it is known that neurochemical profiles (1) are modified during brain development, maturation and aging reflecting the structural and functional changes in the cerebral networks, (2) are region specific reflecting cell populations, (3) reflect brain functional states, and (4) are affected by environmental factors and pathological conditions [7].
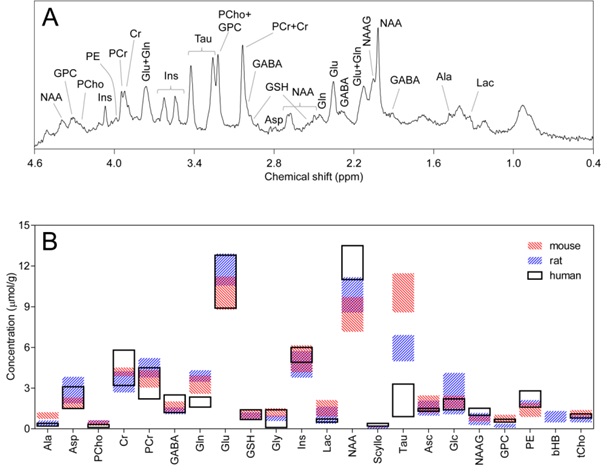
Ala: Alanine; Asc: Ascorbate; Asp: Aspartate; bHB: β-Hydroxybutyrate; Cr: Creatine; GABA: γ-aminobutyrate; Glc: Glucose; Gln: Glutamine; Glu: Glutamate; Gly: Glycine; GPC: Glycerylphosphorylcholine; GSH: Glutathione; Ins: myo-inositol; Lac: Lactate; NAA: N-Acetylaspartate; NAAG; N-Acetylaspartylglutamate; PCho: Phosphorylcholine; PCr: Phosphocreatine; PE: Phosphorylethanolamine; Scyllo: scyllo-inositol; Tau: Taurine; tCho: total choline (PCho + GPC)
MRS IN DIABETES PATIENTS
Seaquist et al., [27] employed MRS at a higher magnetic field (4 T) to measure cortical glucose levels in type 1 diabetes patients and control subjects, and found no significant difference between the glucose concentrations in patients with poorly controlled diabetes and those in healthy volunteers studied at the same plasma glucose concentration [27]. Thus it appears unlikely that chronic hyperglycaemia in diabetes has clinically meaningful effects on brain glucose concentration at steady-state, as was also found in streptozotocin-induced diabetic rats [28,29]. On the other hand, patients with type 1 diabetes and hypoglycaemia unawareness displayed higher brain glucose concentrations compared to that in controls under identical experimental conditions [30], suggesting that recurrent hypoglycaemia episodes may result in increased blood to brain glucose transport. Although these studies did not report alterations on other brain neurochemicals [27,30], a later re-analyses of a carefully selected subset of subjects revealed small diabetes-induced reductions in NAA and glutamate concentrations in grey but not white matter of the cortex [31]. Interestingly, an earlier study investigated the frontal and parietal cortex, and reported no differences in metabolite levels (namely NAA/creatine and choline/creatine) between of type 1 diabetes patients with and without recurrent hypoglycaemia [32].
Recent studies reported no difference in baseline concentrations of neurochemicals in the brain of type 1 diabetes patients relative to healthy control subjects, while the brain metabolic response to hypoglycaemia may be impaired in diabetes [33,34]. In healthy subjects a hypoglycaemia insult leads to a reduction of brain glutamate levels, a response that is blunted in diabetes patients depending on their degree of hypoglycaemia-associate autonomic failure, a syndrome that includes hypoglycaemia unawareness [33,34]. In addition, brain lactate levels drop during hypoglycaemia in diabetes patients (depending on whether awareness of hypoglycaemia is impaired or not), suggesting stimulated utilisation of lactate as metabolic substrate [33,34]. Interestingly, during hypoglycaemia with lactate infusion, type 1 diabetic patients displayed increased brain lactate levels relative to healthy subjects [35]. Altogether, these reports suggest that, even if basal metabolism is unaltered in the diabetic brain, metabolic adaptations to hypoglycaemia differ from those in the brain of healthy subjects. Moreover, diabetic patients exposed to repeated hypoglycaemia episodes may display specific brain metabolic adaptations [2] (further discussed in [2]), which may be a confounding effect on neurochemical profiling.
Other studies included patients with both type 1 and type 2 diabetes. In these studies, there diabetes was found to increase choline/creatine [36,37] and to reduce NAA [38] in cortical areas of patients relative to controls. These three studies reported an increase in cortical myo-inositol levels induced by diabetes [36-38]. Another MRS study at 1.5 T with type 1 and type 2 diabetes patients reported a diabetes-induced reduction in NAA levels in the left thalamus and dorsolateral prefrontal cortex, but not in the anterior cingulate cortex [39].
Ajilore et al., [44] performed MRS at 1.5 T on type 2 diabetes patients exhibiting also major depression. The authors found that glutamine and glutamate concentrations were reduced in a region encompassing the subcortical nuclei of depressed diabetic patients, relative to both healthy subjects and diabetes patients without depression [44]. Moreover, levels of myo-inositol were increased in the frontal white matter of diabetes patients with or without depression, relative to controls subjects [44]. In this study, NAA and choline levels were similar in all subjects. This study suggests that confounding factors may underlie the heterogeneity of MRS findings in diabetes patients. Tong et al., [45] studied metabolite changes of brain tissue in the left frontal white matter, left lenticular nucleus, and left optic radiation of type 2 diabetes mellitus patients with and without retinopathy with MRS at 3 T. Interestingly, the authors found that NAA/creatine ratios were reduced only in the frontal white matter and optic radiation of patients with retinopathy, relative to healthy subjects. However, myo-inositol/creatine was higher in the left lenticular nucleus of diabetes patients than of controls, but not in patients with retinopathy. A 3-T MRS study reported increased glutamate and myo-inositol levels in the occipitoparietal grey matter in subjects with metabolic syndrome relative to controls [46]. However, in a subsequent study, the authors suggested that peripheral atherosclerosis can be a confounder in MRS studies: individuals with metabolic syndrome were found to have increased glutamate concentration in the occipitoparietal grey matter, relative to controls, but only if they also display high carotid artery intima-media thickness [47].
The brain is composed of many anatomical structures with different functions. The heterogeneity of MRS findings in the diabetic brain is likely linked to the investigation of different brain areas in each independent study. On the other hand, most MRS studies in the brain of diabetes patients were performed at low magnetic field, which may not provide sufficient spectral resolution for reliable neurochemical profiling. Furthermore, the little control over comorbidities of the recruited subjects in MRS studies hampers the ability to detect small diabetes-induced changes in the concentration of neurochemicals. Nevertheless, it appears that a reduction in the levels of the putative neuronal marker NAA, as well as an increase in myo-inositol content, accompany the neurodegeneration process in diabetes. Interestingly, a recent study suggested that insulin sensitivity is associated to cortical levels of these two metabolites [48]. In other neurodegenerative disorders, and notably in Alzheimer’s disease, reduced NAA and increased myo-inositol concentrations have been associated with brain dysfunction [8].
MRS IN EXPERIMENTAL MODELS OF DIABETES
Proton MRS became a tool of choice to investigate metabolic alterations induced by brain disorders in a non-invasive manner, and it has also been employed to study brain metabolism in experimental models of diabetes. Diabetic rats exposed to several weeks of chronic hyperglycaemia, induced by streptozotocin administration (widely used experimental model of type 1 diabetes), display a plethora of metabolic alterations in the hippocampus and cortex, relative to control rats [28,29]. Interestingly, these studies also found that most hyperglycaemia-induced metabolic alterations are normalized upon acute restoration of euglycaemia. Some of the metabolites more affected by hyperglycaemia were the brain osmolytes myo-inositol, taurine and creatine, suggesting that alterations of the neurochemical profile are mainly related to osmolarity regulation. Similar results were obtained in Goto-Kakizaki rats, an experimental model of insulin resistance and type 2 diabetes [49]. High concentration of myo-inositol was also reported in the hippocampus of Zucker diabetic fatty rats compared to controls [50]. Recently, Zang et al., found that chronic hyperglycaemia in streptozotocin-induced diabetic rats leads to a reduction of NAA in the striatum and hippocampus but not in the cortex [51]. While this NAA reduction was installed 4 days after diabetes induction, one month later diabetic rats also displayed higher taurine and myo-inositol levels in the hippocampus, when compared to controls [51]. Thus, the study of the neurochemical profile in these animal models supports the hypothesis that diabetes-induced hippocampal dysfunction involves an osmolarity shift, probably due to continuous exposure to high brain glucose levels.
Classical models of diabetes rarely provide a complete phenotype of type 1 or type 2 diabetes in humans. Therefore, models of diabetes induced by hypercaloric intake are nowadays being preferred for translational research. Indeed, current knowledge regarding the energy imbalances in diet-induced obesity and insulin resistance has been strongly supported by basic research in animals fed hypercaloric diets. For example, mice fed a high-fat diet (60% kcal from fat) show increased body weight, larger adipocytes, higher concentration of lipids in liver and skeletal muscle, and insulin resistance in less than one week after initiating the diet, relative to a control diet [52-54]. Diets with high levels of both fat (58% kcal) and sucrose (26% kcal) also lead to obesity and insulin resistance [55]. Perhaps not surprisingly, hypothalamic injury in mice is evident within a few days of high-fat diet feeding, preceding significant weight gain [56]. Early hypothalamic alterations are thus important determinants for the loss of whole-body metabolic control in these diabetes models.
In the context of diet-induced obesity, rats exposed to one week of high-fat and fructose diet displayed impaired hippocampal insulin signalling, and smaller hippocampal volume with synaptic degeneration, reduced neuronal processes, and astrogliosis [57]. Rats under a similar diet for 5 days displayed impaired performance in place but not object recognition tasks [58], which are dependent on the function of hippocampus and perirhinal cortex, respectively. Furthermore, synaptic deterioration and impaired learning and memory induced by high-fat and high-sucrose diet were found to be dependent on neurotrophic factors that modulate synaptic plasticity [59]. High-fat diet alone is also able to impair hippocampal-dependent spatial memory [60,61]. A recent MRS study in mice exposed to cafeteria diet for 2 months showed that brain choline levels are altered in diet-induced obesity and may reflect the known obesity-induced neuroinflamation in the hippocampus [62]. Auer et al., [62] further found reduced levels of NAA in the hippocampus, consistent with neuronal dysfunction. This study, however, lacked the power to clearly detect alterations on metabolites involved in energy metabolism and neurotransmission, which are indicative of brain dysfunction. In the same study, however, obesity was associated with a reduction of glutamate in the prefrontal cortex, without any other metabolic alterations. Further studies are required to characterise brain metabolic alteration in upon exposure to hypercaloric diets, rich in fat and/or sugars.
CONCLUSION AND FUTURE DIRECTIONS
Diabetes-induced metabolic derangements result in altered neurochemical profiles measured by 1H MRS. However, the link between appearance of cerebral neurochemical alterations and deterioration of brain function in diabetes is not clearly defined. Future studies in patients should include sufficiently large groups of individuals, with a good characterisation of the diabetes phenotype and comorbidities. Importantly, clinical research should be paralleled by translational research in animal models of diabetes in which multi-modal magnetic resonance protocols can provide longitudinal assessment of brain metabolism, structure and function. Such studies will allow identifying the relation between metabolic alterations and brain dysfunction at stages when alterations of brain morphology are not yet present.
At high magnetic fields, neurochemical profiling by state-of-the-art 1H MRS allows to precisely determine the concentration of about 20 metabolites in the living brain [7]. MRS is thus an excellent toll to probe metabolic alterations in the brain of diabetes patients and of animal models in well controlled preclinical studies. Moreover, rather than single-voxel MRS, more advanced MRS methods are available to map the neurochemical profile throughout the brain even in the small rodent brain [63]. In addition to this mapping of the neurochemical profile, one can also map single metabolites throughout the brain with high spatial resolution with Chemical Exchange Saturation Transfer (CEST) MRI, a technique that can, for example, be employed for detection of lactate [64], glucose [65] or glutamate [66]. Thus, in combination with functional magnetic resonance imaging techniques, neurochemical mapping may provide the link between functional and metabolic networks across the brain, as well as their impairment in diabetes. Indeed, connectivity at functional and structural level, as assessed by means of functional and diffusion MRI, are known to be altered in diabetes and pre-diabetes states, and linked to decrements in cognitive performance [6].
ACKNOWLEDGMENTS
The author’s research is supported by the Swiss National Science Foundation (grant 148250), and by the CIBM of the EPFL, UNIL, UNIGE, HUG, CHUV and the Leenaards and Jeantet Foundations.
REFERENCES
- Swinburn BA, Sacks G, Hall KD, McPherson K, Finegood DT, et al. (2011) The global obesity pandemic: shaped by global drivers and local environments. Lancet 378: 804-814.
- Duarte JM (2015) Metabolic Alterations Associated to Brain Dysfunction in Diabetes. Aging Dis 6: 304-321.
- Moheet A, Mangia S, Seaquist ER (2015) Impact of diabetes on cognitive function and brain structure. Ann N Y Acad Sci 1353: 60-71.
- Convit A, Wolf OT, Tarshish C, de Leon MJ (2003) Reduced glucose tolerance is associated with poor memory performance and hippocampal atrophy among normal elderly. Proc Natl Acad Sci USA 100: 2019-2022.
- Gold SM, Dziobek I, Sweat V, Tirsi A, Rogers K, et al. (2007) Hippocampal damage and memory impairments as possible early brain complications of type 2 diabetes. Diabetologia 50: 711-719.
- Biessels GJ, Reagan LP (2015) Hippocampal insulin resistance and cognitive dysfunction. Nat Rev Neurosci 16: 660-671.
- Duarte JM, Lei H, Mlynárik V, Gruetter R (2012) The neurochemical profile quantified by in vivo 1H NMR spectroscopy. Neuroimage 61: 342-362.
- Duarte JM, Schuck PF, Wenk GL, Ferreira GC (2013) Metabolic disturbances in diseases with neurological involvement. Aging Dis 5: 238-255.
- Tognarelli JM, Dawood M, Shariff MI, Grover VP, Crossey MM, et al. (2015) Magnetic Resonance Spectroscopy: Principles and Techniques: Lessons for Clinicians. J Clin Exp Hepatol 5: 320-328.
- Lanz B, Gruetter R, Duarte JM (2013) Metabolic flux and compartmentation analysis in the brain in vivo. Front Endocrinol (Lausanne) 4: 156.
- Duarte JM, Do KQ, Gruetter R (2014) Longitudinal neurochemical modifications in the aging mouse brain measured in vivo by 1H magnetic resonance spectroscopy. Neurobiol Aging 35: 1660-1668.
- Kulak A, Duarte JM, Do KQ, Gruetter R (2010) Neurochemical profile of the developing mouse cortex determined by in vivo 1H NMR spectroscopy at 14.1 T and the effect of recurrent anaesthesia. J Neurochem 115: 1466-1477.
- Duarte JMN, Kulak A, Gholam-Razaee MM, Cuenod MR, Gruetter R, et al. (2012) N-acetylcysteine normalizes neurochemical changes in the glutathione-deficient schizophrenia mouse model during development. Biol Psychiatry 71: 1006-1014.
- Corcoba A, Steullet P, Duarte JM, Van de Looij Y, Monin A, et al. (2016) Glutathione deficit affects the integrity and function of the fimbria/fornix and anterior commissure in mice: relevance for schizophrenia. Int J Neuropsychopharmacol 19.
- Lei H, Berthet C, Hirt L, Gruetter R (2009) Evolution of the neurochemical profile after transient focal cerebral ischemia in the mouse brain. J Cereb Blood Flow Metab 29: 811-819.
- Xin L, Gambarota G, Duarte JM, Mlynárik V, Gruetter R (2010) Direct in vivo measurement of glycine and the neurochemical profile in the rat medulla oblongata. NMR Biomed 23: 1097-1102.
- Sonnay S, Duarte JM, Just N, Gruetter R (2016) Compartmentalised energy metabolism supporting glutamatergic neurotransmission in response to increased activity in the rat cerebral cortex: a 13C MRS study in vivo at 14.1 T. J Cereb Blood Flow Metab.
- Gambarota G, Mekle R, Xin L, Hergt M, van der Zwaag W, et al. (2009) in vivo measurement of glycine with short echo-time 1H MRS in human brain at 7 T. MAGMA 22: 1-4.
- Mekle R, Mlynárik V, Gambarota G, Hergt M, Krueger G, et al. (2009) MR spectroscopy of the human brain with enhanced signal intensity at ultrashort echo times on a clinical platform at 3T and 7T. Magn Reson Med 61: 1279-1285.
- Deelchand DK, Van de Moortele PF, Adriany G, Iltis I, Andersen P, et al. (2010) in vivo 1H NMR spectroscopy of the human brain at 9.4 T: initial results. J Magn Reson 206: 74-80.
- Schaller B, Mekle R, Xin L, Kunz N, Gruetter R (2013) Net increase of lactate and glutamate concentration in activated human visual cortex detected with magnetic resonance spectroscopy at 7 tesla. J Neurosci Res 91: 1076-1083.
- Sarac K, Akinci A, Alkan A, Aslan M, Baysal T, et al. (2005) Brain metabolite changes on proton magnetic resonance spectroscopy in children with poorly controlled type 1 diabetes mellitus. Neuroradiology 47: 562-565.
- Heikkilä O, Lundbom N, Timonen M, Groop PH, Heikkinen S, et al. (2009) Hyperglycaemia is associated with changes in the regional concentrations of glucose and myo-inositol within the brain. Diabetologia 52: 534-540.
- Heikkilä O, Mäkimattila S, Timonen M, Groop PH, Heikkinen S, et al. (2010) Cerebellar glucose during fasting and acute hyperglycemia in nondiabetic men and in men with type 1 diabetes. Cerebellum 9: 336-344.
- Ozsoy E, Doganay S, Dogan M, Alkan A, Firat PG (2012) Evaluation of metabolite changes in visual cortex in diabetic retinopathy by MR-spectroscopy. J Diabetes Complications 26: 241-245.
- Fiorina P, Vezzulli P, Bassi R, Gremizzi C, Falautano M, et al. (2012) Near normalization of metabolic and functional features of the central nervous system in type 1 diabetic patients with end-stage renal disease after kidney-pancreas transplantation. Diabetes Care 35: 367-374.
- Seaquist ER, Tkac I, Damberg G, Thomas W, Gruetter R (2005) Brain glucose concentrations in poorly controlled diabetes mellitus as measured by high-field magnetic resonance spectroscopy. Metabolism 54: 1008-1013.
- Duarte JM, Carvalho RA, Cunha RA, Gruetter R (2009) Caffeine consumption attenuates neurochemical modifications in the hippocampus of streptozotocin-induced diabetic rats. J Neurochem 111: 368-379.
- Wang WT, Lee P, Yeh HW, Smirnova IV, Choi IY (2012) Effects of acute and chronic hyperglycemia on the neurochemical profiles in the rat brain with streptozotocin-induced diabetes detected using in vivo 1H MR spectroscopy at 9.4 T. J Neurochem 121: 407-417.
- Criego AB, Tkac I, Kumar A, Thomas W, Gruetter R, et al. (2005) Brain glucose concentrations in patients with type 1 diabetes and hypoglycemia unawareness. J Neurosci Res 79: 42-47.
- Mangia S, Kumar AF, Moheet AA, Roberts RJ, Eberly LE, et al. (2013) Neurochemical profile of patients with type 1 diabetes measured by 1H-MRS at 4 T. J Cereb Blood Flow Metab 33: 754-759.
- Perros P, Deary IJ, Sellar RJ, Best JJ, Frier BM (1997) Brain abnormalities demonstrated by magnetic resonance imaging in adult IDDM patients with and without a history of recurrent severe hypoglycemia. Diabetes Care 20: 1013-1018.
- Terpstra M, Moheet A, Kumar A, Eberly LE, Seaquist E, et al. (2014) Changes in human brain glutamate concentration during hypoglycemia: insights into cerebral adaptations in hypoglycemia-associated autonomic failure in type 1 diabetes. J Cereb Blood Flow Metab 34: 876-882.
- Wiegers EC, Rooijackers HM, Tack CJ, Heerschap A, de Galan BE, et al. (2016) Brain lactate concentration falls in response to hypoglycemia in patients with type 1 diabetes and impaired awareness of hypoglycemia. Diabetes.
- De Feyter HM, Mason GF, Shulman GI, Rothman DL, Petersen KF (2013) Increased brain lactate concentrations without increased lactate oxidation during hypoglycemia in type 1 diabetic individuals. Diabetes 62: 3075-3080.
- Geissler A, Fründ R, Schölmerich J, Feuerbach S, Zietz B (2003) Alterations of cerebral metabolism in patients with diabetes mellitus studied by proton magnetic resonance spectroscopy. Exp Clin Endocrinol Diabetes 111: 421-427.
- Mäkimattila S, Malmberg-Cèder K, Häkkinen AM, Vuori K, Salonen O, et al. (2004) Brain metabolic alterations in patients with type 1 diabetes-hyperglycemia-induced injury. J Cereb Blood Flow Metab 24: 1393-1399.
- Kreis R, Ross BD (1992) Cerebral metabolic disturbances in patients with subacute and chronic diabetes mellitus: detection with proton MR spectroscopy. Radiology 184: 123-130.
- Sorensen L, Siddall PJ, Trenell MI, Yue DK (2008) Differences in metabolites in pain-processing brain regions in patients with diabetes and painful neuropathy. Diabetes Care 31: 980-981.
- Sinha S, Ekka M, Sharma U, P R, Pandey RM, et al. (2014) Assessment of changes in brain metabolites in Indian patients with type-2 diabetes mellitus using proton magnetic resonance spectroscopy. BMC Res Notes 7: 41.
- Kario K, Ishikawa J, Hoshide S, Matsui Y, Morinari M, et al. (2005) Diabetic brain damage in hypertension: role of renin-angiotensin system. Hypertension 45: 887-893.
- Sahin I, Alkan A, Keskin L, Cikim A, Karakas HM, et al. (2008) Evaluation of in vivo cerebral metabolism on proton magnetic resonance spectroscopy in patients with impaired glucose tolerance and type 2 diabetes mellitus. J Diabetes Complications 22: 254-260.
- Modi S, Bhattacharya M, Sekhri T, Rana P, Tripathi RP, et al. (2008) Assessment of the metabolic profile in Type 2 diabetes mellitus and hypothyroidism through proton MR spectroscopy. Magn Reson Imaging 26: 420-425.
- Ajilore O, Haroon E, Kumaran S, Darwin C, Binesh N, et al. (2007) Measurement of brain metabolites in patients with type 2 diabetes and major depression using proton magnetic resonance spectroscopy. Neuropsychopharmacology 32: 1224-1231.
- Tong J, Geng H, Zhang Z, Zhu X, Meng Q, et al. (2014) Brain metabolite alterations demonstrated by proton magnetic resonance spectroscopy in diabetic patients with retinopathy. Magn Reson Imaging 32: 1037-1042.
- Haley AP, Gonzales MM, Tarumi T, Miles SC, Goudarzi K, et al. (2010) Elevated cerebral glutamate and myo-inositol levels in cognitively normal middle-aged adults with metabolic syndrome. Metab Brain Dis 25: 397-405.
- Haley AP, Gonzales MM, Tarumi T, Tanaka H (2012) Subclinical vascular disease and cerebral glutamate elevation in metabolic syndrome. Metab Brain Dis 27: 513-520.
- Karczewska-Kupczewska M, Tarasów E, Nikolajuk A, Stefanowicz M, Matulewicz N, et al. (2013) The effect of insulin infusion on the metabolites in cerebral tissues assessed with proton magnetic resonance spectroscopy in young healthy subjects with high and low insulin sensitivity. Diabetes Care 36: 2787-2793.
- Duarte JMN, Carvalho RA, Cunha RA, Gruetter R (2009) Effect of long-term caffeine consumption on glucose transport and osmolarity alterations in the hippocampus of STZ-induced and Goto-Kakizaki diabetic rats: in vivo 1H MRS study at 9.4 T. Proc Intl Soc Mag Reson Med 17: 1084.
- van der Graaf M, Janssen SW, van Asten JJ, Hermus AR, Sweep CG, et al. (2004) Metabolic profile of the hippocampus of Zucker Diabetic Fatty rats assessed by in vivo 1H magnetic resonance spectroscopy. NMR Biomed 17: 405-410.
- Zhang H, Huang M, Gao L, Lei H (2015) Region-specific cerebral metabolic alterations in streptozotocin-induced type 1 diabetic rats: an in vivo proton magnetic resonance spectroscopy study. J Cereb Blood Flow Metab 35: 1738-1745.
- Ji Y, Sun S, Xia S, Yang L, Li X, et al. (2012) Short term high fat diet challenge promotes alternative macrophage polarization in adipose tissue via natural killer T cells and interleukin-4. J Biol Chem 287: 24378-24386.
- Lee YS, Li P, Huh JY, Hwang IJ, Lu M, et al. (2011) Inflammation is necessary for long-term but not short-term high-fat diet-induced insulin resistance. Diabetes 60: 2474-2483.
- Samuel VT, Liu ZX, Qu X, Elder BD, Bilz S, et al. (2004) Mechanism of hepatic insulin resistance in non-alcoholic fatty liver disease. J Biol Chem 279: 32345-32353.
- Omar B, Pacini G, Ahrén B (2012) Differential development of glucose intolerance and pancreatic islet adaptation in multiple diet induced obesity models. Nutrients 4: 1367-1381.
- haler JP, Yi CX, Schur EA, Guyenet SJ, Hwang BH, et al. (2012) Obesity is associated with hypothalamic injury in rodents and humans. J Clin Invest 122: 153-162.
- Calvo-Ochoa E, Hernández-Ortega K, Ferrera P, Morimoto S, Arias C (2014) Short-term high-fat-and-fructose feeding produces insulin signaling alterations accompanied by neurite and synaptic reduction and astroglial activation in the rat hippocampus. J Cereb Blood Flow Metab 34: 1001-1008.
- Beilharz JE, Maniam J, Morris MJ (2014) Short exposure to a diet rich in both fat and sugar or sugar alone impairs place, but not object recognition memory in rats. Brain Behav Immun 37: 134-141.
- Molteni R, Barnard RJ, Ying Z, Roberts CK, Gómez-Pinilla F (2002) A high-fat, refined sugar diet reduces hippocampal brain-derived neurotrophic factor, neuronal plasticity, and learning. Neuroscience 112: 803-814.
- McNay EC, Ong CT, McCrimmon RJ, Cresswell J, Bogan JS, et al. (2010) Hippocampal memory processes are modulated by insulin and high-fat-induced insulin resistance. Neurobiol Learn Mem 93: 546-553.
- Pistell PJ, Morrison CD, Gupta S, Knight AG, Keller JN, et al. (2010) Cognitive impairment following high fat diet consumption is associated with brain inflammation. J Neuroimmunol 219: 25-32.
- Auer MK, Sack M, Lenz JN, Jakovcevski M, Biedermann SV, et al. (2015) Effects of a high-caloric diet and physical exercise on brain metabolite levels: a combined proton MRS and histologic study. J Cereb Blood Flow Metab 35: 554-564.
- Alf MF, Duarte JM, Lei H, Krämer SD, Mlynarik V, et al. (2014) MRS glucose mapping and PET joining forces: re-evaluation of the lumped constant in the rat brain under isoflurane anaesthesia. J Neurochem 129: 672-682.
- DeBrosse C, Nanga RP, Bagga P, Nath K, Haris M, et al. (2016) Lactate Chemical Exchange Saturation Transfer (LATEST) Imaging in vivo A Biomarker for LDH Activity. Sci Rep 6: 19517.
- Xu X, Yadav NN, Knutsson L, Hua J, Kalyani R, et al. (2015) Dynamic Glucose-Enhanced (DGE) MRI: Translation to Human Scanning and First Results in Glioma Patients. Tomography 1: 105-114.
- Davis KA, Nanga RP, Das S, Chen SH, Hadar PN, et al. (2015) Glutamate imaging (GluCEST) lateralizes epileptic foci in nonlesional temporal lobe epilepsy. Sci Transl Med 7: 309ra161.
Citation: Duarte JMN (2016) Metabolism in the Diabetic Brain: Neurochemical Profiling by 1H Magnetic Resonance Spectroscopy. J Diabetes Metab Disord 3: 011.
Copyright: © 2016 João MN Duarte, et al. This is an open-access article distributed under the terms of the Creative Commons Attribution License, which permits unrestricted use, distribution, and reproduction in any medium, provided the original author and source are credited.