The Influences of Income and Education on the Illness Perception and Self-Management of Thai Adults with Type 2 Diabetes
*Corresponding Author(s):
Wimonrut BoonsateanDepartment Of Nursing Science, Rangsit University, Pathum Thani, Thailand
Tel:+66 814542777,
Email:boonsatean@yahoo.com
Abstract
Illness perception and self-management might be of importance in proactive care for patients with type 2 diabetes.
Objective: The aim of the study was to examine the influences of socioeconomic status on the illness perception and self-management of Thai people with diabetes.
Methods: A cross-sectional descriptive method was used to study 220 people with type 2 diabetes in a suburban area in Thailand. The participants were selected using a multistage sampling method. Data were collected through the structured interviews using the revised versions of the Diabetes Illness Perception scale and Diabetes Self-Management scale. Independent sample t test or Mann-Whitney U test was used for income and education subgroups comparisons as well as multiple logistic regression was analyzed the predictors of illness perception and self-management.
Results: The results indicated that socioeconomic status, defined by income and educational level, showed the effects on some aspects of illness perception and self-management strategies in a type 2 diabetes population. Educational level demonstrated more effects on many subscales of illness perception and self-management than on income and was also shown to be a predictor of self-management (OR 2.047, 95% CI 1.014-4.131, p-value 0.046).
Conclusion: The study found that socioeconomic status had an impact on the illness perception and self-management of people with type 2 diabetes. Educational level demonstrated a significant influence on the perceptions and management of Thai people with diabetes, which was also true concerning income level, although to a lesser extent. Illuminating socioeconomic status in the context of religious beliefs may increase health care professionals’ understanding of patients’ experiences and management of their diabetes. This is especially important when designing appropriate interventions for patients of low education.
Keywords
INTRODUCTION
Type 2 Diabetes (T2D) is a chronic disease that places a heavy burden on patients. Because of its continually increasing prevalence worldwide [1,2], T2D has become a growing concern for healthcare professionals. The global prevalence of T2D among adults was approximately 9% in 2014 [3]. In Thailand, the occurrence of T2D is increasing and it is one of the five most common chronic diseases [4], with a prevalence of approximately 6.4% in 2013 [1].
Improving health literacy, the ability to use healthcare information to follow instructions for treatment [5] is of continued and increasing concern for health professionals essential to promote healthy individuals and communities. Research in diabetes health literacy is needed to fully understand the burden of the chronic disease.
Several international studies have identified a relationship between T2D and socioeconomic status by evaluating factors such as income level, educational attainment, and occupation [6-8]. Living at low economic levels, including poverty, can affect people’s lives [9]. People with low incomes or with a low level of education are more likely to be affected by a high prevalence of diabetes [6,7] and more diabetes complications than those of high socioeconomic status [8]. Education and economic levels have also been identified as predictors of diabetes mortality risk [10], and having high socioeconomic status is seen as a protective factor for the negative psychological symptoms such as anxiety and depression of people with diabetes [11].
The term “illness perception” is used both to describe a person’s cognitive and emotional response pattern and coping styles when living with the disease and as the experiences and understanding of his or her situation [12]. People that perceive barriers to self-care when living with diabetes experience more consequences of the disease and show high emotional response [13]. Furthermore, western studies have demonstrated negative psychological consequences resulting from T2D, such as depression and anxiety [11,14], which have been seen to be higher among young people, females, and those with a low income [15]. Other studies have indicated that diabetes distress is linked to poorer self-care activities [16], especially adherence to medications and poorer glycemic control [15].
Self-management is often described as the way people handle their lives with the disease through self-care activities and with their own cognitive decision making and in cooperation with the support from significant social networks [17]. Lautenschlager & Smith [18] found that although people are able to verbalize information concerning self-care practices, few people can apply this knowledge in their own life. Research has also reported a relationship between employment and economic hardship and diabetes self-management [19], suggesting that low economic status is a barrier to attaining successful self-management [20]. In addition, people living in a deprivation status have been observed to have poorer glycemic control [21]. Furthermore, diet management in comparison to Self-Monitoring of Blood Glucose level (SMBG) has been found to be the most common self-care practice in controlling diabetes among low economic groups [22].
T2D is a common chronic disease in Thailand [4], and only 28% of Thai people are able to control their plasma glucose level [23]. Studies in western countries have found differences in diabetes perceptions and self-management in relation to race and ethnicity [24] and have found a relationship between socioeconomic inequality and glycemic control [25,26]. Until now, the research conducted in Thailand with people with type 2 diabetes has mostly focused on the issue of self-management without comparing different socioeconomic conditions [27-29]. Thus, knowledge concerning the effects of socioeconomic status is limited. In order to increase this knowledge, it is important to investigate the influences of socioeconomic status on people’s life with diabetes, particularly concerning income and education. Increased knowledge in this field may help healthcare professionals design more suitable and effective care plans for people living with T2D.
As a part of a larger study investigating a Thai population with type 2 diabetes, the aim of this study was to examine illness perception and self-management in relation to socioeconomic status defined by income and educational level. An additional aim was to determine if socioeconomic factors were important in predicting illness perception and self-management strategies.
MATERIALS AND METHODS
This study was carried out using a cross-sectional descriptive method. Data were collected using questionnaires and each participant was measured one time in order to determine their illness perception and self-management of the T2D.
SETTING
The research area was Pathum Thani province, a suburban area in Thailand. Most of the inhabitants in this province are Buddhist (94.5%) and work in the industrial sector (71.1%) [30]. Population living in this province represent 4.7% of the overall unschooled people in Thailand [31]. The setting areas in this study were within the responsibility of the Health Promoting Hospitals (HPHs), a front line healthcare service in the public healthcare system that provides pro motive, preventive, and primary medical care to the entire population in the catchment areas. These healthcare services are available to all inhabitants with free essential treatment without any cost limit. However, people can access healthcare services from other hospitals that are not recommended in their health insurance scheme if they themselves pay for the treatment costs.
PROCEDURES
Sampling method
Participants
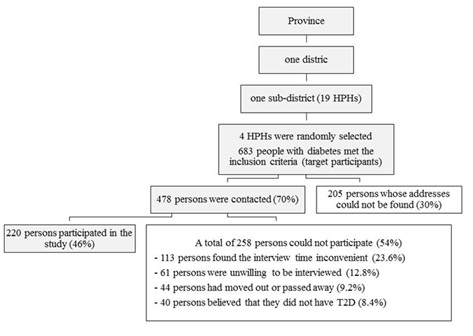 Figure 1: Flow diagram of procedures for selecting the participant.
 Data collection
INSTRUMENTS
The interview instruments included a demographic form, including socio-demographic characteristics and illness-related information, and two previously developed scales used in diabetes research that were translated into Thai. These questionaires comprised the diabetes Illness Perception Questionnaire (IPQ-R) developed by Moss-Morris et al. [12], and the new revision of the Diabetes Self-Management Questionnaire (DSMQ-R) developed by Schmitt et al. [34]. Both instruments have earlier shown good psychometric properties [12,34].
The IPQ-R diabetic version questionnaire consists of three sections: identity, diabetes perception, and causal sections. The identity section focuses on the participants’ beliefs about 14 common symptoms that are associated with diabetes with a yes/no format. The diabetes perception section consists of 38 items divided into seven subscales that present the participants’ beliefs about their diabetes condition, its consequences, the ability to control the disease by themselves and with treatment, and emotional representation. The terms of the seven subscales were as follows: timeline, consequences, personal control, treatment control, illness coherence, timeline cyclical, and emotional representations. In this study, the terms “timeline” and “timeline cyclical,” which refer to perceptions about the expected duration of the illness and the possibility of recurrence, were changed to “acute or chronic conditions” and “fluctuating symptoms,” respectively. Lastly, the causal section focuses on the participants’ views about the possible causes of their diabetes, which comprised 18 items. A five-point Likert scale—1 (strongly disagree), 2 (disagree), 3 (neither agree nor disagree), 4 (agree), or 5 (strongly agree) —was applied to both the diabetes perception section and the causal section. High scores represented strongly-held or positive beliefs.
The DSMQ-R scale was used to access the participants’ self-care activities over the previous 8 weeks. This instrument comprised 27 items of self-care activities for the insulin-treated participants, while the non-insulin-treated participants only used the first 20 items. The scores were reported as a sum scale and with four subscales: glucose management, dietary control, physical activity, and healthcare use. A four-point Likert scale, 0 (does not apply to me), 1 (applies to me to some degree), 2 (applies to me to a considerable degree), and 3 (applies to me very much), were used. The scores for the sum scale and each subscale were computed according to the formula in the scoring guide, which ranged between 0 and 10. High scores indicated more effective self-management.
DATA ANALYSIS
SPSS for Windows version 21.0 [35] was used for the data analysis at the significant level of 0.05. The participants were divided into one low- and one high-income group, according to their income per month, and into one low- and one high-educational group, according to their maximum educational level. The Thai national poverty line in 2014, which was 2,835 THB/person/month (approximately 81 USD/person/month) [36], was used as a cutoff point for income. The participants that were unschooled or had a maximum educational level of primary school were defined as the low-education group, and the others were classified as the high-education group.
The categorical demographic variables were presented according to frequency and percentage, and a chi-square test was used to compare the differences among the subgroups with low and high income and education. Regarding the continuous demographic variables, the median was calculated because of the skewed nature of the data, and the differences among groups were analyzed using the Mann-Whitney U test [37].
The IPQ-R diabetic version scale was analyzed according to each section. Percentages were used to show the symptoms experienced since having T2D. The identity section was computed with the sum of yes-rated symptoms and the mean and Standard Deviation (SD) were calculated. Each subscale of the diabetes perception section was analyzed using the mean and SD. The mean scores for the identity and diabetes sections among the income subgroups and education subgroups were compared using an independent samples t test or the Mann-Whitney U test depending on the nature of the data distribution [37]. The causal section was analyzed using separate items. Each item in the causal section was grouped into a dichotomous variable (disagreed or agreed with the item that might have been the cause of T2D) and was presented according to percentage.
The DSMQ-R scale, both the sum scale and subscales, was analyzed for mean scores and SD, and the different mean scores in the income subgroups and education subgroups were compared using the independent samples t test or the Mann-Whitney U test [37].
Additionally, the associations and the predictors of illness perception and self-management strategies according to socioeconomic status were analyzed using multiple logistic regression [37].
ETHICAL CONSIDERATIONS
This project was approved by the Committee on Human Rights Related to Research Involving Human Subjects (School of Nursing, Rang sit University, Thailand), based on the declaration of Helsinki (approval number 005/2015). As poverty, income, and educational level might be experienced as a delicate matter, the respect for autonomy and human dignity [38] was seriously followed when approaching and interviewing the participants. All of the participants were volunteers and were free to participate or withdraw from the study at any time. The consent form was signed before the interview began. In addition, all of the data were kept with full confidentiality.
RESULTS
Demographic characteristics
| Demographic Variables | Total (n = 220)n (%) | Income | Statistical Tests(p-value) | Education | Statistical Tests(p-value) | ||
| Socio-demographic characteristics | |||||||
| Sex | |||||||
| Female | 150 (68.2) | 43 (74.1) | 107 (66.0) | X2 = 1.288(0.256) | 131 (75.7) | 19 (40.4) | X2 = 21.225***(0.000) |
| Male | 70 (31.8) | 15 (25.9) | 55 (34.0) | 42 (24.3) | 28 (59.6) | ||
| Educational level | |||||||
| Unschooled | 27 (12.3) | 15 (25.9) | 12 (7.4) | X2 = 19.578***(0.000) | - | - | - |
| Primary school | 146 (66.4) | 39 (67.2) | 107 (66.0) | ||||
| Higher than primary school | 47 (21.4) | 4 (6.9) | 43 (26.5) | ||||
| Marital status | |||||||
| Unmarried | 74 (33.6) | 25 (43.1) | 49 (30.2) | X2 = 3.162(0.075) | 60 (34.7) | 14 (29.8) | X2 = 0.397(0.529) |
| Married | 146 (66.4) | 33 (56.9) | 113 (69.8) | 113 (65.3) | 33 (70.2) | ||
| Religion | |||||||
| Buddhism | 220 (100.0) | 58 (100.0) | 162 (100.0) | - | 173 (100.0) | 47 (100.0) | - |
| Occupation | |||||||
| Employed | 22 (10) | 5 (8.6) | 17 (10.5) | X2 = 0.747(0.688) | 17 (9.8) | 5 (10.6) | X2 = 1.832(0.400) |
| Self-employed | 72 (32.7) | 17 (29.3) | 55 (34.0) | 53 (30.6) | 19 (40.4) | ||
| Unemployed | 126 (57.3) | 36 (62.1) | 90 (55.6) | 103 (59.5) | 23 (48.9) | ||
| Adequacy of family income | |||||||
| Inadequacy | 49 (22.3) | 20 (34.5) | 29 (17.9) | X2 = 6.783**(0.009) | 44 (25.4) | 5 (10.6) | X2 = 4.673*(0.031) |
| Adequacy | 171 (77.7) | 38 (65.5) | 133 (82.2) | 129 (74.6) | 42 (89.4) | ||
| Illness-Related information | |||||||
| Usual health service used health Promoting hospital | 109 (49.5) | 31 (53.4) | 78 (48.1) | X2 = 0.941(0.625) | 92 (53.2) | 17 (36.2) | X2 = 6.670*(0.036) |
| Other public hospitals | 94 (42.7) | 24 (41.4) | 70 (43.2) | 71 (41.0) | 23 (48.9) | ||
| Private hospital | 17 (7.7) | 3 (5.2) | 14 (8.6) | 10 (5.8) | 7 (14.9) | ||
| Preferential treatment+ | |||||||
| Universal coverage | 173 (78.6) | 48 (82.8) | 125 (77.2) | X2 = 0.797(0.372) | 147 (85.0) | 26 (55.3) | X2 = 19.343***(0.000) |
| Other preferential treatments | 47 (21.4) | 10 (17.2) | 37 (22.8) | 26 (15.0) | 21 (44.7) | ||
| Current treatment | |||||||
| Oral anti-diabetic agent(s) | 183 (83.2) | 55 (94.8) | 128 (79.0) | X2 = 7.636**(0.006) | 148 (85.5) | 35 (74.5) | X2 = 3.244(0.072) |
| Oral pills in combination with other treatments | 37 (16.8) | 3 (5.2) | 34 (21.0) | 25 (14.5) | 12 (25.5) | ||
| Experience of diabetes complications | |||||||
| No | 53 (24.1) | 15 (25.9) | 38 (23.5) | X2 = 0.135(0.713) | 40 (23.1) | 13 (27.7) | X2 = 0.416(0.519) |
| Yes | 167 (75.9) | 43 (74.1) | 124 (76.5) | 133 (76.9) | 34 (72.7) | ||
| Median (Inter quartile) | |||||||
| Age (Year) | 64 (55-70) | 64 (58-72.3) | 63 (55-70) | Z = -1.212(0.225) | 64 (56-70) | 63 (50-70) | Z = -1.193(0.233) |
| Estimated average income/month/person (THB) | 5,000(2,687-8,333) | 2,000(1,075-2,500) | 6,428(4,167-10,000) | Z = -11.300***(0.000) | 4,000(2,550-6,667) | 8,333(5,000-13,000) | Z = -4.918***(0.000) |
| Duration of illness (year) | 8 (4-14.5) | 8.5 (4-14.5) | 8 (3-15) | Z = -0.297(0.766) | 8 (4-14.5) | 10 (4-15) | Z = -0.431(0.667) |
| Level of fasting plasma glucose (mg/dl) | 144(121.3-184) | 142.5(123.8-194.3) | 144(120-182.3) | Z = -0.239(0.811) | 149(121.5-187) | 141(120-180) | Z = -0.761(0.447) |
Most of the participants with a high education were men (?2 = 21.225, p < 0.000), and their average income/month was higher (Z = -4.918, p < 0.000). The participants with a high education evaluated their family incomes as more adequate (?2 = 4.673, p = 0.031) than the low-education group. Regarding illness-related information, most of the high-education participants utilized other preferential treatments (?2 = 19.343, p < 0.000) at other public and private hospitals (?2 = 6.670, p = 0.036) than the low-education group.
Illness perception
The participants in both the low-income and low-education groups perceived that T2D had greater negative effects on their lives and their finances than the participants in the high-income and in the high-education groups (consequences subscale: low-income Z = -2.170, p = 0.030; low-education Z = -3.626, p < 0.000). The participants in the high-income and high-education groups perceived more confidence in controlling diabetes by themselves (personal control subscale: high-income Z = -2.768, p = 0.006; high-education Z = -3.688, p < 0.000), and more often felt confidence in the treatment given (treatment control subscale: high-income Z = -1.993, p = 0.046; high-education Z = -2.594, p = 0.009) (Table 2). Additionally, the participants in the high-education group showed more understanding of their conditions than the low-education group (illness coherence subscale: Z = -2.124, p = 0.034), and the low-education group perceived more fluctuating symptoms than the high-income group (fluctuating symptoms subscale: Z = -2.604, p = 0.009) (Table 2).
| Subscales | Range | Total (n = 220) Mean (SD) | Low-Income (n = 58) Mean (SD) | High-Income (n = 162)Mean (SD) | Mann-Whitney U test (p-value) | Low-Education (n = 173)Mean (SD) | High-Education (n = 47)Mean (SD) | Mann-Whitney U test (p-value) |
| Acute or chronic condition | 5-30 | 24.53 (3.83) | 24.90 (3.83) | 24.40 (3.83) | Z = -1.437(0.151) | 24.42 (3.75) | 24.96 (4.11) | Z = -1.268(0.205) |
| Consequences | 5-30 | 13.45 (3.88) | 14.36 (3.95) | 13.12 (3.82) | Z = -2.170*(0.030) | 13.94 (3.94) | 11.66 (3.10) | Z = -3.626***(0.000) |
| Personal control | 5-30 | 24.94 (2.71) | 24.05 (2.72) | 25.26 (2.65) | Z = -2.768**(0.006) | 24.60 (2.58) | 26.21 (2.84) | Z = -3.688***(0.000) |
| Treatment control | 5-25 | 19.16 (2.52) | 18.60 (2.49) | 19.36 (2.51) | Z = -1.993*(0.046) | 18.92 (2.52) | 20.02 (2.36) | Z = -2.594**(0.009) |
| Illness coherence | 5-25 | 17.88 (3.43) | 17.29 (3.45) | 18.09 (3.41) | Z = -1.481(0.139) | 17.59 (3.56) | 18.94 (2.67) | Z = -2.124*(0.034) |
| Fluctuating symptoms | 5-20 | 9.83 (2.82) | 9.88 (2.37) | 9.81 (2.97) | Z = -0.476(0.634) | 10.07 (2.73) | 8.96 (2.99) | Z = -2.604**(0.009) |
| Emotional representation | 5-30 | 11.02 (5.16) | 10.98 (5.27) | 11.04 (5.13) | Z = -0.024(0.981) | 11.35 (5.23) | 9.83 (4.76) | Z = -1.784(0.074) |
Self-management
| Scale scores | Total(n = 220)Mean (SD) | Low-Income(n = 58)Mean (SD) | High-Income (n = 162)Mean (SD) | Statistical Tests(p-value) | Low-Education (n = 173)Mean (SD) | High-Education (n = 47)Mean (SD) | Statistical tests(p-value) |
| Sum scale | 7.11(1.24) | 6.94(1.37) | 7.17 (1.19) | t = -1.200(0.231) | 7.02 (1.25) | 7.46 (1.18) | t = -2.172*(0.031) |
| Subscale | |||||||
| Glucose management | 6.80(1.29) | 6.60(1.31) | 6.87 (1.28) | Z = -1.430(0.153) | 6.74 (1.27) | 6.70 (1.34) | Z = -1.400(0.162) |
| Diet control | 7.34(1.86) | 7.13(1.94) | 7.41 (1.83) | Z = -0.981(0.327) | 7.21 (1.90) | 7.79 (1.65) | Z = -1.790(0.073) |
| Physical activity | 7.13(2.18) | 6.99(2.42) | 7.17 (2.10) | Z = -0.254(0.799) | 6.90 (2.14) | 7.94 (2.16) | Z = -3.057**(0.002) |
| Healthcare use | 7.97(1.34) | 7.82(1.42) | 8.03 (1.31) | Z = -1.029(0.303) | 7.94 (1.37) | 8.09 (1.22) |
Z = -0.539(0.590) |
Influences of socioeconomic status on illness perception and self-management
| Illness Perception | Self-management | |||||
| OR | 95% CI | p-value | OR | 95% CI | p-value | |
| Educational level(High-education) | 1.062 | 0.528-2.136 | 0.866 | 2.047 | 1.014-4.131 | 0. 046* |
| Occupation(Employed) | 1.518 | 0.881-2.618 | 0.133 | 1.098 | 0.637-1.891 | 0.737 |
| Estimated average income/month/person | 1.000 | 1.000-1.000 | 0.523 | 1.000 | 1.000-1.000 | 0.777 |
| Adequacy of family income(Adequate) | 0.558 | 0.288-1.081 | 0.084 | 1.080 | 0.558-2.090 | 0.820 |
DISCUSSION
For the Thai people living with T2D, socioeconomic status as defined by income and educational level had partly effects on their illness perception and self-management. No socioeconomic factor examined could predict illness perception, while educational level was shown to be a predictor of self-management.
That the level of education showed more visible effects on illness perception and self-management, and could predict effective self-management strategies, while income showed no such relationships, may imply that education is an important socioeconomic factor for people with type 2 diabetes in Thailand. Education has earlier been found to be a mediator between income and general health in a cohort study [39], indicating that education is a basic component of socioeconomic status. This finding also correspond with a literature review of Telfair and Shelton [40], which suggested a direct association of education with financial status and future opportunities for earning income.
The participants in the high-income and high-education groups, showing a greater confidence in controlling their diabetes, and the participants in high-education group earning significantly more income, might also emphasize the importance of education in a population of T2D. As earlier research has described, education is considered a factor in enhancing one’s sense of control [41,42], which may help people control their lives and engage in healthy lifestyles [41]. The more educated people with diabetes may have higher skills to search for healthcare resources and gain adequate health information, which may assist them in feeling confident in controlling their disease and in achieving effective self-management, as the results in this study revealed. As education improves a person’s ability to achieve and gain comprehension of health knowledge [43], it may also have enhanced the participants’ ability to understand their conditions. Furthermore, an increased ability to seek health care resources may offer those persons opportunities to access high levels of healthcare services apart from the HPH, which usually provide diabetes educational sessions. Moreover, gaining diabetes-specific knowledge has in a previous study been found to improve dietary and glycemic control [44,45]. On the other hand, unawareness regarding diabetes prevention has earlier been shown to lead to complications, resulting in economic hardship and inadequate ability to manage diabetes [25]. As mentioned, we might assume that the participants with a low education had some barriers in performing activities that could have been helpful for their diabetes and which made them experience more negative consequences, including finances and fluctuating symptoms, than the participants with a higher education.
In contrast to western studies [9,19,46], this study showed the limited effects of socioeconomic factors, especially in terms of income, on the perceptions and self-management of people living with diabetes. These findings may be related to Thai social values and beliefs, influenced by the philosophy of sufficiency economy developed by the king of Thailand and Buddhist beliefs. The sufficiency economy blends the Eastern value of having a holistic view of life and the notion of the middle path in Buddhist teaching in order to achieve a balanced and sustainable life with contentment [47]. Abiding by this concept may be able to lead the participants to understand their lives as a whole (including body, mind, and sociocultural aspects) and seek a proper way to adjust their life consistent with their limited resources. They may also utilize optimal facilities from their social networks and perform moderate and reasonable actions based on knowledge used with consideration, moral values, and social norms. Findings in accordance with research [48] demonstrating that adherence to health behavior is influenced not only by information but also by multiple socioeconomic, emotional, and cultural factors, i.e., motivation, support, and level of education. As found in earlier research on T2D populations, Thai family members were an important part of the social network providing various support, especially financial support, an aspect which is typical and relies on Thai social norms [27,49]. Moreover, the notion of the middle path, meaning being moderate in one’s actions in order to attain optimal and realistic goals [50], may encourage the participants to be aware of harmful food and eat in moderation in order to keep their lives in balance and with satisfaction when living with the disease.
Additionally, the way that Buddhist beliefs influence people’s thinking and behavior and are involved in their perceptions and self-management has earlier been shown among Thai people with diabetes [28,29] Understanding the fact that life goes on as the law of nature may lead the participants to view their life with diabetes and a low socioeconomic status as the way it is, and to realize that they cannot go against the law of nature. Furthermore, the Buddhist law of karma, which explains the occurrences in this life resulting from intended action in the past or in one’s current life [50], may influence the participants to accept their diabetes in this current life as an unavoidable situation. Realizing these Buddhist notions will enable the participants to accept their destiny and seek how to live happily with their situation, as corresponded to an earlier study of Thai people with diabetes [29]. Hence, the participants could leave their vulnerable conditions-diabetes and socioeconomic status-in the background and decide to do their best by taking responsibility to perform self-care activities suggested by the healthcare providers.
STRENGTHS AND LIMITATIONS
Strengths
The participants in this study could be both literate and illiterate, hence gathering data using a structured interview provided an equal chance for all of them to partake in this study. An additional strength was the skilled interviewers, who had experienced more than 10 years in interviewing people in a community, and were additionally trained and supervised during the data-gathering process. Furthermore, the Thai version of the questionnaires used in this study was investigated for validity and reliability and demonstrated good psychometric properties [52].
Limitations
The results found by using the IPQ-R diabetic version and DSMQ-R instruments may only be generalized to non-insulin-treated people with T2D because the number of insulin-treated participants in this study was too small, only 16 persons. In addition, the three items regarding the Self-Monitoring of Blood Glucose levels (SMBG) may not be suitable for the Thai context because the SMBG practice is not commonly used for checking plasma glucose level in Thai populations with T2D. Furthermore, because the interviews were conducted during the daytime, we lost one-fifth of the conceivable participants occupied at work, which would have provided additional information.
CONCLUSION
This study focused on the influences of socioeconomic status, especially income and educational level, on the illness perception and self-management of Thai people with T2D. Socioeconomic status showed some relationship with illness perception and self-management. Furthermore, education was seen to be more influential than income and was shown to be a predictor of self-management. The results suggest that more effort should be put into proactive care to assist adults with T2D with low socioeconomic status in order to improve their lifestyle habits and disease management. It may also be important for healthcare professional to be aware of the relationship between the patients’ educational level and their illness perception and self-management when planning self-care activities and designing proper interventions for Thai population with diabetes. Supporting people to undertake behavioral change is not simple and ideally, and the challenge goes beyond the healthcare system across many different sectors-education providers, non-governmental organizations, the food industry, the media, urban planners and politicians.
ACKNOWLEDGEMENT
This study supported by Malmö University, Sweden, and by Rangsit University, Thailand. In particular, we wish to thank the directors of the sampled Health Promoting Hospitals and the Village Health Volunteers working in the catchment areas for their immense support during the data collection phase. We appreciate the recommendations of Asst. Prof. Dr. Wirin Kittipichai regarding the statistical analysis.
COMPETING INTEREST
The authors declare they have no competing interests.
REFERENCES
- Guariguata L, Whiting DR, Hambleton I, Beagley J, Linnenkamp U, et al. (2014) Global estimates of diabetes prevalence for 2013 and projections for 2035. Diabetes Res Clin Pract 103: 137-149.
- Scobie IN, Samaras K (2012) Fast facts?: Diabetes mellitus, (4th edn), Health Press, Oxford, England, United Kingdom.
- World Health Organization (2015) Diabetes. Media centre, World Health Organization, Genevea, Switzerland.
- Thonghong A, Thepsittha K, Jongpiriyaanan P, Gappbirom T (2013) Chronic disease surveillance report 2012. Wkly Epidemiol Surveill Report, Thailand 44: 800-808.
- Schwarz, PE, Riemenschneider, H (2016) Slowing down the progression of type 2 diabetes: We need fair, innovative, and disruptive action on environmental and policy levels. Diabetes Care 39 suppl 2: S121-6.
- Hwang J, Shon C (2014) Relationship between socioeconomic status and type 2 diabetes: Results from Korea National Health and Nutrition Examination Survey (KNHANES) 2010-2012. BMJ Open 4: 005710.
- Tang M, Chen Y, Krewski D (2003) Gender-related differences in the association between socioeconomic status and self-reported diabetes. Int J Epidemiol 32: 381-385.
- Elgart JF, Caporale JE, Asteazaran S, De La Fuente JL, Camilluci C, et al. (2014) Association between socioeconomic status, type 2 diabetes and its chronic complications in Argentina. Diabetes Res Clin Pr 104: 241-247.
- Beryl Pilkington F, Daiski I, Bryant T, Dinca-panaitescu M, Dinca-panaitescu S, et al. (2010) The experience of living with diabetes for low-income Canadians. Can J Diabetes 34: 119-126.
- Saydah SH, Imperatore G, Beckles GL (2013) Socioeconomic status and mortality: Contribution of health care access and psychological distress among U.S. adults with diagnosed diabetes. Diabetes Care 36: 49-55.
- Collins MM, Corcoran P, Perry IJ (2009) Anxiety and depression symptoms in patients with diabetes. Diabet Med 26: 153-161.
- Moss-Morris R, Weinman J, Petrie KJ, Horne R, Cameron LD, et al. (2002) The revised illness perception questionnaire (IPQ-R). Psychol Heal 17: 1-16.
- Abraham AM, Sudhir PM, Philip M, Bantwal G (2015) Illness perceptions and perceived barriers to self-care in patients with type 2 diabetes mellitus: An exploratory study form India. Int J Diabetes Dev Ctries 35: 137-44.
- Thomas J, Jones G, Scarinci I, Brantley P (2003) A descriptive and comparative study of the prevalence of depressive and anxiety disorders in low-income adults with type 2 diabetes and other chronic illnesses. Diabetes Care 26: 2311-2317.
- Pandit AU, Bailey SC, Curtis LM, Seligman HK, Davis TC, et al. (2014) Disease-related distress, self-care and clinical outcomes among low-income patients with diabetes. J Epidemiol Community Health 68: 557-564.
- Hernandez R, Ruggiero L, Riley BB, Wang Y, Chavez N, et al. (2014) Correlates of self-care in low-income African American and Latino patients with diabetes. Health Psychol 33: 597-607.
- Richard AA, Shea K (2011) Delineation of Self-Care and Associated Concepts. J Nurs Scholarsh 43: 255-264.
- Lautenschlager L, Smith C (2006) Low-income American Indians’ perceptions of diabetes. J Nutr Educ Behav 38: 307-315.
- O’Neil A, Williams ED, Browne JL, Horne R, Pouwer F, et al. (2014) Associations between economic hardship and markers of self-management in adults with type 2 diabetes: Results from Diabetes MILES - Australia. Aust N Z J Public Heal 8: 466-472.
- Vest BM, Kahn LS, Danzo A, Tumiel-Berhalter L, Schuster RC, et al. (2013) Diabetes self-management in a low-income population: Impacts of social support and relationships with the health care system. Chronic Illn 9: 145-155.
- Bihan H, Laurent S, Sass C, Nguyen G, Huot C (2005) Association among individual deprivation, glycemic control, and diabetes complications: The EPICES score. Diabetes Care 28: 2680-2685.
- Lynch EB, Fernandez A, Lighthouse N, Mendenhall E, Jacobs E et al. (2012) Concepts of diabetes self-management in Mexican American and African American low-income patients with diabetes. Health Educ Res 27: 814-824.
- Sudchada P, Khom-Ar-Wut C, Eaimsongchram A, Katemut S, Kunmaturos P, et al. (2012) Diabetes and cardiovascular risk factor controls in Thai type 2 diabetes with no history of cardiovascular complications; Situation and compliance to diabetes management guideline in Thailand. J Diabetes Complications 26: 102-106.
- Nwasuruba C, Khan M, Egede LE (2007) Racial/Ethnic differences in multiple self-care behaviors in adults with diabetes. J Gen Intern Med 22: 115-120.
- Shrivastava U, Misra A, Gupta R, Viswanathan V (2016) Socio-economic factors relating to diabetes and its management in India. J Diabetes 8: 12-23.
- Ricci-Cabello I, Ruiz-Pérez I, Olry de Labry-Lima A, Márquez-Calderón S (2010) Do social inequalities exist in terms of the prevention, diagnosis, treatment, control and monitoring of diabetes? A systematic review. Health Soc Care Community 18: 572-587.
- Lundberg PC, Thrakul S (2012) Type 2 diabetes: How do Thai Buddhist people with diabetes practise self-management? J Adv Nurs 68: 550-558.
- Lundberg PC, Thrakul S (2013) Religion and self-management of Thai Buddhist and Muslim women with type 2 diabetes. J Clin Nurs 22: 1907-1916.
- Sowattanangoon N, Kotchabhakdi N, Petrie KJ (2009) The influence of Thai culture on diabetes perceptions and management. Diabetes Res Clin Pract 84: 245-251.
- Pathum Thani Provincial Health Office (2013) Revised version of the development plan for 4 years (2015-2018).
- Ministry of the Interior (2014) Report of the quality of life of Thai people.
- Sedgwick P (2015) Multistage sampling. BMJ 351: 4155.
- Naing NN (2003) Determination of sample size. Malays J Med Sci 10: 84-86.
- Schmitt A, Gahr A, Hermanns N, Kulzer B, Huber J, et al. (2013) The Diabetes Self-Management Questionnaire (DSMQ): development and evaluation of an instrument to assess diabetes self-care activities associated with glycaemic control. Health Qual Life Outcomes 11-138.
- IBM (2012) SPSS statistics for Windows, version 21.0. IBM corp, Armonk, New York, USA.
- National Statistical Office in Thailand (2016) Poverty line (expenditure) by region and province: 2004-2014.
- Kellar SP, Kelvin EA (2013) Munro’s statistical methods for health care research (6thedn), Wolters, Kluwer/Lippincott Williams and Wilkins, Philadelphia, USA.
- Lawrence DJ (2007) The four principles of biomedical ethics: A foundation for current bioethical debate. J Chiropr Humanit 14: 34-40.
- Lynch SM (2006) Explaining life course and cohort variation in the relationship between education and health: the role of income. J Health Soc Behav 47: 324-338.
- Telfair J, Shelton TL (2012) Educational attainment as a social determinant of health. N C Med J 73: 358-365.
- Mirowsky J, Ross CE (1998) Education, personal control, lifestyle and health: A human capital hypothesis. Res Aging 20: 415-449.
- Slagsvold B, Sørensen A (2008) Age, education, and the gender gap in the sense of control. Int J Aging Hum Dev 67: 25-42.
- Kim SR, Han K, Choi JY, Ersek J, Liu J, et al. (2015) Age- and sex-specific relationships between household income, education, and diabetes mellitus in Korean adults: The Korea national health and nutrition examination survey, 2008-2010. PLoS One 10: 0117034.
- Al-Qazaz HK, Sulaiman SA, Hassali MA, Shafie AA, Sundram S, et al. (2011) Diabetes knowledge, medication adherence and glycemic control among patients with type 2 diabetes. Int J Clin Pharm 33: 1028-1035.
- Abubakari AR, Jones MC, Lauder W, Kirk A, Anderson J, et al. (2013) Ethnic differences and socio-demographic predictors of illness perceptions, self-management, and metabolic control of type 2 diabetes. Int J Gen Med 6: 617-628.
- Clark ML, Utz SW (2014) Social determinants of type 2 diabetes and health in the United States. World J Diabetes 5: 296-304.
- Thai National Economic and Social Development Board. An introductory note sufficiency economy.
- Lindström J, Neumann A, Sheppard KE, Gilis-Januszewska A, Greaves CJ, et al. (2010) Take action to prevent diabetes--the IMAGE toolkit for the prevention of type 2 diabetes in Europe. Horm Metab Res 42: 37-55.
- Boonsatean W, Dychawy Rosner I, Carlsson A, Östman M (2015) Women of low socioeconomic status living with diabetes: Becoming adept at handling a disease. SAGE Open Med 3.
- Phromtha S (1999) Buddha pratchaya: Manut somgkom lae panha jariyatham [Buddhism philosophy: Human being, social, and morality problem]. Chulalongkorn University Press, Bangkok, Thailand.
- Polit DF, Beck CT (2010) Essentials of nursing research appraising evidence for nursing practice (7th edn) Lippincott Williams & Wilkins, Philadelphia, USA.
- Boonsatean W, Östman M, Dychawy Rosner I, Carlsson A (2016) Illness perception and self-management among Thai women and men living with type 2 diabetes (Unpublished Article).
Citation: Boonsatean W, Dychawy Rosner I, Carlsson A, Östman M (2016) The Influences of Income and Education on the Illness Perception and Self-Management of Thai Adults with Type 2 Diabetes. J Diabetes Metab Disord 3: 017.
Copyright: © 2016 Wimonrut Boonsatean, et al. This is an open-access article distributed under the terms of the Creative Commons Attribution License, which permits unrestricted use, distribution, and reproduction in any medium, provided the original author and source are credited.