Evaluation of the Components within Electronic Cigarette Liquids and Drugs of Abuse Using Gas Chromatography-Mass Spectrometry
*Corresponding Author(s):
Erin WalshMiami Dade County Medical Examiner Department, Toxicology Laboratory, United States
Tel:+1 3055475729,
Email:ewalsh@miamidade.gov
Abstract
Introduction: As electronic cigarettes become more prevalent in society, their use as a delivery mechanism for drugs of abuse has increased. Electronic cigarette liquids present a complex matrix due to the lack of regulation in their manufacturing. Due to limited published data development of new analytical methods was deemed necessary.
Methods: A Gas Chromatography-Mass Spectrometry (GC/MS) method was developed to identify flavorants of the electronic cigarette liquids as well as identify and quantify nicotine and common drugs of abuse used with these devices. Five drugs of abuse were investigated: methamphetamine, heroin, cocaine and fentanyl. Electronic cigarette liquids from five manufacturers were sampled and five “flavors” of liquids from each were analyzed. Each liquid “flavor” was tested at the manufactures reported nicotine concentrations of 0 mg/mL, 12 mg/mL and 24 mg/mL (n=75). Liquid-liquid extraction was performed on all samples prior to analysis by GC/MS. Analysis was performed in replicates of five to identify the electronic cigarette liquid components as well as quantify nicotine and the four analytes of interest. For any electronic cigarette liquid labeled as containing 0 mg/mL of nicotine in which nicotine was identified the sample was analyzed by GC/MS to quantify the nicotine level. These concentrations were compared to the naturally occurring levels of nicotine found in certain food products.
Results/Conclusions: Identification of flavorants including those not approved for human inhalation, of the electronic cigarette liquids as well as the quantification of nicotine and the four commonly abused drugs was accomplished using GC/MS. Fourteen out of 25 e-liquids labeled by the manufacturer as containing 0 mg/mL of nicotine contained statistically significant levels of nicotine. Quantification of drugs of abuse were affected by matrix components and found to be dependent on both the specific e-liquid being used with the electronic cigarette as well as the analyte being investigated.
Keywords
INTRODUCTION
Electronic cigarettes, also known as Electronic Nicotine Delivery Systems (ENDS) or simply e-cigarettes are battery-operated inhalers that deliver nicotine to the user without the harmful combustion reactions of traditional tobacco cigarettes. There is no standard construction of e-cigarettes which allows different manufacturers to use different designs and components for their particular products [1].
One of the most variable components of e-cigarettes are the electronic cigarette liquids which are commonly known as “e-liquids”. E-liquids contain propylene glycol, vegetable glycerin, nicotine and flavorants however the exact chemical make-up varies widely based on the manufacturer [2]. Manufacturers use different chemical combinations to produce specific flavors with ingredient lists often lacking all of the components if included at all with the user not knowing what they are inhaling. Although several of the chemicals used in the e-liquid flavorings have been approved for use in the food industry the effects of using these chemicals by heating and inhalation have not been studied at length [2].
Prior to 2016, e-cigarettes and e-liquids were not regulated by the FDA unless they were labeled as being for therapeutic use. However, in May 2016 the FDA published a rule that would regulate e-cigarettes and their components which includes e-liquids the same way that other tobacco products are regulated. The final rule went into effect on August 8, 2016. Some of the new regulations include prohibiting vending machine sales to minors prohibiting providing free samples to consumers and requiring packaging to carry warning labels [3].
As electronic cigarettes grow in popularity they are increasingly being used as drug delivery mechanisms by users and discussed on internet forum pages such as Drugs-Forum, Bluelight and Reddit [4-10]. Many users state that they use e-cigarettes to abuse various drugs because they are able to use these devices in public places without suspicion [4,8,9]. Users have also stated that they favor using e-cigarettes as a drug delivery mechanism because it provides them with a desirable high without the need to inject the drug they are abusing [7,8]. To date the drugs that users have reported success in abusing via e-cigarettes include methamphetamine, cocaine, fentanyl, heroin and synthetic cannabinoids [11-16].
The objective of this research was to determine the components of e-liquids obtained from several different manufacturers and to determine if drugs of abuse that have been added to e-liquids could be detected using Gas Chromatography-Mass Spectrometry (GC/MS). In addition the nicotine concentration reported by the manufacturers was evaluated. Qualitative and quantitative methods have been developed for the analysis of these samples.
EXPERIMENTAL
Materials
The e-liquid samples (Table 1) were purchased from VaporFi® (Miami Lakes, FL, USA), Mt. Baker Vapor©(Lynden, WA, USA), Crazy Vapors© (Augusta, GA, USA), Viking Vapor<© (Ben Lomond, CA, USA) and ProVape© (Monroe, WA, USA). The e-liquid samples purchased for analysis were chosen to allow for as much consistency across manufacturers as possible. To facilitate this specific flavors of e-liquids chosen from each manufacturer fell into five different “flavor categories”. These included tobacco, menthol, blueberry, vanilla, and chocolate. Three e-liquids from each flavor category were purchased from each manufacturer to evaluate a range of nicotine concentrations (0-24 mg/mL). Table 1 shows the specific e-liquids purchased from each manufacturer with a total of 75 different e-liquid matrices evaluated.
GC/MS instrumentation/parameters
The GC/MS parameters were optimized for the detection and quantitation of fentanyl, nicotine, methamphetamine, cocaine and heroin. A RestekRxi®-5HT (Bellefonte, PA, USA) column (30 m x 0.25 mm x 0.25 μm) was used for analysis. A split less injection was used with an injection volume of 1 μL an inlet temperature of 250ºC and a flow rate of 1.3 mL/minute (min). The oven was held at an initial temperature of 60ºC for two minutes, increased to 240ºC at a rate of 30ºC/min and then held for two minutes increased to 300ºC at a rate of 15ºC/min and held for one minute for a total run time of 15 minutes. The MS was operated in scan mode, using electron ionization, a solvent delay of four minutes, a MS quadrupole temperature of 230ºC, and a MS source temperature of 150ºC.
Extraction method
When the goal of analysis was to quantify drugs of abuse 100 μL of e-liquid matrix was pipetted into a disposable glass tube and then spiked with a working stock solution. The working stock solution was prepared from standards of fentanyl, methamphetamine, heroin and cocaine in methanol at a concentration of 100 μg/mL. This spiked sample was then extracted by adding 1 mL of DDW, 30 μL of 2% Sodium Carbonate (Na2CO3) and 1.5 mL of chloroform. This sample was then vortexed for ten seconds and 1 mL of the chloroform layer was pipetted into an auto sampler vial for analysis by GC/MS.
Method validation
| 0 mg/mL Nicotine Content | 12 mg/mL Nicotine Content | 24 mg/mL Nicotine Content | |
| VaporFi® | Classic Tobacco | Classic Tobacco | Classic Tobacco |
| Menthol Ice | Menthol Ice | Menthol Ice | |
| Blueberry Blast | Blueberry Blast | Blueberry Blast | |
| Very Vanilla | Very Vanilla | Very Vanilla | |
| Chocolate Delight | Chocolate Delight | Chocolate Delight | |
| Mt. Baker Vapor© | East Coast Tobacco | East Coast Tobacco | East Coast Tobacco |
| Menthol | Menthol | Menthol | |
| Blueberry | Blueberry | Blueberry | |
| French Vanilla | French Vanilla | French Vanilla | |
| Cookie Blaster | Cookie Blaster | Cookie Blaster | |
| Crazy Vapors© | Cured Tobacco | Cured Tobacco | Cured Tobacco |
| Menthol | Menthol | Menthol | |
| Blueberry | Blueberry | Blueberry | |
| French Vanilla | French Vanilla | French Vanilla | |
| Double Chocolate | Double Chocolate | Double Chocolate | |
| Viking Vapors© | Tobacco | Tobacco | Tobacco |
| Menthol Tobacco | Menthol Tobacco | Menthol Tobacco | |
| Blueberry | Blueberry | Blueberry | |
| Vanilla | Vanilla | Vanilla | |
| Chocolate | Chocolate | Chocolate | |
| ProVape© | Ken’s Tobacco | Ken’s Tobacco | Ken’s Tobacco |
| Icy Menthol | Icy Menthol | Icy Menthol | |
| Frosted Blueberry | Frosted Blueberry | Frosted Blueberry | |
| Simply Vanilla | Simply Vanilla | Simply Vanilla | |
| Chocolate | Chocolate | Chocolate |
RESULTS
Qualitative results
| E-liquid Sample | Flavorant Compounds |
| VaporFi® Classic Tobacco | Cinnamic acid, methylester; β-damascone |
| Mt. Baker Vapor© East Coast Tobacco | Trimethylpyrazine; tetramethylpyrazine; menthol; β-citronellol; guaniol |
| Crazy Vapors© Cured Tobacco | Trimethylpyrazine; tetramethylpyrazine; gluethimide |
| Viking Vapor Tobacco | Piperonal |
| Pro Vape© Ken’s Tobacco | Benzophenone; Tetramethylpyrazine; Menthol; Guaniol; Cinnamaldehyde |
Quantitative results
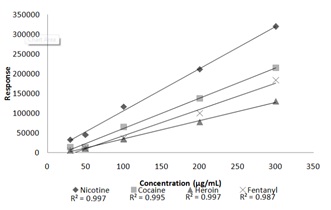
The accuracy of the “unknown” samples was determined by comparing the calculated concentration of each analyte to the target concentration of 150 μg/mL. The concentrated values determined to be greater than ±20% was considered to be inaccurate. The results of the accuracy calculations can be seen in table 7.
Twenty-five of the 75 e-liquid samples analyzed were stated by manufacturers to contain 0 mg/mL of nicotine. Of those 25 samples, only six contained no detectable nicotine five contained detectable levels of nicotine that fell below the LOQ and 14 contained detectable and quantifiable concentrations of nicotine. A t-test was conducted to determine if there was a statistical difference between the levels of nicotine in the 14 e-liquid sample compared to food products naturally containing nicotine (e.g. eggplant). A mean concentration of 0.1 µg/mL was found in eggplant samples and was used in the t-test calculations [17].
DISCUSSION
Liquid-liquid extractions
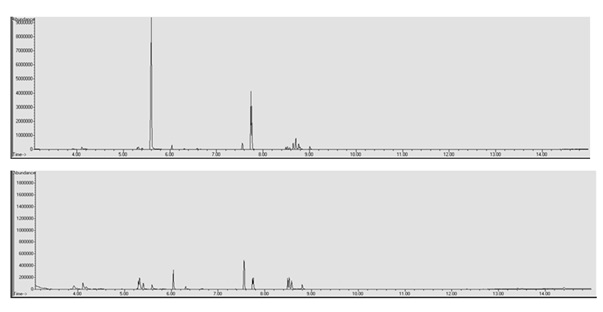
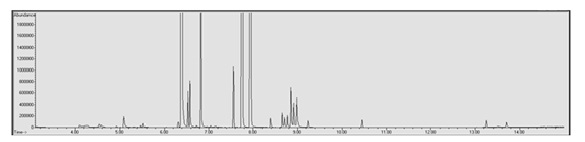
In the LLE to determine the components of the e-liquid matrices, a 10% Sodium Hydroxide (NaOH) base was used. In the LLE to quantify the drugs of abuse added to the e-liquid matrices a 2% Sodium Carbonate (Na2CO3) base was used. Two extraction methods was necessary to prevent degradation of heroin due to an overly basic pH and therefore affecting quantitation. However this resulted in two different chromatograms of the same sample (Figure 2) due to the differences in the strength of the two bases. Although two distinct chromatograms were produced it did provide additional information regarding the e-liquid matrices. The LLE utilizing 10% NaOH provided more information regarding the components of the e-liquid matrix when compared to the 2% Na2CO3. It is possible that the use of a third base may provide an even greater amount of information regarding the components than either of these two methods.
E-liquid components
| E-liquid Sample | Flavorant Compounds |
| VaporFi® Menthol Ice | Eucalyptol; Menthol |
| Mt. Baker Vapor© Menthol | Menthol |
| Crazy Vapors© Menthol | Menthol |
| Viking Vapors© Menthol Tobacco | Menthol; Piperonal; Benzyl Benzoate |
| Pro Vape© Icy Menthol | Benzyl alcohol; Menthol; Cinnamaldehyde; Benzophenone |
| E-liquid Sample | Flavorant Compounds |
| VaporFi® Blueberry Blast | Benzyl alcohol; β-linalool; menthol; cis-geraniol; β-damascenone; davanone |
| Mt. Baker Vapor© Blueberry | Benzyl alcohol; tetra methyl pyrazine; β-linalool; menthol; benzophenone |
| Crazy Vapors© Blueberry | β-linalool; cis-jasmone; glutethimide |
| Viking Vapors© Blueberry | Benzyl alcohol; β-linalool |
| ProVape© Frosted Blueberry | Benzyl alcohol; β-linalool; benzophenone |
| E-liquid Sample | Flavorant Compounds |
| VaporFi® Very Vanilla | Anethole; piperonal |
| Mt. Baker Vapor© French Vanilla | Piperonal |
| Crazy Vapors© French Vanilla | 4-methoxy-benzaldehyde |
| Viking Vapors© Vanilla | Butanoic acid; 3-methyl-3-methylbutylester (apple oil); butyl butyryl lactate; vanillin |
| Pro Vape© Simply Vanilla | Anise alcohol; vanillin; benzophenone |
| E-liquid Sample | Flavorant Compounds |
| VaporFi® Chocolate Delight | Benzyl alcohol |
| Mt. Baker Vapor© Cookie Blaster | Menthol; piperonal; benzophenone |
| Crazy Vapors© Double Chocolate | Trimethylpyrazine; benzyl alcohol; tetramethylpyrazine; glutethimide |
| Viking Vapors© Chocolate | Trimethylpyrazine; tetramethylpyrazine |
| Pro Vape© Chocolate | Trimethylpyrazine; benzyl alcohol; tetramethylpyrazine; piperonal; benzyl benzoate |
Even though there were no regulations surrounding e-liquids, some manufacturers had already removed certain flavorants that have been shown to cause damage to the airway when inhaled [22]. According to the Centers for Disease Control and Prevention (CDC) diacetyl, which is commonly used to give microwave popcorn its butter flavor has been shown to cause damage to the airways in animals during toxicology studies [22]. Diacetyl has been used in e-liquid flavors that have a creamy or buttery flavor; however, many manufacturers no longer use this flavorant and make a point to state so on their web pages.
The flavorants detected in the e-liquid matrices that are approved by the FDA still may not be safe to use as additives in e-liquids. Those flavorants were approved by the FDA for use as additives in food to be consumed orally and not necessarily by inhalation [19]. In e-cigarettes however those compounds are vaporized and inhaled and there is little published data on the effects that inhalation of those compounds has on the human body. Further research needs to be conducted involving these flavorants to determine their toxicity by vaporization and inhalation before they can be deemed safe to use in e-liquids.
In addition to detecting over 40 compounds in the e-liquid matrices tested, it was observed that there was little consistency between manufacturers. The greatest consistency between manufacturers was observed in the menthol flavor category. Menthol was detected in e-liquids from all five manufacturers in the menthol flavor category however, menthol was also detected by at least one manufacturer in the tobacco, blueberry and chocolate flavor categories (Tables 2-6). With the exception of menthol, the inconsistency in the flavorants used by different manufacturers within the same flavor category and even between different flavor categories within the same manufacturer is concerning. While complete consistency was not expected across manufacturers due to the fact that each manufacturer is attempting to produce their own unique product it further goes to show how little users know about these substances which they are inhaling.
There is also no discernable pattern for certain flavorants used by multiple manufacturers. For example, piperonal is used in four of the five different flavor categories. It is used by Viking Vapors© in their tobacco and menthol flavors but not in blueberry, vanilla or chocolate flavors. However, Mt. Baker Vapor©used piperonal in their vanilla and chocolate flavors but not in their tobacco, menthol or blueberry flavors. This lack of consistency within flavor categories and within manufacturers makes it impossible for users to determine what is actually in the product they are consuming.
Qualitative analysis of spiked samples
Another possible issue with the qualitative analysis of spiked e-liquid samples is interference from the e-liquid matrix masking drugs of abuse. In this study the retention time of methamphetamine (5.530 minutes) was very similar to both menthol (5.490 minutes) and ethyl maltol (5.587 minutes). This resulted in a lack of resolution of methamphetamine and detection until reaching a concentration of over 100 μg/mL. Figure 4 shows the methamphetamine peak in a spiked VaporFi® Very Vanilla sample. In this chromatogram it can be seen that the methamphetamine peak is just barely resolved from the ethyl maltol peak and if the baseline is zoomed in it is possible to see that the two peaks are not completely resolved.
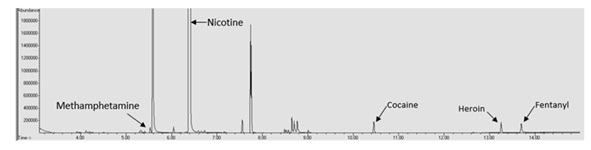
This interference issue indicates a need to further optimize the extraction technique and/or the GC/MS parameters to allow for better resolution of the peaks. This also indicates that it is possible for drugs of abuse to be present in e-liquid samples without being detected depending upon the concentration of the drug, what the drug is, and the e-liquid matrix being anlayzed.
Quantitative analysis of spiked samples
| Nicotine (mg/mL) | Cocaine (μg/mL) | Heroin (μg/mL) | Fentanyl (μg/mL) | |
| VaporFi® Classic Tobacco | 29.38-30.26 (29.98) | 134.2-142.1 (141.1) | 133.9-138.8 (135.5) | 156.0-168.1 (170.9) |
| VaporFi® Menthol Ice | 26.46-29.92 (28.38) | 119.9-138.3 (127.8) | 84.25-99.69 (90.36) | 153.2-178.8 (164.1) |
| VaporFi® Blueberry Blast | 25.67-28.54 (26.45) | 103.9-116.8 (111.2) | 126.9-145.6 (136.3) | 141.2-153.5 (149.4) |
| VaporFi® Very Vanilla | 26.23-27.56 (27.09) | 119.3-126.9 (124.1) | 122.6-132.9 (127.8) | 152.8-158.9 (155.1) |
| VaporFi® Chocolate Delight | 25.20-25.92 (25.53) | 103.9-118.5 (111.8) | 113.8-136.3 (126.3) | 147.7-154.9 (151.7) |
| Mt. Baker Vapor© East Coast Tobacco | 26.05-29.54 (26.88) | 113.8-135.2 (116.7) | 129.3-151.2 (131.3) | 151.9-165.2 (149.3) |
| Mt. Baker Vapor© Menthol | 32.24-32.65 (32.39) | 132.8-141.7 (137.5) | 111.3-126.8 (120.1) | 179.2-211.8 (199.7) |
| Mt. Baker Vapor© Blueberry | 27.43-30.25 (29.09) | 111.9-127.8 (118.8) | 101.4-114.7 (106.3) | 150.8-161.4 (156.2) |
| Mt. Baker Vapor© French Vanilla | 24.07-27.61 (26.46) | 94.46-118.6 (109.2) | 105.5-133.7 (124.4) | 120.2-151.0 (137.9) |
| Mt. Baker Vapor© Cookie Blaster | 20.39-21.78 (21.14) | 68.53-77.59 (73.33) | 71.51-83.39 (77.65) | 75.70-98.71 (87.07) |
| Crazy Vapors© Cured Tobacco | 10.82-12.01 (11.58) | 133.2-139.7 (135.1) | 121.0-126.3 (122.4) | 101.4-104.1 (102.5) |
| Crazy Vapors© Menthol | 8.33-8.53 | 102.3-112.7 (108.3) | 124.1-131.6 (128.2) | 84.58-92.57 (88.28) |
| -8.46 | ||||
| Crazy Vapors© Blueberry | 9.28-10.19 (9.59) | 133.3-144.1 (138.9) | 119.2-131.4 (125.8) | 115.6-123.6 (119.2) |
| Crazy Vapors© French Vanilla | 8.49-9.44 | 155.5-167.2 (162.1) | 177.8-184.7 (181.3) | 167.9-174.9 (171.8) |
| -9.1 | ||||
| Crazy Vapors© Double Chocolate | 9.03-10.19 (9.65) | 147.8-164.5 (156.5) | 161.3-178.6 (170.5) | 128.5-144.7 (142.9) |
| Viking Vapors© Tobacco | 11.35-12.29 (11.72) | 102.2-104.9 (103.9) | 122.7-129.3 (126.4) | 63.31-72.07 (68.19) |
| Viking Vapors© Menthol Tobacco | 12.50-13.16 (12.81) | 117.6-126.2 (120.5) | 130.4-140.8 (136.6) | 93.16-99.52 (96.51) |
| Viking Vapors© Blueberry | 12.75-13.66 (13.21) | 143.5-145.5 (143.6) | 121.2-125.5 (123.3) | 116.0-126.6 (123.3) |
| Viking Vapors© Vanilla | 12.27-13.62 (12.77) | 171.1-176.2 (174.3) | 193.7-197.9 (195.7) | 170.1-182.3 (177.1) |
| Viking Vapors© Chocolate | 13.16-14.07 (13.54) | 150.7-159.9 (154.5) | 160.6-164.9 (162.6) | 125.3-131.9 (128.3) |
| ProVape© Ken’s Tobacco | 17.61-18.20 (18.02) | 150.7-156.6 (153.8) | 138.1-145.0 (142.5) | 134.4-141.3 (138.9) |
| ProVape© Icy Menthol | 15.56-16.45 (15.95) | 152.7-158.1 (154.9) | 150.4-154.6 (151.8) | 170.8-176.3 (173.4) |
| ProVape© Frosted Blueberry | 16.39-18.15 (17.16) | 138.6-146.9 (143.9) | 117.8-136.9 (127.6) | 117.9-124.8 (120.4) |
| ProVape© Simply Vanilla | 14.86-15.18 (14.99) | 169.9-177.8 (174.6) | 177.1-192.7 (183.9) | 188.3-199.3 (194.9) |
| ProVape© Chocolate | 15.10-16.39 (15.63) | 156.3-161.9 (160.1) | 165.5-171.2 (168.1) | 100.2-104.8 (102.6) |
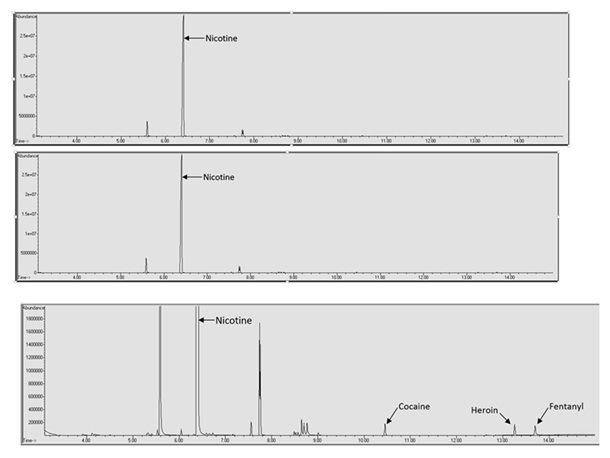
The complexity of the e-liquid matrix also appeared to have an effect on the calculated concentrations. Figure 5 shows a chromatogram of a spiked Mt. Baker Vapor© Cookie Blaster sample. The calculated concentrations for all three analytes in this matrix fell well below the actual spiked concentration of 150 μg/mL as can be seen in table 7. This is also a more complex e-liquid matrix compared to the VaporFi®Very Vanilla sample seen in figures 6 and 7 indicating that the complexity of the e-liquid matrix plays a role in the ability to quantify drugs of abuse added to e-liquids.
To calculate the amount of nicotine present in the e-liquid samples used for quantitative analysis the calibration curve needed to be extrapolated to reach the manufacturer stated 24 mg/mL to keep from saturating the column and to prevent carryover into subsequent samples. Of the 25 e-liquid samples used for quantitative analysis, 18 of the calculated nicotine concentrations fell outside of the ±20% acceptable accuracy range. Three of those 18 samples had calculated nicotine concentrations exceeding 24 mg/mL ±20% (27.43-32.65 mg/mL) and the remaining 15 samples had calculated nicotine concentrations lower than 24 mg/mL ±20% (8.33-18.20 mg/mL). The VaporFi® samples had the greatest number of matrices (four) where the calculated nicotine concentration fell within the acceptable range followed by Mt. Baker Vapor© which had three matrices fall within the acceptable range. None of the Crazy Vapors©, Viking Vapors© or ProVape© matrices fell within the acceptable accuracy range for nicotine concentration.
The nicotine concentration was also calculated for e-liquid matrices that were labeled by the manufacturer as containing 0 mg/mL of nicotine where nicotine was detected. Of the 25 e-liquid matrices labeled as containing 0 mg/mL, 19 of those contained detectable levels of nicotine and 14 of those contained quantifiable levels of nicotine (31.92-415.58 μg/mL). The calculated nicotine concentrations (range: 31.92-415.58 µg/mL, mean: 113.50 μg/mL) were then compared to levels of nicotine found naturally in vegetables belonging to the nightshade family, specifically eggplant [17]. Nicotine levels in air pollution were also considered when conducting this comparison however, the levels of nicotine calculated from air pollution fell so far below the calibration range that it was excluded from further calculations [23].
Of the 14 e-liquid matrices that contained quantifiable levels of nicotine all had statistically higher levels of nicotine than those found naturally in eggplant (0.1 µg/mL). This is an important finding because consumers who use these products are under the impression that they are using a product that contains no nicotine. More research is needed to determine if the concentration of nicotine present would have a significant effect on a consumer. However, there is a potential that the nicotine present in these samples may keep a user who is attempting to stop using nicotine products or quit smoking addicted to nicotine.
The quantitative results for nicotine in e-liquid matrices demonstrate the need for regulations of these products. In samples that were all labeled to contain 24 mg/mL of nicotine the range of actual concentrations was from 8.46-32.39 mg/mL. Also, detectable levels of nicotine were found in 76% of the matrices tested that were stated to contain 0 mg/mL of nicotine. Federal regulation of these products is necessary to protect consumers and create some consistency in what are now widely variable matrices.
CONCLUSION
Analysis by GC/MS also showed that a qualitative method for the detection of drugs of abuse in e-liquid samples is possible however certain drugs of abuse may be masked by e-liquid components of similar retention times. It may also be difficult to detect drugs of abuse in e-liquid samples containing high nicotine concentrations if the retention times or the identity of the drug(s) of abuse is not known for mass spectral library searches. A quantitative method is possible by GC/MS, however the accuracy of the quantitation depends on the e-liquid matrix that is used with the drugs of abuse. The accuracy of the quantitation may also depend upon the extraction technique that is used on the e-liquids and may potentially be further optimize.
Analysis by GC/MS showed that there is little to no consistency between components of e-liquids of similar flavors between different manufacturers and that it is possible that some e-liquid matrices may contain controlled or toxic substances. Component analysis also showed that a lack of regulation can lead to detectable and quantifiable levels of nicotine being present in e-liquids that manufacturers claim contain no nicotine, as well as inaccurate levels of nicotine compared to what is being reported by the manufacture on labels.
Future studies should include additional extraction techniques that may result in better separation between the e-liquid components and the analytes of interest and development of a different analytical method allowing more complete detection and quantification of drugs of abuse without interference from flavorants present in the sample. These two areas of focus will allow for better detection and quantification of analytes such as methamphetamine and others that may co-elute with matrix components.
REFERENCES
- Cobb NK, Byron MJ, Abrams DB, Shields PG (2010) Novel Nicotine Delivery Systems and Public Health: The Rise of the “E-Cigarette.” Am J Public Health 100: 2340-2342.
- Farsalinos KE, Polosa R. (2014) Safety evaluation and risk assessment of electronic cigarettes as tobacco cigarette substitutes: a systematic review. Ther Adv Drug Saf 5: 67-86.
- Food and Drug Administration, HHS (2016) Deeming Tobacco Products To Be Subject to the Federal Food, Drug, and Cosmetic Act, as Amended by the Family Smoking Prevention and Tobacco Control Act; Restrictions on the Sale and Distribution of Tobacco Products and Required Warning Statements for Tobacco Products- Final rule. Fed Regist 81: 28973-29106.
- https://drugs-forum.com/forum/showthread.php?t=172984
- Drugs-Forum (2013) E-cigarettes and meth?. Drugs-Forum, USA.
- Bluelight (2014) Fentanyl gel and nicotine vaporizer pipe. Bluelight, USA
- Drugs (2015) Heroin e-cig update. Reddit, USA.
- http://www.bluelight.org/vb/threads/589090-using-electronic-cigarettes-to-smoke-cocaine-HCL
- https://drugs-forum.com/forum/showthread.php?t=191682
- Drugs-Forum (2009) Vaping with e-cigarette. Drugs-Forum, USA.
- Polosa R, Morjaria JB, Caponnetto P, Campagna D, Russo C, et al. (2014) Effectiveness and tolerability of electronic cigarette in real-life: a 24-month prospective observational study. Intern Emerg Med 9: 537-546.
- Vansickel AR, Eissenberg T (2013) Electronic Cigarettes: Effective Nicotine Delivery After Acute Administration. Nicotine Tob Res 15: 267-270.
- Eissenberg T (2010) Electronic nicotine delivery devices: ineffective nicotine delivery and craving suppression after acute administration. Tob Control 19: 87-88.
- Bullen C, McRobbie H, Thornley S, Glover M, Lin R, et al. (2010) Effect of an electronic nicotine delivery device (e cigarette) on desire to smoke and withdrawal, user preferences and nicotine delivery: randomised cross-over trial. Tob Control 19: 98-103.
- Pepper JK, Emery SL, Ribisl KM, Brewer NT (2014) How U.S. Adults Find Out About Electronic Cigarettes: Implications for Public Health Messages. Nicotine Tob Res 16: 1140-1144.
- Rooke C, Amos A (2014) News media representations of electronic cigarettes: an analysis of newspaper coverage in the UK and Scotland. Tob Control, UK.
- Domino EF, Hornbach E, Demana T (1993) The Nicotine Content of Common Vegetables. N Engl J Med 329: 437.
- Etter JF, Zäther E, Svensson S (2013) Analysis of refill liquids for electronic cigarettes. Addiction 108: 1671-1679.
- http://www.accessdata.fda.gov/scripts/cdrh/cfdocs/cfcfr/CFRSearch.cfm?fr=182.60
- http://www.fda.gov/NewsEvents/PublicHealthFocus/ucm172906.htm
- US Food & Drug Administration (2014) FDA proposes to extend its tobacco authority to additional tobacco products, including e-cigarettes. FDA News Release, USA.
- Hubbs AF, Goldsmith WT, Kashon ML, Frazer D, Mercer RR, et al. (2008) Respiratory Toxicologic Pathology of Inhaled Diacetyl in Sprague-Dawley Rats. Toxicol Pathol 36: 330-344.
- Yang J, Modi BV, Tamplin SA, Aghi MB, Dave PV, et al. (2015) Air Nicotine Levels in Public Places in Ahmedabad, India: Before and After Implementation of the Smoking Ban. Indian J Community Med 40: 27-32.
Citation: Walsh E, Johnson R, Tracy P, Botch-Jones S (2016) Evaluation of the Components within Electronic Cigarette Liquids and Drugs of Abuse Using Gas Chromatography-Mass Spectrometry. J Forensic Leg Investig Sci 2: 014.
Copyright: © 2016 Erin Walsh, et al. This is an open-access article distributed under the terms of the Creative Commons Attribution License, which permits unrestricted use, distribution, and reproduction in any medium, provided the original author and source are credited.