Reliability of the Greulich & Pyle Method for Bone Age Estimation in a Spanish Sample
*Corresponding Author(s):
Turbón DDepartment Of Animal Biology, Faculty Of Biology, University Of Barcelona, Barcelona, Spain
Tel:+34 934021460,
Email:turbon@ub.edu
Abstract
As an indicator of growth rate, bone age is used to determine the level of development and to predict chronological age when this is not known. The repeatability of the measurement (intra-and inter-observer) and the systematic error inherent to Bone Age (BA) estimation using the Greulich & Pyle (GPA) method has been estimated using a sample from the Spanish population. The inter-observer Lin’s concordance correlation coefficient was ρc=0.98, with a value of 0.05±0.52 for girls and 0.06±0.44 for boys (difference between observations in years), whereas the intra-observer Lin’s concordance correlation coefficient was ρc=0.99 (0.05±0.27 for girls and 0.10±0.36 for boys). The mean difference between the bone and chronological ages was 0.51±1.13 years in girls and 0.32±1.11 years in boys. Given the systematic errors with regard to the reference population, we propose the adjustment required to apply the ages calculated according to the atlas and indicate the limitations inherent to predicting chronological age when only information from the bones in the hand and wrist is used.
Keywords
INTRODUCTION
The technological, social and political upheavals of the past few years have modified lifestyles, revolutionised economies and caused the downfall of numerous companies and the emergence of many others in light of the new business opportunities created. The impetus of the so-called “Information Society” and the “Knowledge Society” is producing a globalisation of economies and markets and has intensified migratory flows in search of new opportunities. In addition, the regional instability caused by armed conflicts has caused, and is currently causing, many people to seek refuge in more stable settings [1,2]. These migratory flows have created an increasing need to estimate the chronological age of people lacking official papers or checkable documentation [3,4]. The relevance in a legal setting is that age determines the possibilities for repatriation, the scope for detention, the bodies responsible for attending asylum requests and the administrative, civil and penal procedures applicable in such situations. In addition, in the event of death, the effective lack of identification of the body has legal, civil and economic consequences for both the deceased and their family. Efforts in the ethical and health fields are directed at caring for the victims of trafficking en route and at the destination and children and adolescents living under precarious conditions [5-8].
In the absence of reliable information, the chronological age has been related to the degree of somatic development and maturity of individuals (biological age) and, specifically, bone age, dental age, morphological age (growth age) and degree of sexual maturity [9,10]. In general, the bone age is evaluated on the basis of a radio graphical examination of the bones, with the (left) hand and wrist being the most widely used. Bone maturity is determined from the degree of ossification of the bones in wrist (carpus) and the development and degree of fusion of the metacarpal bones, phalanges and distal epiphyses of the ulna and radius [11-15]. Using an Orthopantomogram (OPG) and intraoral dental X-rays, dental age evaluates the eruption status of teeth (number and groups of teeth that emerge in the oral cavity [16,17]) and the mineralisation status of the dental crowns and roots [18,19]. Morphological age is determined on the basis of physical characteristics such as height, weight and general body shape and a comparison of the results with growth curves [9,20]. The degree of sexual maturity refers to the developmental status achieved by the secondary sex characteristics and the onset of menarche in girls. Sexual maturity is also related to the general body growth acceleration observed during puberty [9]. A combination of these components (physical examination, dental examination and bone examination) is used to achieve greater accuracy and precision when estimating the chronological age. Given the correlations between these components and the suitability and possibilities offered by the different methods [21,22], the “Study Group on Forensic Age Diagnostics” (http://www.charite.de/rechtsmedizin/agfad/index.htm) has established a procedure for estimating chronological age in a forensic setting. Unusually, the protocol proposes evaluating the degree of fusion of the proximal epiphysis of the collar bone by X-ray or CT scan to determine whether an individual is older than 21 years [23-25].
A large number of methods for evaluating bone maturity (bone age) have been proposed in the literature. The Greulich and Pyle Atlas (GPA) is currently the most widely used such method due to the simplicity of its application, it’s easy accessibility, its reasonable predictive ability (the hand and wrist present numerous ossification sites) and the limited effect of radiation in this region (0.0001 to 0.1 mSV per exposure) [26]. The GPA contains a series of standard X-rays of the left hand/wrist representative of bone maturation for each age group and sex (0 to 18 years of age in girls and 0 to 19 years in boys) along with maturity indicators for the bones in the hand and the distal epiphyses of the ulna and radius. To define these references, the authors used a sample population comprising 1000 boys and girls of high social class (with no nutritional problems or diseases that could affect their growth) born in Cleveland, Ohio (USA), between 1931 and 1942. Based on European standards and descendants of Europeans, the method of Tanner and Whitehouse 3 (TW3-RUS) is also used and has been automated using image-processing techniques. TW3 is a quantitative alternative based on skeletal maturity scores for the bones in the hand and wrist [12].
Application of the GPA for determining bone age requires the standards to be fitted to each population as genetic, environmental and socioeconomic factors can all influence the degree of bone maturity and, to a large extent, explain the systematic error encountered when applied to a population other than the reference population [9,27]. The application and adjustment factors (systematic error) have been described for large number of populations: Central Europe [28]; Caucasians [29]; Malawi [30]; Taiwan [31]; Morocco [32]; Turkey [33]; Italy [34]; South Africa [35]; Pakistan [36]; Asian, African/American, Caucasian and Hispanic [37] and French [38].
In the paediatric field, an estimation of bone age is of interest as an indicator of growth rate disorders. An ability to predict possible growth delays allows progress to be made in preventive and, if required, corrective therapy. In this regard, the information provided by the bone age is usually complemented by that provided by morphological growth indicators (in absolute or relative terms). In addition, paediatric monitoring allows the evolution of these components with time to be observed and, as a result, one-off estimates to be replaced by the estimates provided by time series [39,40].
Given the above, the interest of the present study lies in evaluating the bone age and using this estimation to predict chronological age when this is not known. To ensure the reliability of such measurements we have proposed the following objectives: 1) to evaluate the measurement repeatability (inter-and intra-observer error) when determining bone age using the GPA method and ensure that the error is admissible; and 2) to evaluate the systematic error inherent to the estimation of bone age using the GPA method when applied to the Spanish population (effect of differential growth with respect to the reference American population) and to propose correction factors (correction of ages in the X-rays found in the atlas).
MATERIALS AND METHODS
Greulich and Pyle method
Statistical treatment
Evaluation of bone age using the GPA method is affected by the systematic error inherent to application of this method in different populations (differences with respect to the American reference population). Formally,
BAi(sp) = BAi(GPA) + ei(µ,σ) = µ + BAi(GPA) + ei(0,σ)
where BAi(sp) is the bone age for the study population, BAi(GPA) the bone age for the reference population (GPA) and ei(µ,σ) the random error (with an unknown distribution, mean µ (systematic error) and standard deviation σ).
As the systematic error and standard deviation may be different (the values reported in the literature demonstrate this for most populations) for each category j (age and sex class), the model can be rewritten as follows for each category:
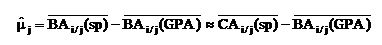
BAi/j(sp) = µj + BAi/j(GPA) +ei(0,σj)
where BAi/j(sp) and BAi/j(GPA) are the bone ages for individual i from category j for the study population and reference population respectively. In this context, the estimation of the systematic error is reduced to:
 as the mean (normal) growth is related to the mean chronological age of the study population in each category
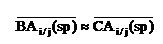 where CAi/j(sp) is the chronological age for individual i from category j).
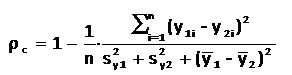
As such, the mean and standard deviation was calculated for the chronological and bone age for each sex and age group, the equality of the mean for each age was compared (Student’s t-test for paired samples), the differences between the means for the chronological and bone ages determined (systematic error estimation), the fit of the residuals to the normal distribution tested using the Shapiro-Wilks W statistic, and a correction factor for the age in the atlas radiographies (GPA) proposed. Separate Bland-Altman plots are presented for girls and boys in order to better visualise the importance and randomness of the differences in each age group [43].
The standard deviation in chronological age can be assigned to the random selection of the individuals within their age group (
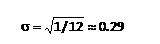 corresponds to the uniform selection in the single-year age groups). The standard deviation obtained when estimating bone age can be attributed to the intrinsic variability of the Spanish population (growth differences between individuals of the same sex and age) if the measurement error is low.
This variability in bone age is transferred to estimation of the chronological age (when this is unknown).
RESULTS
The repeatability of the measurement when the GPA method is applied presents two components: the reproducibility (inter-observer variability) and the repeatability (intra-observer variability). The repeatability of the measurement when the GPA method is applied was evaluated separately for boys and girls by two observers, who determined the bone age for the whole sample (244 girls and 245 boys). Lin’s concordance correlation coefficient was estimated to be ρc,G=0.9800 for girls and ρc,B=0.9849 for boys. The difference between observers fits a normal distribution (W=0.9936 and p=0.9943 for girls, and W=0.9836 and p=0.5538 for boys). The mean difference between observers is essentially irrelevant, at 0.0546 years (equivalent to 20 days), with a standard deviation of 0.5246 years (equivalent to 6.3 months), for girls, and 0.0633 years (equivalent to 23 days), with a standard deviation of 0.4401 years (equivalent to 5.3 months), for boys. The repeatability of the measurement when the GPA method is applied was performed using a single observer and a smaller sample (30 girls and 30 boys). Lin’s concordance correlation coefficient was estimated to be ρc,G=0.9944 for girls and ρc,B=0.9880 for boys. The mean difference between observations is essentially irrelevant, at 0.0500 years (equivalent to 18 days), with a standard deviation of 0.2739 years (equivalent to 3.3 months), for girls, and 0.1000 years (equivalent to 36 days), with a standard deviation of 0.3572 years (equivalent to 4.3 months), for boys (Figure 1).
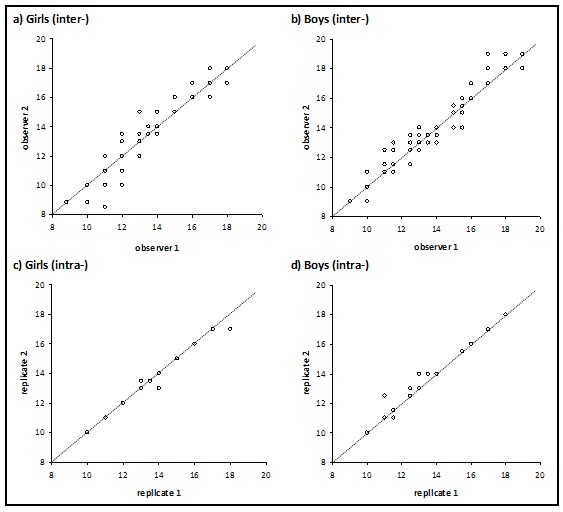 Figure 1: Comparison of the measurement of bone age: a) and b) by two observers; c) and d) with two replicates.
The systematic error when evaluating bone age for the Spanish population affects both sexes (girls and boys) significantly. These systematic errors are not uniform and vary between -0.2389 and +1.0417 years (equivalent to -2.9 and +12.5 months), for girls and -0.0750 and +0.6417 years (equivalent to -0.9 and 7.7 months), for boys (without considering the 18 years age group due to the limited sample size). Overestimations are the largest and affect individuals with chronological ages of between 11 and 16 in girls and 10-11 and 14-17 years in boys. Underestimations of bone age were not found to be significant (without considering the 18 years age group). The residuals in the model for a normal distribution (W=0.9872 and p=0.7485 for girls, and W=0.9856 and p=0.5749 for boys). Adjustment of the atlas (subtracting the systematic error) eliminates the bias (mean difference) between bone age and chronological age for all age groups and sexes (Table 1). The importance and randomness of the differences in each category (age and sex class) can be visualised using a Bland–Altman plot (Figure 2).
| Girls | Class | Size | Age (years) | Comparison of means | Systematic | ||
| age | sample | chronological | GPA | Student’s t | p-Value | error | |
| 10 | 30 | 10.5917±0.2330 | 10.6082±0.8328 | 0.1142 | 0.9099 | 0.0165±0.7916 | |
| 11 | 30 | 11.5306±0.2924 | 11.9667±1.4395 | 1.7337 | 0.0936 | 0.4361±1.3778 | |
| 12 | 30 | 12.5944±0.3169 | 13.0917±1.2568 | 2.1470 | 0.0403* | 0.4972±1.2684 | |
| 13 | 30 | 13.4500±0.2900 | 14.1583±1.9854 | 1.9817q | 0.0571 | 0.7083±1.9577 | |
| 14 | 30 | 14.5667±0.2289 | 15.6083±1.0782 | 5.2470 | <0.0001* | 1.0417±1.0874 | |
| 15 | 30 | 15.3611±0.2546 | 16.2833±0.8875 | 5.8065 | <0.0001* | 0.9222±0.8699 | |
| 16 | 30 | 16.5083±0.2865 | 17.1667±0.7232 | 4.7028 | <0.0001* | 0.6583±0.7667 | |
| 17 | 30 | 17.5389±0.2926 | 17.3000±0.7724 | -1.4619 | 0.1545 | -0.2389±0.8951 | |
| 18 | 4 | 18.4410±0.4620 | 17.8750±0.2500 | - | - | -0.5660±0.6395 | |
| Boys | 10 | 30 | 10.5083±0.2865 | 11.1500±1.0578 | 3.4830 | 0.0159* | 0.6417±1.0091 |
| 11 | 30 | 11.5667±0.2489 | 11.9917±0.6348 | 3.3023 | 0.0026* | 0.4250±0.7049 | |
| 12 | 30 | 12.5667±0.2710 | 12.4917±1.0555 | -0.4034 | 0.6896 | -0.0750±1.0184 | |
| 13 | 30 | 13.5194±0.2990 | 13.5917±0.9660 | 0.3971 | 0.6942 | 0.0722±0.9959 | |
| 14 | 30 | 14.5583±0.2682 | 14.8583±1.4528 | 1.1694 | 0.2518 | 0.3000±1.4051 | |
| 15 | 30 | 15.5028±0.3036 | 16.0750±1.4236 | 2.1647 | 0.0388* | 0.5722±1.4478 | |
| 16 | 30 | 16.5444±0.2261 | 16.7500±1.4681 | 0.7779 | 0.4429 | 0.2056±1.4476 | |
| 17 | 30 | 17.4528±0.2641 | 17.8333±0.7694 | 2.2499 | 0.0206* | 0.3806±0.8509 | |
| 18 | 5 | 18.3828±0.3369 | 17.4000±1.1937 | - | - | -0.9828±1.2018 |
Table 1: Evaluation of bone age using the GPA method: description of the sample (size, chronological age and evaluation of bone age, mean± standard deviation); comparison of means by age group (* denotes significant differences in the mean); and systematic bias in bone age estimation).
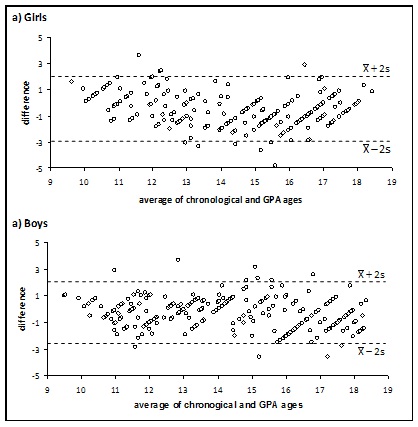 Figure 2: Bland–Altman plots for the comparison between chronological and bone age.
DISCUSSION
The values for Lin’s concordance correlation coefficient obtained for the sample of the Spanish population used in this study highlight the robustness of bone age evaluation as both the inter- and intra-observer error are low. The repeatability obtained has been related to the high ability to identify the same closest reference (X-ray in the atlas) when the GPA method is used. The value obtained in the inter-observer study (ρc=0.98: 0.0546±0.5246 years for girls and 0.0633±0.4401 years for boys) is in accordance with previous findings in the literature. Thus, the mean difference obtained is similar to that reported by Groell et al. 1999 [28] for a sample of 47 individuals from central Europe, and that reported by Lynnerup et al., [44] for a heterogeneous sample comprising 159 individuals from various geographical settings, including Vietnam, India (Asia); Russia, Belarus, Georgia, Latvia, Romania, Ukraine, Moldova, Albania (Central and Eastern Europe); Iraq, Iran, Palestine, Afghanistan (Middle East); Rwanda, Zaire, Nigeria, Guinea, Somalia, Cameroon, Sierra Leone, Burundi, Angola (Sub-Saharan Africa); Algeria, Libya (Northern Africa). Similarly, the standard deviation is similar to that reported by Groell et al., [28] but much lower than that reported by Lynnerup et al., [44]. The similarity between the variances for the differences between observations (inter- and intra-observer) suggests some degree of overlap between the two sources of error, in other words the repeatability explains the reproducibility [45]. Consequently, trained observers do not significantly increase the variability when evaluating bone age using the GPA method.
Although individual growth patterns tend to be regular, genetic, environmental and socioeconomic factors influence the bone maturation process in individuals and explain the variability between individuals in the same population [9]. When compared with a reference population (GPA, TW3,…), the difference between chronological age and bone age is due to the different influence of explanatory factors in the two populations (reference and study), temporal asynchronism (when the effect of the explanatory factors is similar) or to the combined effect of these two causes. The systematic error observed in our sample (0.5052 years in girls and 0.3153 years in boys) is higher than that for the reference population in the Atlas and for the current American population (period 1931-1942 [11]; current African-American and European-American [46]). However, our sample is in agreement with the errors described in other populations from the same region (Sweden [47]; Turkey [48]; Holland-Caucasia [29]; Italy-Caucasian [34]) but lower than that for Asian and African populations (Malawi [30]; Taiwan [31]; Morocco [32]; Pakistan [36]). The positive systematic error observed in most categories of the Spanish population can be explained by the earlier maturation in Western European countries and the USA [49] and by changes in surrounding conditions. With a temporal imbalance in the maturation rate of the two populations (Spanish and reference GPA), the different growth rates over time (prepubertal depression, pubertal spurt and deceleration) explains the non-uniform differences in the categories. In this context, minor differences were expected in the prepubertal depression phase (10-11 years in girls and 12-13 years in boys), medium to high variances in the pubertal spurt phase (11-14 years in girls and 13-16 years in boys), and a progressive decrease in differences in the deceleration phase (14-17 years in girls and 16-17 years in boys). The systematic error reflects the analogies and difference with respect to the reference population. From this perspective, the Spanish population does not differ from those in its regional geographical surroundings (Europe and the Mediterranean region). With regard to application of the method, the degree of bone maturity in individuals is related to the standard for the population itself. However, the atlas must be corrected (in the opposite sense to the systematic error) to minimise errors.
The standard deviation obtained when estimating bone age indicates the intrinsic variability of the population, in other words growth differences between individuals of the same sex and age. The pubertal spurt (accelerated growth rate due to the synergic action of growth hormone and sex steroids) explains the greater variability in bone age per category (age and sex class) and the corresponding transfer to the variability in the differences between chronological age and bone age (GPA) to a large extent. Similarly, the deceleration in growth rate explains the decrease in the variability of the bone age and the progressive transfer of this effect to the differences. This effect is clearly seen in the Spanish population, where the spurt occurs from the age of 11 years in girls and 13 years in boys, and the deceleration occurs from around 14 years in girls and 16 years in boys [50]. The intrinsic variability in bone age for the Spanish population (s=1.1100 years in girls and 1.1268 years in boys) is slightly higher than that for the corresponding American populations [11,46], similar to that for populations in the same region and some parts of Africa [29,30,35,47,48], and lower than that for Asian populations and other parts of Africa [31,32]. The variability in bone age reflects the heterogeneity of growth in the population used to define the population-based limits of normality. In this context, bone age becomes an indicator of possible growth rate disorders. In a forensic setting, bone variability is transformed into uncertainty/error when chronological age is estimated (with a probability of 0.95, the maximum error is quantified as ±1.96•s). With intermediate variability (s≈1.1 years), the results obtained for the Spanish population highlight the limitations as regard predicting the chronological age when only bone information for the hand and wrist is used.
Two actions can be taken to achieve greater reliability when predicting chronological age, namely reducing the errors in bone age estimation and adding complementary information. A reduction in the errors inherent to bone age estimation using the GPA method may be difficult as the (inter- and intra-observer) repeatability in the sample from the Spanish population is low, the systematic error has already been evaluated and the age adjusted in the atlas, and a reduction in the resolution effect (increasing the number of reference X-rays) is complex and of limited utility. The application of alternative methods based on European references also failed to provide satisfactory results. Thus, when using the TW3-RUS method, the systematic error was reduced in some cases but the variability was only reduced in very homogeneous populations: 0.5067±0.7967 in a sample of Spanish boys aged between 12 and 14 years (elite youth soccer players); 0.2250±0.7000 in a sample of German girls aged between 12 and 15 years, and 0.9000±1.0750 in a sample of German boys of the same age; 0.2060±1.060 in a sample of Turkish girls aged between 11 and 15 years, and 0.1560±1.1200 in a sample of Turkish boys of the same age [51-53]. Providing complementary information (examination of other bones, physical/anthropometric examination and/or dental examination) and directing efforts towards multivariate treatment is the path followed by the “Study Group on Forensic Age Diagnostics”. Indeed, this is probably the preferred path.
ACKNOWLEDGEMENT
We would like to thank the Diagnostic Imaging Department at the Hospital Sant Joan de Déu de Barcelona for providing us with access to the X-rays required to conduct this study. We would also like to thank the Editor and the anonymous referees, whose suggestions have allowed us to improve this paper.
REFERENCES
- Beck U (2000) What is globalization? Patrick Camiller (Eng Trans). Polity Press, Cambridge, UK.
- Weinstein MM (2005) Globalization: what's new. Columbia University Press, New York, EEUU, USA.
- Schmeling A, Olze A, Reisinger W, König M, Geserick G (2003) Statistical analysis and verification of forensic age estimation of living persons in the Institute of Legal Medicine of the Berlin University Hospital Charité. Leg Med (Tokyo) 5 Suppl 1: S367-371.
- Schmidt S, Koch B, Schulz R, Reisinger W, Schmeling A (2008) Studies in use of the Greulich-Pyle skeletal age method to assess criminal liability. Leg Med (Tokyo) 10: 190-195.
- Schmeling A, Olze A, Reisinger W, Geserick G (2001) Age estimation of living people undergoing criminal proceedings. Lancet 358: 89-90.
- Cattaneo C (2007) Forensic anthropology: developments of a classical discipline in the new millennium. Forensic Sci Int 165: 185-193.
- Hollifield M, Warner TD, Lian N, Krakow B, Jenkins JH, et al. (2002) Measuring trauma and health status in refugees: a critical review. JAMA 288: 611-621.
- Newbold B (2005) Health status and health care of immigrants in Canada: a longitudinal analysis. J Health Serv Res Policy 10: 77-83.
- Tanner JM (1990) Foetus into Man: Physical Growth from Conception to Maturity. Harvard University Press, USA.
- Bláha P, Susanne C, Rebato E (2007) Essentials of Biological Anthropology. Karolinum Press, Charles University, Prague, Czech Republic.
- Greulich WW, Pyle SI (1959) Radiographic atlas of skeletal development of the hand and wrist (2ndedn). Stanford University Press, Stanford, USA.
- Tanner JM, Healy MJ, Goldstein H, Cameron N (2001). Assessment of Skeletal Maturity and Prediction of Adult Height (TW3Method) (3rdedn), Saunders, London, UK.
- Roche AF, Chumlea WM, Thissen D (1988) Assessing the skeletal maturity of the hand-wrist: Fels method. Charles Thomas, Springfield, Illinois, USA.
- Tanner JM, Gibbons RD (1994) A computerized image analysis system for estimating Tanner-Whitehouse 2 bone age. Horm Res 42: 282-287.
- Sinclair RJG, Kitchin AH, Turner RWD (1960) The Marfan syndrome. Q J Med 29:19-46.
- Demirjian A, Goldstein H, Tanner JM (1973) A new system of dental age assessment. Hum Biol 45: 211-227.
- Nyström M, Kleemola-Kujala E, Evälahti M, Peck L, Kataja M (2001) Emergence of permanent teeth and dental age in a series of Finns. Acta Odontol Scand 59: 49-56.
- Smith BH (1991) Standards of human tooth formation and dental age assessment. In: Kelly MA, Larsen CS (eds.). Advances in dental anthropology. New York: Wiley-Liss Inc, USA.
- Khorate MM, Dinkar AD, Ahmed J (2014) Accuracy of age estimation methods from orthopantomograph in forensic odontology: a comparative study. Forensic Sci Int 234: 184.
- Ulijaszek SJ, Johnston FE, Preece MA (1998) The Cambridge Enciclopedia of Human Growth and development. Cambridge University Press, UK.
- Moraes ME, Medici EF, Moraes LC (1998) Surto de crescimento puberal. Relação entre mineralizacão dentaria, idade cronológica, idade dentaria e idade óssea-Método radiográfico. Rev Odontol UNESP 27: 111-29.
- Ritz-Timme S, Cattaneo C, Collins MJ, Waite ER, Schütz HW, et al. (2000) Age estimation: the state of the art in relation to the specific demands of forensic practise. Int J Legal Med 113: 129-136.
- Schulz R, Mühler M, Mutze S, Schmidt S, Reisinger W, et al. (2005) Studies on the time frame for ossification of the medial epiphysis of the clavicle as revealed by CT scans. Int J Legal Med 119: 142-145.
- Schmeling A, Reisinger W, Geserick G, Olze A (2006) Age estimation of unaccompanied minors. Part I. General considerations. Forensic Sci Int 159 Suppl 1: S61-64.
- Graham JP, O’Donnell CJ, Craig PJ, Walker GL, Hill AJ, et al. (2010) The application of Computerized Tomography (CT) to the dental ageing of children and adolescents. Forensic Sci Int 195: 58-62.
- Mettler FA Jr, Huda W, Yoshizumi TT, Mahesh M (2008) Effective doses in radiology and diagnostic nuclear medicine: a catalog. Radiology 248: 254-263.
- Gilsanz V, Ratib O (2005) Hand Bone Age. A Digital Atlas of Skeletal Maturity. Springer, Los Angeles, USA.
- Groell R, Lindbichler F, Riepl T, Gherra L, Roposch A, et al. (1999) The reliability of bone age determination in central European children using the Greulich and Pyle method. Br J Radiol 72: 461-464.
- van Rijn RR, Lequin MH, Robben SG, Hop WC, van Kuijk C (2001) Is the Greulich and Pyle atlas still valid for Dutch Caucasian children today? Pediatr Radiol 31: 748-752.
- Lewis CP, Lavy CB, Harrison WJ (2002) Delay in skeletal maturity in Malawian children. J Bone Joint Surg Br 84: 732-734.
- Chiang KH, Chou ASB, Yen PS, Ling CM, Lin CC, et al. (2005) The reliability of using Greulich-Pyle method to determine children's bone age in Taiwan. Tzu Chi Med J 17: 417-420.
- Garamendi PM, Landa MI, Ballesteros J, Solano MA (2005) Reliability of the methods applied to assess age minority in living subjects around 18 years old. A survey on a Moroccan origin population. Forensic Sci Int 154: 3-12.
- Büken B, Safak AA, Yazici B, Büken E, Mayda AS (2007) Is the assessment of bone age by the Greulich-Pyle method reliable at forensic age estimation for Turkish children? Forensic Sci Int 173: 146-153.
- Tisè M, Mazzarini L, Fabrizzi G, Ferrante L, Giorgetti R, et al. (2011) Applicability of Greulich and Pyle method for age assessment in forensic practice on an Italian sample. Int J Legal Med 125: 411-416.
- Dembetembe KA, Morris AG (2012) Is Greulich-Pyle age estimation applicable for determining maturation in male Africans?. S Afr J Sci 108: 1-6.
- Manzoor Mughal A, Hassan N, Ahmed A (2014) The applicability of the Greulich & Pyle Atlas for bone age assessment in primary school-going children of Karachi, Pakistan. Pak J Med Sci 30: 409-411.
- Mansourvar M, Ismail MA, Raj RG, Kareem SA, Aik S, et al. (2014) The applicability of Greulich and Pyle atlas to assess skeletal age for four ethnic groups. J Forensic Leg Med 22: 26-29.
- Zabet D, Rérolle C, Pucheux J, Telmon N, Saint-Martin P (2015) Can the Greulich and Pyle method be used on French contemporary individuals? Int J Legal Med 129: 171-177.
- Hochberg ZE (2002) Endocrine Control of Skeletal Maturation. Karger, Basel.
- Park E (1977) Radiological anthropometry of the hand in Turner’s syndrome. Am J Phys Anthropol 46: 463-470.
- Todd TW (1937) Atlas of skeletal maturation. C.V. Mosby Co, St Louis, USA.
- Lin LI (1989) A concordance correlation coefficient to evaluate reproducibility. Biometrics 45: 255-268.
- Bland JM, Altman DG (1986) Statistical methods for assessing agreement between two methods of clinical measurement. Lancet 1: 307-310.
- Bland JM, Altman DG (1986) Statistical methods for assessing agreement between two methods of clinical measurement. Lancet 1: 307–310.
- Lynnerup N, Belard E, Buch-Olsen K, Sejrsen B, Damgaard-Pedersen K (2008) Intra- and interobserver error of the Greulich-Pyle method as used on a Danish forensic sample. Forensic Sci Int 179: 242.
- Ferrante L, Cameriere R (2009) Statistical methods to assess the reliability of measurements in the procedures for forensic age estimation. Int J Legal Med 123: 277-283.
- Mora S, Boechat MI, Pietka E, Huang HK, Gilsanz V (2001) Skeletal age determinations in children of European and African descent: applicability of the Greulich and Pyle standards. Pediatr Res 50: 624-628.
- Kullman L (1995) Accuracy of two dental and one skeletal age estimation method in Swedish adolescents. Forensic Sci Int 75: 225-236.
- Koc A, Karaoglanoglu M, Erdogan M, Kosecik M, Cesur Y (2001) Assessment of bone ages: is the Greulich-Pyle method sufficient for Turkish boys? Pediatr Int 43: 662-665.
- Malina RM (1975). Growth and Development, the first twenty years. Burgess Publishing Company, USA.
- Calvo MM, Román JP (2011) Pubertad normal y sus variantes. Pediatr Integral 15: 507-518.
- Malina RM, Chamorro M, Serratosa L, Morate F (2007) TW3 and Fels skeletal ages in elite youth soccer players. Ann Hum Biol 34: 265-272.
- Schmidt S, Nitz I, Schulz R, Schmeling A (2008) Applicability of the skeletal age determination method of Tanner and Whitehouse for forensic age diagnostics. Int J Legal Med 122: 309-314.
- Buken B, Safak A, Buken E, Yazici, B, Erkol Z, Erkol Z, et al. (2010) Is the Tanner-Whitehouse (TW3) method sufficiently reliable for forensic age determination of Turkish children. Turk J Med Sci 40: 797-805.
Citation: Alcina M, Lucea A, Salicrú M, Turbón D (2015) Reliability of the Greulich & Pyle Method for Bone Age Estimation in a Spanish Sample. J Forensic Leg Investig Sci 1: 003.
Copyright: © 2015 Alcina M, et al. This is an open-access article distributed under the terms of the Creative Commons Attribution License, which permits unrestricted use, distribution, and reproduction in any medium, provided the original author and source are credited.