Validation of Low Volume, Fast PCR Amplification of STR Loci for DNA Reference Samples
*Corresponding Author(s):
Catherine C ConnonDepartment Of Forensic Science, Cellmark Forensics, A LabCorp Specialty Testing Group, Department Of Biological Sciences, University Of North Texas, Virginia Commonwealth University, Richmond, Virginia, Texas, United States
Tel:+1 8048284318,
Fax:+1 8048284983
Email:cmconnon@vcu.edu
Abstract
This project was a continuation of a previous project that examined various polymerases to assess their suitability for low volume, fast PCR amplification of forensic STR loci. The primary focus of this project is to develop multiple protocols using the product selected from the previous study (KAPA2GTM Fast Multiplex PCR Kit) along with primer sets and non-fast thermal cyclers commonly used in the forensic community in order to substantially reduce PCR time without added costs or equipment. Ultimately, 3µl fast PCR protocols were validated for the PowerPlex® 16 HS System, AmpF?STR® Identifiler® and Identifiler® Plus PCR Amplification Kit primer sets on a 384-well Veriti® thermal cycler (43-51min), as well as 5μl and 6μl Identifiler® fast reactions on a GeneAmp® PCR System 9700 thermal cycler (51min). Two-step PCR cycling utilizing a combined annealing/extension step was successfully incorporated into the fast PCR protocols for all primer sets, except PowerPlex® 16 HS. These protocols were validated for use with forensic reference-type samples, including buccal swabs or Buccal DNA CollectorsTM, based on optimal DNA input range (sensitivity, reproducibility, inter- and intra-locus peak balance, stutter, pull-up, incomplete adenylation (-A), and baseline assessment), stochastic, precision, stutter, automation, contamination, lot-to-lot variation and storage condition studies. Overall, a 56-73% reduction in amplification time was achieved compared to low volume, standard PCR amplification, along with STR profile pass rates of 95-98% (n=86-89) using these low volume, fast PCR protocols, all of which had an optimal DNA input range of 0.375-1.5ng. Higher percent stutter was observed compared to that of standard PCR, but non-specific amplification, incomplete non-template adenylation, and poor intra-locus peak balance were not problematic compared to other previous studies involving fast PCR.
Keywords
INTRODUCTION
Reducing amplification processing time has been a major focus for forensic DNA testing over the past 10 years, especially through the advent of fast PCR polymerases, direct PCR, and rapid DNA testing [1-12]. But such a reduction in processing time has often been subject to an increase in cost due to reagents and/or equipment, and/or prone to a decrease in STR profile quality. The goal of this project was to develop fast PCR protocols for a variety of primer sets commonly used in the forensic community, without having to purchase fast thermal cyclers or incur significant reagent expenses, all the while still maintaining high quality STR profiles. Utilizing low volume reactions on non-fast thermal cyclers are key to keeping costs down [13].
The first part of this project assessed four different commercially available products for their suitability with low volume, fast PCR, from which KAPA2GTM Fast Multiplex PCR Kit (KAPA2G; Kapa Biosystems Inc., Woburn, MA) demonstrated the greatest potential for success [13]. This paper focuses on the second half of the project, in which KAPA2G was successfully integrated into low volume (3-6µl), fast PCR protocols for three primer sets commonly used in the forensic community - PowerPlex® 16 HS System (PowerPlex 16 HS; Promega, Madison, WI) and AmpF?STR® Identifiler® and Identifiler® Plus PCR Amplification Kit (Identifiler and Identifiler Plus, respectively; Applied Biosystems, Foster City, CA) using two non-fast thermal cyclers - 384-well Veriti® and GeneAmp® PCR System 9700 thermal cyclers (Applied Biosystems). To ensure that high STR profile quality was maintained, profiles were evaluated using criteria established by the forensic community, including but not limited to sensitivity, reproducibility, allele concordance, allele peak height, inter- and intra-locus peak balance, stutter percentages, pull-up percentages, incomplete adenylation (-A), specificity, etc.
MATERIALS AND METHODS
For all studies, buccal swab cuttings (~¼ swab) or Buccal DNA CollectorTM punches (6mm) were obtained from a total of 294 individuals and were extracted (quarter reaction with a minimum of a one hour incubation at 56°C) using the ChargeSwitch® Forensic DNA Purification Kit (ChargeSwitch; Applied Biosystems) [14] on a BioSprint 96 (QIAGEN) or KingFisher® 96 (Thermo Scientific, Vantaa, Finland). Samples were then quantified using the Quant-iTTMPicoGreen® dsDNA Quantitation Kit coupled with the Quant-iTTMPicoGreen® dsDNA Quantitation Reagent (PicoGreen; Applied Biosystems) and a FLUOstar microplate reader (BMG LABTECH, Ortenberg, Germany). As discussed previously by Connon et al., [13], this quantification method is acceptable per FBI QAS guidelines for DNA reference samples [15,16] and was successfully utilized by the databasing unit of Cellmark Forensics from 2008-2015. Following quantification, a pre-amplification dilution was performed in order to normalize samples for amplification. Amplification is discussed in more detail below (Table 1 for reaction composition). Following amplification, amplification product was diluted with water (4μl for 3μl and 6μl reactions, and 5μl for 5μl reactions). One microliter of diluted amplification product was combined with 10μl of a formamide/size standard mixture (10μl formamide and either 0.2μl GeneScanTM 500 LIZTM [LIZ; Applied Biosystems] for Identifiler/Identifiler Plus or 0.5μl ILS 600 [Promega] for PowerPlex 16 HS) for each sample or allelic ladder. Prepared amplification product was detected using a 3130xl Genetic Analyzer (3130xl; Applied Biosystems) equipped with POP-4® (POP-4; Applied Biosystems) and a 36cm array using a 3kV, 7sec injection. All profiles were analyzed with GeneMapperTM ID v3.2 software using a 75rfu threshold. Specific analysis is discussed below. Any tests for statistical significance (t-test, one-way ANOVA or Tukey HSD [honest significant difference] [17,18]) were performed using a 5% significance level.
Optimization of Low Volume, Fast PCR Protocols using KAPA2G
5µl and 6µl Identifiler Fast PCR Protocols
| Identifiler (3μl) | Identifiler (5μl) | Identifiler (6μl) | IdentifilerPlus (3μl) | PowerPlex 16 HS (3μl) | |
| Fast PCR | 1.5µl KAPA2GTM Fast Multiplex Mix | 2.5µl KAPA2GTM Fast Multiplex Mix | 3.0µl KAPA2GTM Fast Multiplex Mix | 1.5µl KAPA2GTM Fast Multiplex Mix | 1.5µl KAPA2GTM Fast Multiplex Mix |
| 0.6µl Primers | 1.0µl Primers | 1.2µl Primers | 0.6µl Primers | 0.3µl Primers | |
| 0.9µl DNA Template | 1.5µl DNA Template | 1.8µl DNA Template | 0.9µl DNA Template | 0.9µl DNA Template | |
| 0.3µl Water | |||||
| Standard PCR | 1.145µl PCR Reaction Mix | 1.909µl PCR Reaction Mix | 2.290µl PCR Reaction Mix | 1.2µL Identifiler® Plus Master Mix | 0.6µl PowerPlex® HS 5X Master Mix |
| 0.055µl AmpliTaq Gold® | 0.091µl AmpliTaq Gold® | 0.110µl AmpliTaq Gold® | 0.6µL Primers | 0.3µl Primers | |
| 0.6µl Primers | 1.0µl Primers | 1.2µl Primers | 1.2µL DNA Template | 1.2µl DNA Template | |
| 1.2µl DNA Template | 2.0µl DNA Template | 2.4µl DNA Template | 0.9µl Water |
| PCR Step | Identifiler (3μl)a | Identifiler (5μl)b | Identifiler (6μl)b | Identifiler Plus (3μl)a | PowerPlex 16 HS (3μl)a | |
| Fast PCR | Polymerase Activation | 95°C 1min | 95°C 1min | 95°C 1min | 95°C 1min | 96°C 1min |
| # of Cycles: | 26 | 27 | 27 | 26 | 10/18 | |
| Denaturation | 95°C 5sec | 95°C 5sec | 95°C 5sec | 95°C 10sec | 94/90°C 15sec | |
| Annealing | 61°C 40sec | 61°C 40sec | 61°C 40sec | 63°C 50sec | 60°C 15sec | |
| Extension | 70°C 30sec | |||||
| Final Extension | 72°C 10min | 72°C 10min | 72°C 10min | 72°C 10min | 72°C 10min | |
| Hold | 25°C | 25°C | 25°C | 25°C | 25°C | |
| Total Time | 43min | 51min | 51min | 49min | 51min | |
| Standard PCR | Polymerase Activation | 95°C 11min | 95°C 11min | 95°C 11min | 95°C 11min | 96°C 2min |
| # of Cycles: | 26 | 27 | 27 | 26 | 10/18 | |
| Denaturation | 94°C 1min | 94°C 1min | 94°C 1min | 94°C 20sec | 94/90°C 30sec | |
| Annealing | 59°C 1min | 59°C 1min | 59°C 1min | 59°C 3min | 60°C 30sec | |
| Extension | 72°C 1min | 72°C 1min | 72°C 1min | 70°C 45sec | ||
| Final Extension | 60°C 60min | 60°C 60min | 60°C 60min | 60°C 10min | 60°C 30min | |
| Hold | 4°C | 4°C | 4°C | 4°C | 4°C | |
| Total Time | 2hr 42min | 3hr 0min | 3hr 0min | 2hr 0min | 1hr 55min | |
| Time Saved | 1hr 59min | 2hr 9min | 2hr 9min | 1hr 11min | 1hr 4min | |
| 1hr 4min | -72% | -72% | -59% | -56% | ||
| KAPA2G Cost | $0.06 | $0.10 | $0.12 | $0.06 | $0.06 | |
aPCR performed on a 384-well Veriti thermal cycler; bPCR performed on a 9700 thermal cycler
Lastly, 24 buccal samples (all from different donors) were processed using the 5µl and 6µl Identifiler fast amplification protocols, and fast profiles were compared to those obtained using the Identifiler standard amplification protocols used at Cellmark Forensics (Table 3), including determination of first pass success rate. First pass success rate was defined as the percentage of passing profiles obtained during the first round of testing (i.e., without re-extraction, re-amplification, re-injection, etc.). Passing profiles must have all alleles detected at or above threshold, all PHR ?50%, no called stutter peaks >20%, no called pull-up peaks >20% and no -A; see Table 4 for a complete list of guidelines.
| Criteria | Pass | Fail |
| % Alleles Detecteda | 100%, no signs of mixture | <100% |
| PHR at all heterozygous loci | ³50% | <50% at any locus |
| Pull-up | £20% | >20% |
| Stutter (n-4, n+4) | £20% | >20% |
| Stutter (n-8) | £2 occurrences, £5% | >2 occurrences (£5%) or |
| any occurrence >5% | ||
| Trialleles and microvariantsb | None | Any occurrence |
| -A | None | Any occurrence |
| +A | None | Any occurrence |
| Elevated Baseline | Occurrences at £3 loci | Occurrences at >3 loci |
| non-specific amplification | None | Any occurrence |
| Oversaturation | £2 oversaturated peaks | >2 oversaturated peaks |
| Migration | All allele calls correct | Any occurrence of poor c |
| Injection Failure | None | Any occurrence |
| Loss of Resolutiond | None | Any occurrence |
| Spikes | £1 occurrencee | >1 occurrencef |
aAt a 75rfu threshold; bMust be reprocessed to confirm; however, given that all samples that were tested either originated from a known source or were also processed using a current procedure for comparison purposes, these would only fail if non-concordant with the known profile or profile obtained from the current process; cThat results in OL or miscalled allele(s); dPoor ILS or unresolved peaks; eOkay if in multiple dye channels but occur at the same base size; fAt different base sizes
| Stutter Type | Identifiler (3µl) | Identifiler (5µl) | Identifiler (6µl) | Identifiler Plus (3µl) | PowerPlex 16 HS (3µl) |
| n+4 | |||||
| Average | 3.82%a | 2.97%a,b | 3.17%a,b | 2.43%b | 2.75%b |
| 95% CI | [3.09%, 4.56%] | [2.53%, 3.40%] | [2.26%, 4.08%] | [2.09%, 2.78%] | [2.45%, 3.05%] |
| Calculated Maximum | 10.60% | 8.62% | 10.40% | 7.25% | 9.17% |
| Observed Maximum | 9.01% | 12.20% | 8.13% | 9.49% | 16.60% |
| n-8 | |||||
| Average | 2.52%c,d | 2.05%d,e | 2.24%c,d,e | 1.77%e | 2.60%c |
| 95% CI | [2.01%, 3.03%] | [1.80%, 2.30%] | [1.55%, 2.93%] | [1.58%,1.97%] | [2.38%, 2.82%] |
| Calculated Maximum | 8.52% | 6.18% | 8.99% | 4.98% | 7.65% |
| Observed Maximum | 10.90% | 10.90% | 10.40% | 7.55% | 8.88% |
Table 4: Average Percent Stutter for n+4 and n-8 Stutter Average percent stutter (n+4 and n-8) is displayed for each low volume, fast PCR method.
3µl Identifiler Plus Fast PCR Protocol
| Profile Assessment | Identifiler (3μl)a | Identifiler (5μl)b | Identifiler (6µl)c | Identifiler Plus (3µl)c | PowerPlex 16 HS (3µl)d |
| Full Profiles Detected | 99% | 99% | 98% | 97% | 98% |
| Alleles Detected | |||||
| Average | 98.90% | 99.00% | 98.10% | 98.00% | 99.40% |
| 95% CI | [96.7%, 100%] | [97.0%, 100%] | [95.4%, 100%] | [95.5%, 100%] | [98.4%, 100%] |
| Peak Height (rfu) | |||||
| Average | 827 | 961 | 579 | 1106 | 1295 |
| 95% CI | [811, 843] | [943, 979] | [567, 591] | [1076, 1136] | [1263, 1326] |
| Observed Maximum | 3418 | 3897 | 2757 | 7955 | 7162 |
| Observed Minimum | 119 | 81 | 78 | 76 | 75 |
| Inter-Locus Balance: CV of LPH:TPH | |||||
| Average | |||||
| 95% CI | 0.294 | 0.301 | 0.306 | 0.264 | 0.416 |
| [0.282, 0.306] | [0.291, 0.311] | [0.295, 0.317] | [0.252, 0.276] | [0.408, 0.424] | |
| Intra-Locus Balance: PHR | |||||
| Average | 0.866 | 0.864 | 0.861 | 0.868 | 0.858 |
| 95% CI | [0.861, 0.872] | [0.858, 0.870] | [0.855, 0.867] | [0.862, 0.874] | [0.852, 0.864] |
| PHR <50%e | 0.90% | 1.80% | 0.00% | 0.90% | 2.70% |
| First Pass Success Rate | 98% | 97% | 98% | 95% | 95% |
| Failure Reasons | |||||
| Dropout | 1.20% | 1.10% | 2.30% | 3.40% | 2.30% |
| PHR <50%f | 1.20% | 2.20% | 0.00% | 1.10% | 3.40% |
an=86; bn=89; cn=87; dn=88; ePercent of all heterozygous loci; fPercent of samples
3µl PowerPlex 16 HS Fast PCR Protocol
Validation of Low Volume, Fast PCR Protocols using KAPA2G
Determination of the Optimal Range of Input DNA
Stochastic Threshold, Precision, Stutter, Automation and Contamination
Lot-to-Lot Variation
Lot-to-lot variation of KAPA2G™ Fast Multiplex PCR Kit was assessed for three different lots of the master mix (Table 6 for a summary of profile quality). Full profiles were obtained from all samples (n=5) and positive amplification controls (n=2) using each lot. Average peak heights were significantly higher from lots 2 and 3 than lot 1, whereas no significant difference in intra-locus (average PHR and instances of PHR <50%) or inter-locus (average CV of LPH:TPH) balance were observed for the three lots. Despite lower peak heights using Lot 1, high quality, full profiles were obtained from all three lots.
| Profile Assessment | Lot 1 | Lot 2 | Lot 3 |
| Peak Height (rfu) | |||
| Average | 577 | 787a | 852a |
| 95% CI | [534, 620] | [725, 849] | [793, 911] |
| Observed Maximum | 1892 | 2936 | 2748 |
| Observed Minimum | 138 | 129 | 215 |
| Inter-Locus Balance: CV of LPH:TPH | |||
| Average | 0.379b | 0.370b | 0.331b |
| 95% CI | [0.320, 0.438] | [0.338, 0.402] | [0.289, 0.373] |
| Intra-Locus Balance: PHR | |||
| Average | 0.854c | 0.857c | 0.851c |
| 95% CI | [0.828, 0.880] | [0.836, 0.878] | [0.829, 0.873] |
| PHR <50% | 3.8%d | 1.3%d | 0.0%d |
Table 6: Lot-to-Lot Variation of KAPA2G™ Fast Multiplex PCR Kit Profile summaries are displayed for each of the five low volumes, fast PCR protocols. Full profiles were obtained from all samples and positive amplification controls. Averages in each row that share subscripts are not statistically different at α=0.05 according to one-way ANOVA analysis and/or the Tukey HSD procedure.
RESULTS AND DISCUSSION
5µl and 6µl Identifiler fast PCR protocols:
Per manufacturer recommendations, standard Identifiler amplification on 9700 thermal cycler utilizes the “9600 Emulation” mode, but the 9700 also offers a “Max” mode with faster ramp rates. A comparison of fast PCR performance using the 9600 emulation and max modes demonstrated slightly higher quality STR profiles using the maximum ramp rate mode, but improvements were still needed with respect to lower than desired peak heights (which caused dropout) and inter-locus peak imbalance. Thus, the number of amplification cycles was increased from 26 (used by Cellmark for 3µl standard amplifications) to 28 (used by Cellmark for 5µl standard amplifications), but this introduced -A peaks. Efforts continued with the 26 cycle amplification, coupled with longer annealing/extension times of 45sec and 50sec (compared to 40sec), but did not result in a significant improvement in allele dropout. Therefore, a 27 cycle amplification (used by Cellmark for 6µl standard amplifications) was evaluated next with a 40sec annealing/extension step, which resulted in nearly doubling average peak height from 503rfu to 976rfu; furthermore, full profiles were obtained from all samples using 27 cycles, but -A was also present. A 10min final extension successfully eliminated -A (n=24) and resulted in a 51min amplification protocol.
The 24 samples that were amplified using the final 5µl and 6µl Identifiler fast PCR protocols exhibited 100% allele concordance to profiles obtained using standard PCR, had a 100% pass rate compared to 83% using standard PCR (all failures due to PHR<50%). It should be noted that standard PCR pass rates from these 24 samples were lower than normal (typically >90%) because samples were specifically selected that had PHR <50% using standard PCR to better assess fast PCR’s intra-locus balance. Peak height (averages of 1153rfu and 1205rfu, respectively), intra-locus (average PHR of 87.4% and 88.8%, respectively) and inter-locus peak balance (average CV of LPH:TPH of 0.323 and 0.344) were all acceptable from 5µl and 6µl fast amplifications.
3µl Identifiler plus fast PCR protocol:
Shorter initial activation times of 1min and 2min were assessed in comparison to 3min, both of which exhibited acceptable profiles, though average peak height was reduced to 874rfu and 849rfu, respectively, while average CV of LPH:TPH improved somewhat (0.278 and 0.275, respectively) for both activation times. Therefore, the 1min activation was selected for further testing. Shorter denaturation times (5sec and 10sec, compared to 15sec) were assessed next. Both data sets yielded full profiles, but the 5sec data set exhibited a decrease in average peak height (711rfu), while the 10sec data set exhibited an increase (1269rfu), compared to 15sec. Though the explanation for the peak height increase using a 10sec denaturation (compared to those obtained with 15sec) was unknown, the 10sec denaturation was selected for further study because it performed as well as or better than 15sec with regard to peak height and other profile quality criteria.
Therefore, a 10sec denaturation was next evaluated with a 50sec annealing/extension step in comparison to the 60sec annealing/extension step previously tested, using a large data set (n=88) for both in an effort to reduce skewing due to small sample size; fast profiles from these 88 samples were compared to those obtained using standard PCR. Full profiles were obtained from 93%, 91% and 94%, respectively, with an average of 96% of alleles detected from both of the fast protocols compared to 98% from standard. Fast PCR’s slightly increased rate of dropout and decreased profile completeness were likely a result of reduced peak heights obtained from fast PCR (967rfu for the 50sec data set and 675rfu for 60sec) compared to standard PCR (1303rfu). It should be noted however, that fast PCR was performed on a different thermal cycler and detected on a different 3130xl Genetic Analyzer than the standard PCR data, which could account for the differences seen in peak height. Inter-locus peak balance was acceptable from all methods, with average CVs of LPH:TPH ranging from 0.247 for standard PCR to 0.258 (50sec) and 0.261 (60sec) fast PCR protocols, which is considerably lower than that observed by Identifiler fast PCR (typically >0.300). PHR <50% were infrequent, occurring in 1% of fast PCR profiles (50sec data set only; none observed in the 60sec data set) compared to 3% of standard profiles. Overall, first pass success rates (that is, the percentage of profiles passing after the first pass/round of testing) were highest from the 50sec fast PCR data set (92%), compared to 91% for 60sec fast PCR and standard PCR (dropout and PHR <50% were the only reasons for sample failure). Thus, the 50sec annealing/extension step was selected for the optimized Identifiler Plus fast PCR protocol, which had a total run time of 49min.
3µl PowerPlex 16 HS fast PCR protocol:
Optimization of the 3µl PowerPlex 16 HS PCR protocol also began with assessing different final extension lengths to prevent the formation of -A. Similar to the other fast PCR protocols, -A was present using the 1min and 5min final extensions, but was eliminated using 10min. Furthermore, from the first round of testing with the 10min final extension step, full profiles were obtained from all samples, no signs of NSA were present, average peak heights were 1256rfu, PHR <50% (17% of samples) were limited to 0.25ng samples, but inter-locus imbalance was higher than desired (average CV of LPH:TPH was 0.438). Next, 2-step PCR cycling was evaluated using annealing/extension temperatures of 58°C, 60°C and 62°C in an effort to improve profile quality. Low-level NSA was observed using both of the lower temperatures, but not at 62°C; however, profile quality decreased using 2-step PCR, most notably via allelic dropout (11% of samples) despite increased average peak heights (1476rfu), increased occurrences of PHR <50% (28% of samples) and decreased inter-locus balance (average CV of LPH:TPH of 0.474). Therefore, 2-step was not pursued further, and development of 3-step cycling continued with an assessment of increasing ramp rates from 29% and 23% to 100% for the annealing and extensions, respectively. Compared to the use of manufacturer’s recommended ramp rates, use of 100% ramp rates exhibited allelic dropout from one sample (a 0.25ng replicate; 6% of samples), despite increased average peak heights (1580rfu), decreased occurrences of PHR <50% (11% of samples; also limited to 0.25ng) and similar inter-locus balance (average CV of LPH:TPH of 0.446); however, increased average instances of called stutter per sample and pull-up >20% accompanied these higher peak heights. Use of 100% ramp rates was further tested in conjunction with reduced annealing times (15sec compared to 30sec). Even though full profiles were obtained from all samples using the shorter annealing time, a significant reduction in average peak height was observed (890rfu) and occurrences of PHR <50% doubled (22% of samples; limited to 0.25ng), while occurrences of stutter and pull-up declined; inter-locus peak balance was not significantly affected (average CV of LPH:TPH of 0.422). Since peak heights were still at an acceptable level using 100% ramp rates and 15sec annealing, these were assessed next with shorter extension times (20sec and 15sec, compared to 30sec). Extension times less than 30sec resulted in a significant increase in allelic dropout and reduction in peak heights, such that full profiles were only obtained from 73% (15sec) and 82% (20sec) of samples. Thus, the 30sec extension was maintained.
Reduced denaturation time (10sec and 5sec, compared to 15sec) was assessed next, but as seen with a reduction in extension time, a reduction in denaturation time also resulted in significant increases in allelic dropout and decreases in peak height. Therefore, 15sec denaturation was maintained. Next, a reduction in initial activation (1min versus 2min) was assessed. With this reduction, full profiles were still obtained from all samples, while average peak height (914rfu), inter-locus balance (average CV of LPH:TPH of 0.414) and occurrences of PHR <50% (no occurrences) were not effected in a negative manner. The 1min initial activation was then tested with a 25°C final hold in comparison to 4°C, from which full profiles were obtained, a significant increase in average peak height was observed (1888rfu), accompanied by increased occurrences of pull-up (not exceeding 20% of the true allele), but not significant changes in inter- or intra-locus balance. The implementation of the 25°C final hold completed the development of the PowerPlex 16 HS fast PCR protocol, resulting in a 51min amplification protocol. It should be noted that the desired level of inter-locus peak balance (CV of LPH:TPH ? 0.350) could not be achieved.
This fast PCR protocol was tested using 89 samples, and the resulting profiles were compared to those obtained using standard PCR. Full profiles were obtained from 96% of fast profiles and 93% of standard profiles, with an average of 98% and 99% of alleles detected, respectively. Peak heights were slightly lower from fast PCR (average of 1308rfu) compared to standard (average of 1449rfu), but were still on the high end of the desired range. Inter-locus peak imbalance was higher than desired using fast and standard PCR (average CVs of LPH:TPH of 0.416 and 0.372, respectively). PHR <50% were infrequent, occurring in 2% of fast PCR profiles compared to 4% of standard profiles. Overall, first pass success rates were highest from fast PCR (94%), compared to 90% for standard PCR; dropout and PHR <50%, were the only reasons for sample failure.
Validation of Low Volume, Fast PCR Protocols Using KAPA2G
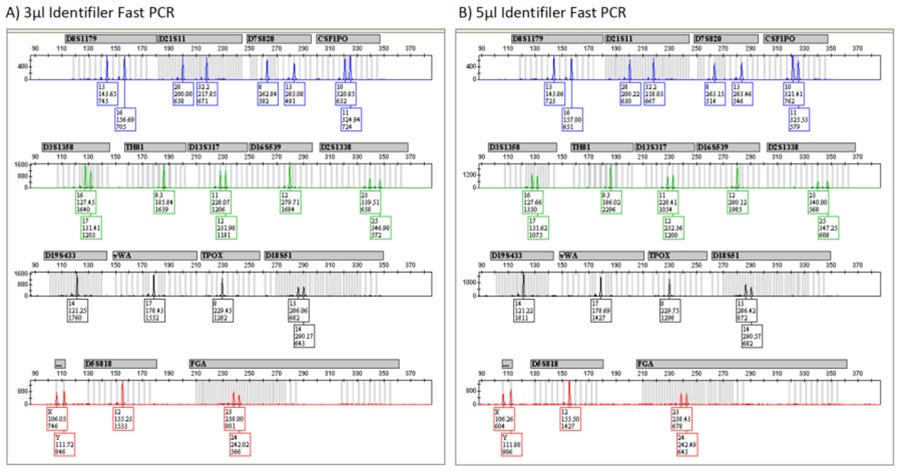 Figure 1: Representative Identifiler Profiles from Fast and Standard PCR.
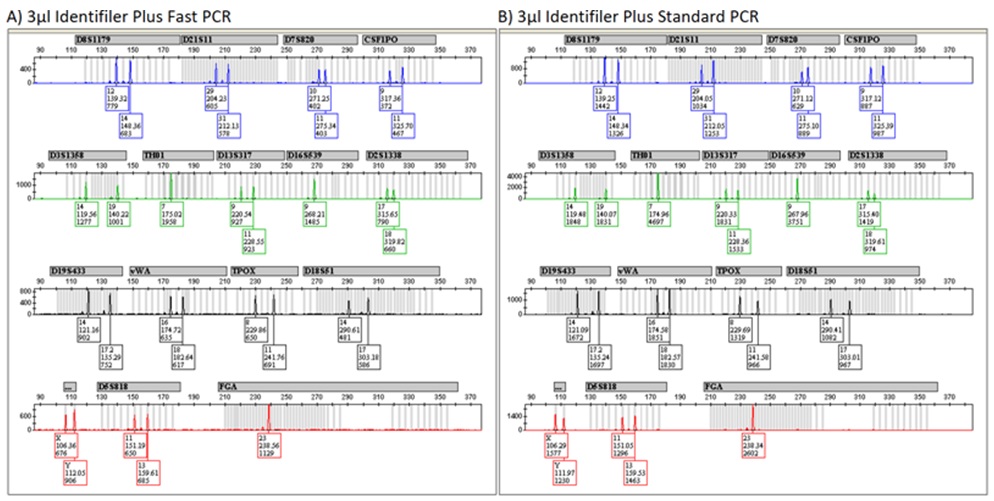 Figure 2: Representative Identifiler Plus Profiles from Fast and Standard PCR.
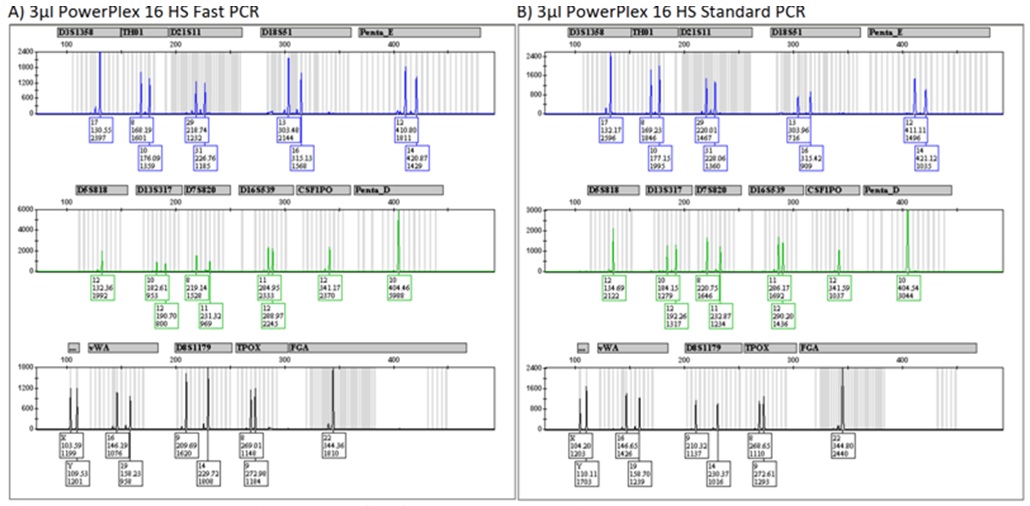 Figure 3: Representative PowerPlex 16 HS Profiles from Fast and Standard PCR.
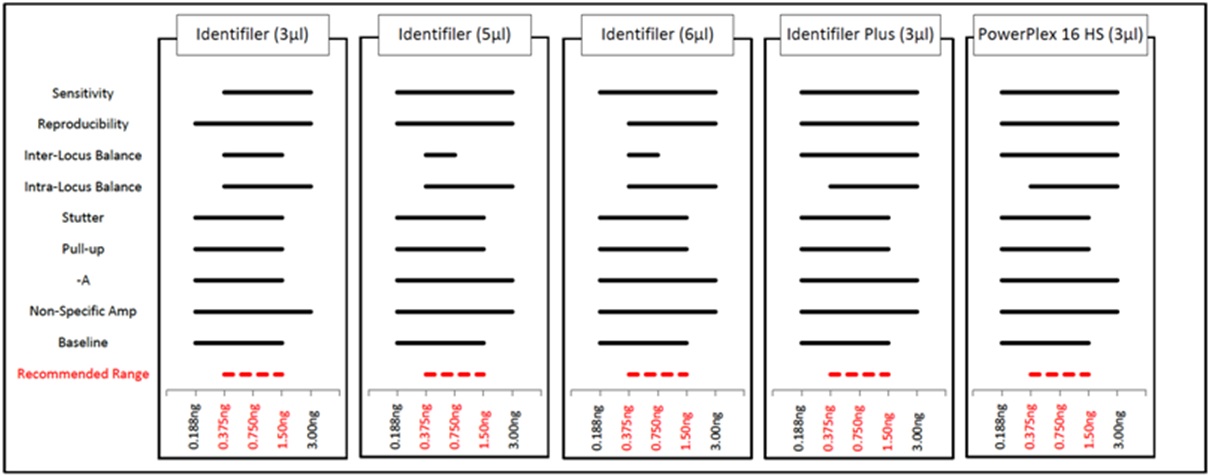 Figure 4: Optimal DNA Input Ranges for Fast PCR Protocols Using KAPA2G.
For all five fast PCR protocols, average percent alleles detected and percent full profiles increased as template amount increased, such that full profiles were obtained from nearly all samples when ?0.188ng DNA was amplified (Figure 5). Though the senstivity range (i.e., the range in which full profiles were obtained from the majority of all samples) was determined to be 0.188-3.00ng for all but 3µl Identifiler fast PCR (0.375-3.00ng), data from 0.188-3.00ng is discussed further for each of the five fast PCR methods for comparison purposes. Allele peak height and balance is summarized in Figure 6. As expected, average allele peak height increased as DNA input increased. Reproducibility of peak height was measured via average coefficient of variation per DNA input, which was ?0.350 when ?0.188ng DNA was amplified using each of the four fast PCR protocols (except for 0.188ng with a 6µl Identifiler amplification), indicating acceptable levels of reproducibility.
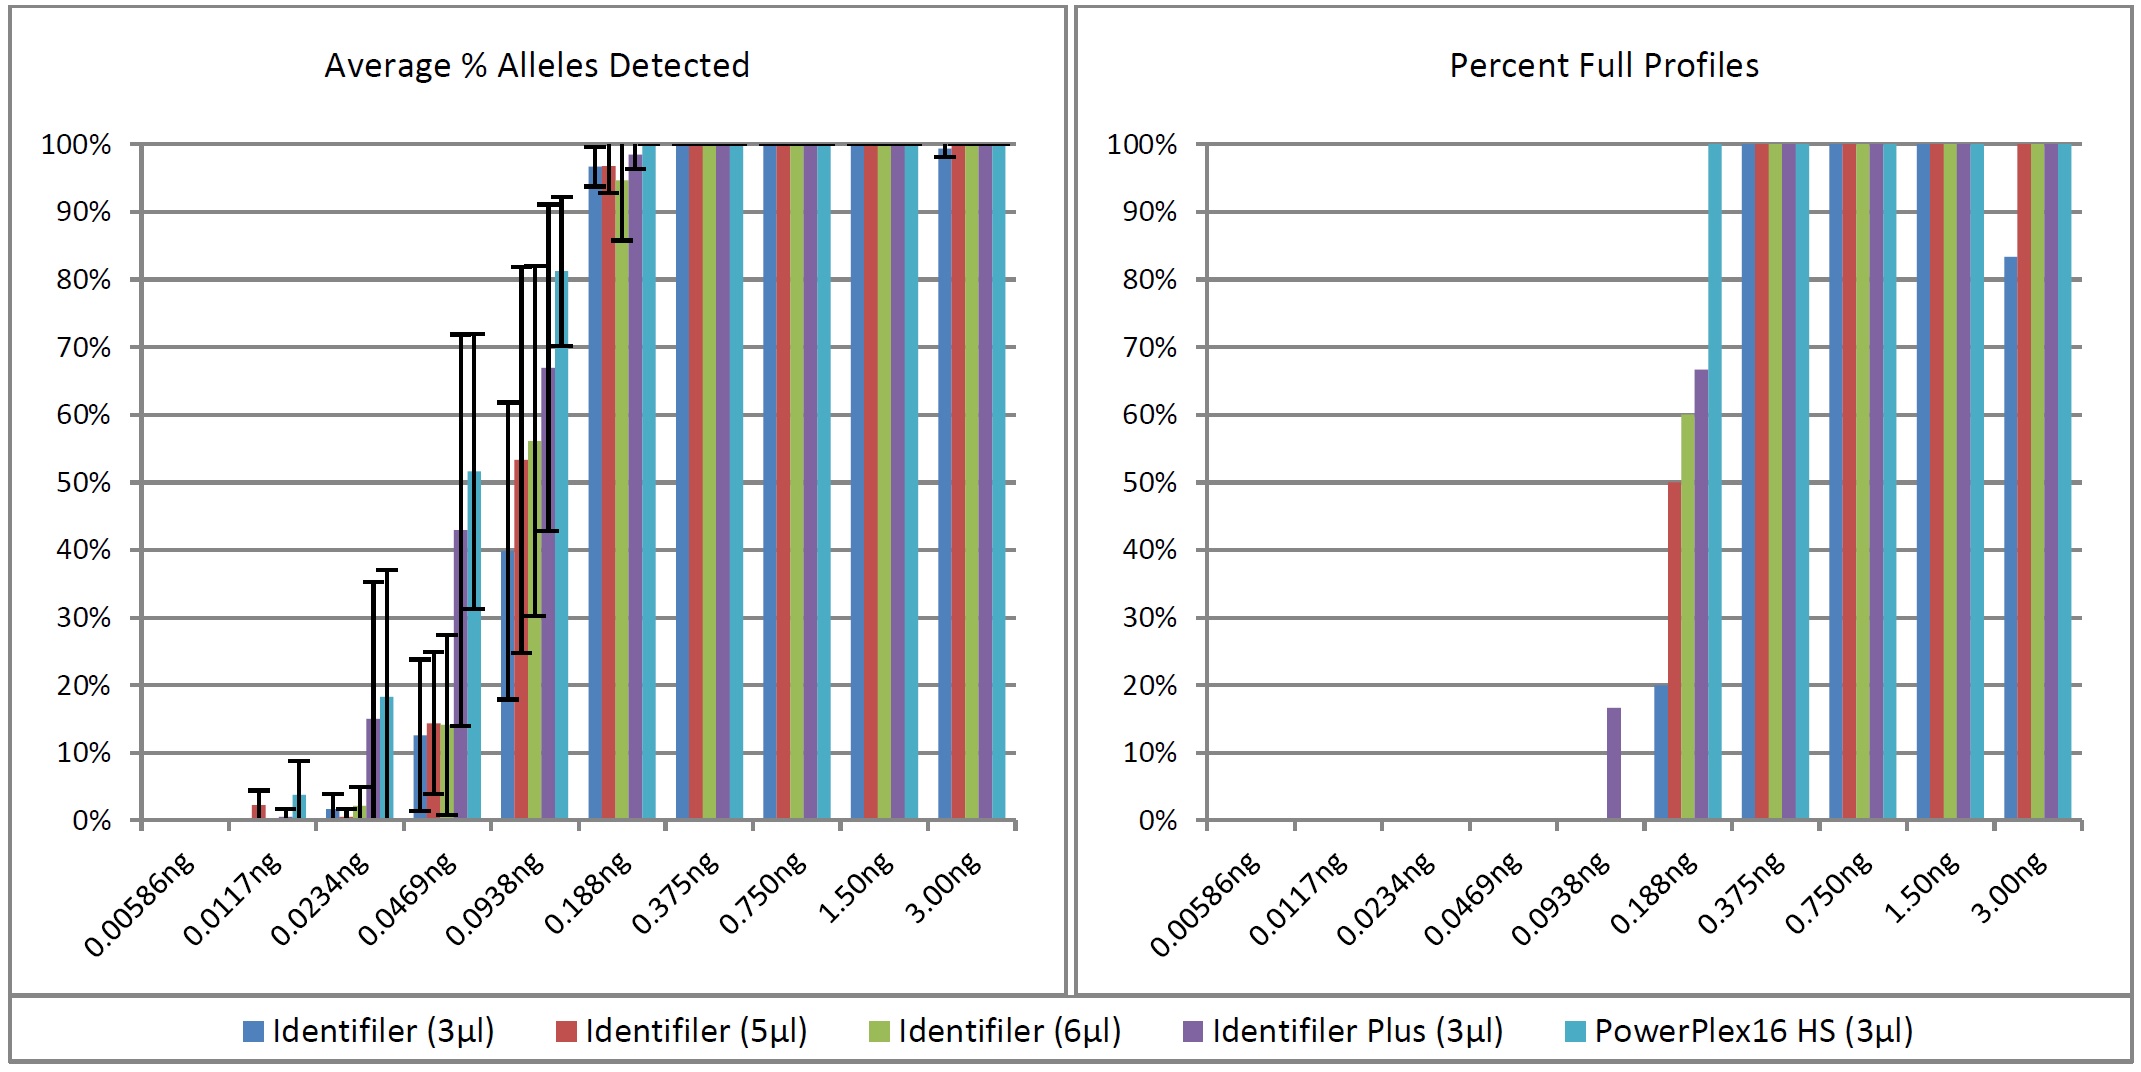 Figure 5: Sensitivity of Fast PCR Protocols Using KAPA2G.
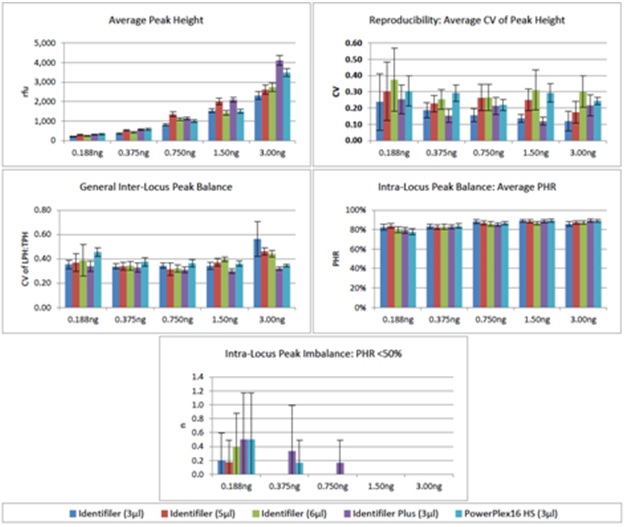 Figure 6: Peak Height Summary for Fast PCR Protocols Using KAPA2G.
None of the five methods tested were able to result in the desired level of general inter-locus balance (CV of LPH:TPH ?0.350) for all DNA input amounts. Nearly all methods exhibitedCVs >0.350 at 0.188ng and 3.00ng, while PowerPlex 16 HS CVs were >0.350 for all but 3.00ng. Intra-locus balance was measured via heterozygote peakheight ratios, averaging >82% for all ?0.375ng amplifications. Instances of PHR <50% were most frequent when 0.188ng DNA was amplified, but on average occurred less than once per sample.
Various artifacts were observed above the analysis threshold, but stutter (n-4) was the most prevalent type (Figure 7). Average percent stutter ranged from 10-19% and demonstrated a slight increase for the 0.375ng samples compared to 0.750-3.00ng. This was expected given that peak heights were lower at 0.375ng compared to higher inputs; thus, any stutter peaks that met the 75rfu analysis threshold at 0.375ng were a larger percentage of the true allele peak. Instances of stutter increased as DNA input increased and tended to be much less prevalent from PowerPlex 16 HS than the Identifiler/Identifiler Plus profiles. Unacceptably high stutter peaks (>20%) occurred occassionally, but were limited to profiles obtained using 3.00ng DNA (data not shown). Other forms of stutter (n+4 and n-8) did occur above threshold on occassion, but were nearly always limited to 1.50ng and 3.00ng amplifications. Furthermore, average percent stutter for these two forms of stutter (<4% for all) was much lower than that of n-4 stutter. Unacceptably high n-8 stutter (>2 occurrences in a single profile) occurred was limited to a single 3.00ng Identifiler Plus amplification (data not shown).
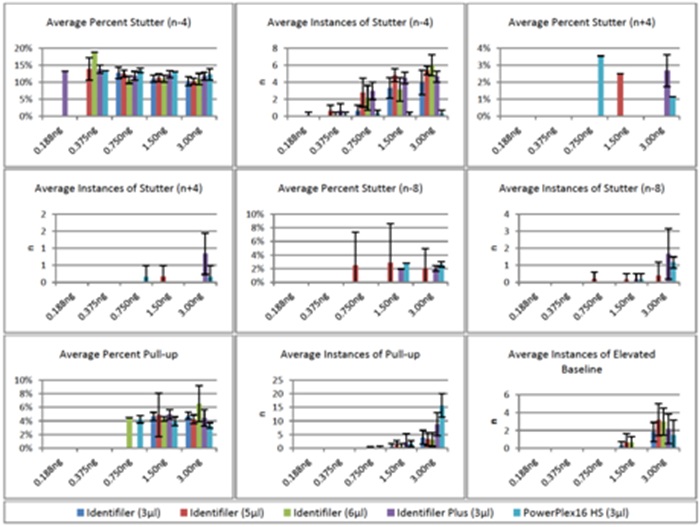 Figure 7: Artifacts for Fast PCR Protocols.
Pull-up peaks were the next most abundant artifact that was detected above threhsold, but were nearly always limited to amplification of ?1.50ng DNA and were more frequent for Identifiler Plus and PowerPlex 16 HS. Unacceptably high pull-up (>20%) was limited to 3.00ng amplifications using Identifiler (6µl) and Identifiler Plus (data not shown). A single occurrence of -A (2.7% of the true allele) was present in a 3µl Identifiler amplification using 3.00ng DNA (data not shown). Elevated baseline was limited to 1.50ng and 3.00ng and was unacceptably high (occurrences at >3 loci) at 3.00ng for all five PCR methods (data not shown). No signs of non-specific amplification were noted.
2. Stochastic threshold
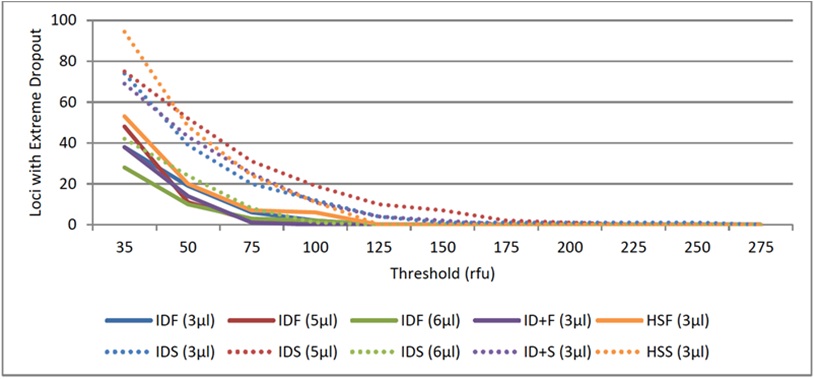 Figure 8: Stochastic Thresholds for Fast PCR Protocols Using KAPA2G.
Precision of allele sizing was assessed based on positive control 9947A amplified using the 3μl fast PCR methods that were developed for each of the three primer sets tested. All assessments indicated acceptable levels of precision per manufacture recommendations (standard deviation <0.15; figure 9).
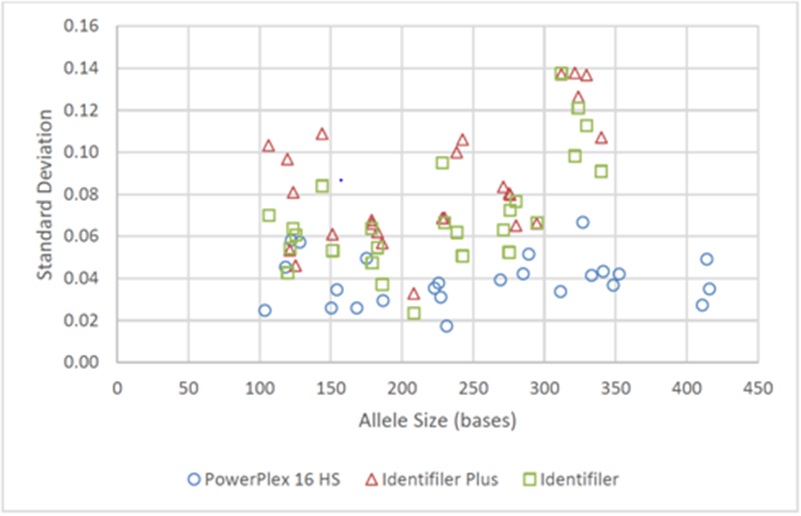 Figure 9: Precision of Allele Sizing for Fast PCR Protocols using KAPA2G precision was assessed via standard deviation for each allele from 9947A positive control DNA (for each amplification method, n=9 for each of the 25 alleles for PowerPlex 16 HS and 26 alleles for Identifiler Plus/Identifiler).
As was seen previously with the comparison of various 3µl Identifiler fast PCR protocols [13], nearly all assessments indicated more precise allele sizing between injections compared to intra-injection precision. Furthermore, all amplification methods exhibited satisfactory precision for allele sizing.
4. Stutter assessment
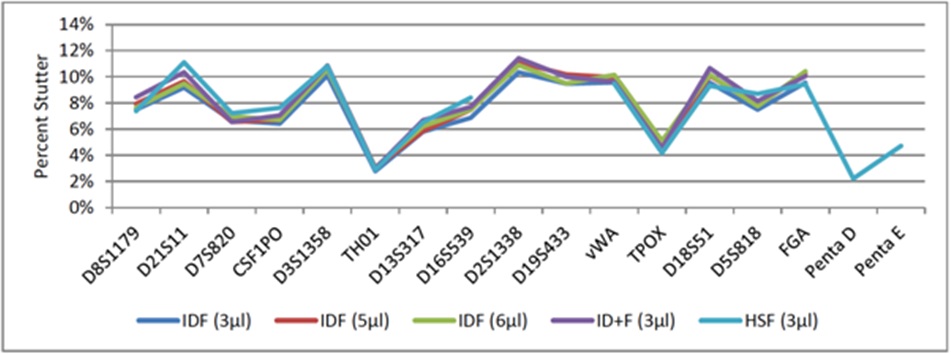 Figure 10: Average Percent Stutter (n-4) for Fast PCR Protocols Using KAPA2G.
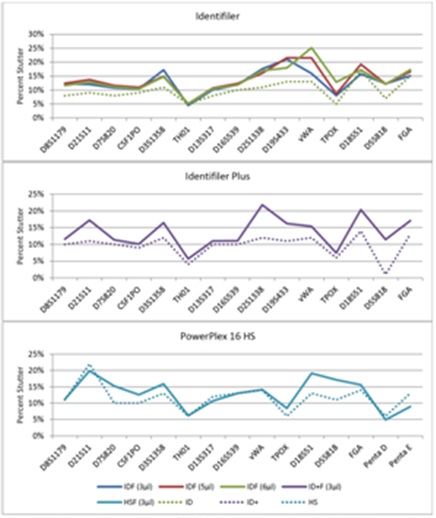
Implementing global stutter thresholds of 20% for all loci is not an uncommon practice for reference samples [8]. Maximum stutter limits per locus were calculated via the sum of average percent stutter plus three standard deviations (a more conservative approach adds two standard deviations [11]), which never exceeded 20% for any locus or amplification method. It should be noted, however, that the maximum observed percent stutter (n-4) was occasionally (0.05-0.18% of samples) above 20% for all Identifiler and Identifiler Plus fast PCR methods, ranging from 21-25%, but never exceeded 20% for PowerPlex 16 HS. Half of the profiles exhibiting n-4 stutter >20% had stutter peaks that corresponded with pull-up from another locus, 33% were from allele 25 at D18S51 and the remaining 17% were from loci with low-level peak heights (<140rfu), which are subject to stochastic effects. Thus, a global 20% n-4 stutter threshold would work well for any of the developed fast PCR methods.
Both n+4 and n-8 stutter occurred significantly less than n-4, often not occurring at some loci (data not shown). Since occurrences of n+4 and n-8 were often low for individual loci, these types of stutter were averaged across all loci. Average n+4 percent stutter ranged from 2% to 4%, whereas average n-8 percent stutter ranged from 2% to 3% (Table 7). Maximum allowable n+4 and n-8 stutter were calculated across all loci as opposed to individual loci. However, it should be noted that observed maximum n+4 exceeded calculated maximums for three fast PCR protocols (5µl Identifiler, 3µl Identifiler Plus and 3µl PowerPlex 16 HS), while observed maximum n-8 exceeded calculated maximums for all five protocols. These discrepancies could arise from the fact that all stutter peaks of the same type were grouped together since there was not enough data to calculate these values for individual loci. Given that many databasing laboratories allow a 20% n+4 stutter threshold, and the maximum observed n+4 stutter was 16.6%, it appeared reasonable to apply the same 20% global stutter threshold to n+4 stutter for all five fast PCR protocols. Many laboratories don’t provide specific allowances for n-8 stutter; therefore, based upon the data obtained from this study, global stutter thresholds for n-8 stutter were set to 12% for the Identifiler fast PCR protocols and 10% for Identifiler Plus/PowerPlex 16 HS.
| Length of 4°C Storage | 1-Thaw | 2-Thaw | 3-Thaw |
| Peak Heighta | |||
| Immediate Use | 780b,c[745, 815] | 959d,e [919, 999] | 1138e [1075, 1201] |
| One Week | 671b [645, 697] | 1068e [1023, 1113] | 871c,d [838, 904] |
| Two Weeks | 837c,d [795, 879] | 630b [606, 654] | 832c,d [812, 852] |
| One Month | 837c,d [811, 863] | 891d [833, 949] | 732b,c [710, 754] |
| PHRf | |||
| Immediate Use | 0.856 [0.850, 0.861] | 0.868 [0.865, 0.870] | 0.832 [0.830, 0.840] |
| One Week | 0.858 [0.851, 0.865] | 0.849 [0.839, 0.860] | 0.840 [0.829, 0.850] |
| Two Weeks | 0.859 [0.853, 0.864] | 0.851 [0.845, 0.856] | 0.868 [0.863, 0.873] |
| One Month | 0.854 [0.848, 0.860] | 0.854 [0.844, 0.863] | 0.863 [0.853, 0.869] |
| CV of LPH:TPHg | |||
| Immediate Use | 0.370 [0.338, 0.402] | 0.319 [0.268, 0.369] | 0.383 [0.333, 0.457] |
| One Week | 0.350 [0.302, 0.398] | 0.357 [0.316, 0.398] | 0.370 [0.329, 0.428] |
| Two Weeks | 0.356 [0.305, 0.406] | 0.359 [0.302, 0.416] | 0.388 [0.332, 0.430] |
| One Month | 0.347 [0.295, 0.400] | 0.354 [0.299, 0.410] | 0.385 [0.329, 0.424] |
an=192; fn=80; gn=7
5. Automation (Large Sample Sets)
Furthermore, it should be noted that a low level (~100rfu), unexplained artifact was observed at Amelogenin (~108b) for 1.1% of 3µl Identifiler and 5µl Identifiler fast amplifications (a single sample for both amplification volumes, figure 12). This artifact was not reproducible, and at no other time during fast PCR development or validation was this artifact observed.
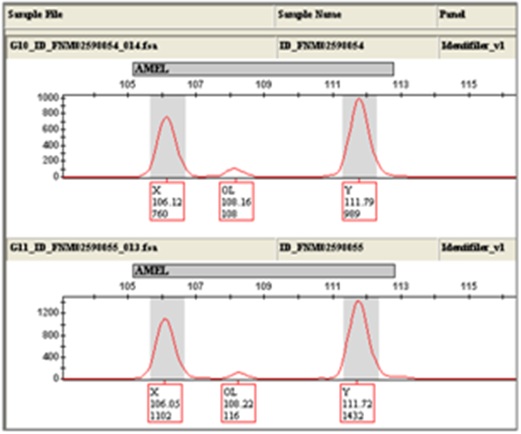 Figure 12: Fast PCR Artifact at Amelogenin.
6. Contamination assessment
7. Lot-to-lot variation
8. Storage conditions
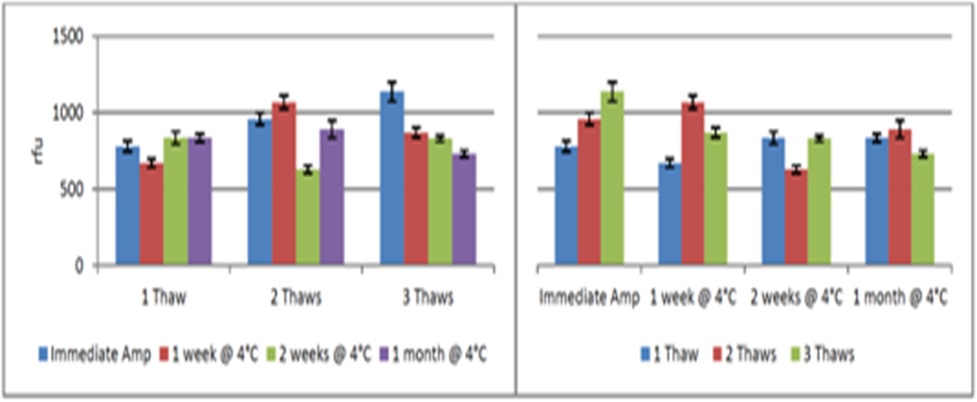 Figure 13: Effect of Storage Conditions on Allele Peak Height.
CONCLUSION
Low volume, fast PCR development using KAPA2GTM Fast Multiplex PCR Kit, various forensic STR primer sets, and non-fast thermal cyclers was quite successful, resulting in amplification times of 43-51min for 3μl reactions on a Veriti thermal cycler and 51min for 5-6μl reactions on a 9700. These protocols are robust for buccal samples, exhibiting first pass success rates of ≥95% and 100% allele concordance compared to standard PCR. Percent stutter does increase using fast PCR as compared to that of standard PCR [1,7,13], but use of a 20% global stutter filter [8] or modification of the locus specific stutter thresholds in GeneMapper® ID should prevent excessive stutter peaks from being called by the software, each of which are acceptable for reference samples. Furthermore, the protocols developed in this study improved upon many of the previously reported downfalls of fast PCR. Though a low-level (~100rfu) artifact was observed in 1.1% (one sample) of 3μl and 5μl Identifiler fast amplifications at the Amelogen in locus, it was not reproducible and no other non-specific amplification occurred in any of the other protocols. This is much improved compared to the NSA products that were previously reported by Vallone et al., [10]. Incomplete adenylation (-A) has been shown to often accompany STR profiles obtained using fast PCR [3,10,13], but was not problematic using the protocols developed here with 10min final extensions. Poor intra-locus peak balance has also been observed with other fast PCR protocols [13], but was not problematic using the protocols in this study and only occurred at one or more loci in ≤2% of samples tested, which was less than that observed for standard PCR of the same samples.
Furthermore, this study demonstrated the ability to achieve robust, reliable, high quality STR profiles for reference samples using fast PCR without having to purchase costly reagents, supplies, or equipment. Utilizing low volume reactions, the cost of using a fast PCR polymerase (i.e., KAPA2G) outside of the standard forensic STR amplification is extremely low ($0.06-$0.12 / 3-6µl reaction) and would likely be offset by no longer having to purchase supplemental AmpliTaq Gold® DNA polymerase for standard Identifiler reactions (the limiting reagent in the Identifiler amplification kit), as well as obtaining more reactions per Identifiler Plus/PowerPlex 16 HS kit given that the entire tube of primer could be utilized (excess primers are thrown away under standard PCR conditions when the kits’ master mixes are depleted). And for laboratories transitioning from full volume reactions (25µl) down to these low volumes, fast PCR reactions, the savings would be even greater. No additional supplies were needed for these protocols, including costly fast thermal cyclers.
All-in-all, this study has demonstrated the development of robust, low volume, fast PCR protocols for buccal samples to yield high quality STR profiles accompanied by a substantial reduction in amplification time with little (if any) increase in per sample costs.
FUTURE STUDIES
Newer amplification kits than those included in this project are now commercially available - PowerPlex® Fusion and Fusion 6C Systems, GlobalFiler® and GlobalFiler® Express PCR Amplification Kits, and Investigator® 24plex QS and GO! Kits - and allow for amplification of more STR loci. Many of these newer kits have already incorporated fast PCR strategies to reduce amplification time substantially, without the use of fast thermal cyclers. It would be noteworthy to further assess the performance of these newer kits using low volume PCR reactions, as an extra cost-saving measure for DNA reference samples, to see how they would compare to the methods presented here.
Additionally, this study was specifically tailored for DNA reference samples, but it would be valuable to assess these protocols with evidentiary type samples (blood stains, cigarettes, differentials and other mixtures, etc.). Targets for DNA input would have to be re-evaluated using a human-specific quantification method, and STR profiles would need to meet stricter PHR thresholds (at least 60-70%) to allow for proper mixture interpretation.
ACKNOWLEDGEMENT
We would like to thank Kapa Biosystems and Applied Biosystems for donating reagents for this study.
CONFLICTS OF INTEREST
At the time this research was conducted, Catherine Connon and Aaron LeFebvre were employees of Cellmark Forensics, the sister lab to Bode Technology (now collectively known as Bode Cellmark Forensics). Reagents were donated for evaluation by manufacturers (Kapa Biosystems and Applied Biosystems), but did not result in bias.
ROLE OF FUNDING SOURCE
This project was funded by Cellmark Forensics, a LabCorp Specialty Testing Group. Additional reagents were donated by Kapa Biosystems and Applied Biosystems.
REFERENCES
- Foster A, Laurin N (2012) Development of a fast PCR protocol enabling rapid generation of AmpFlSTR® Identifiler® profiles for genotyping of human DNA. Investig Genet 3: 1-11.
- Gangano S, Elliot K, Anoruo K, Gass J, Buscaino J (2013) DNA investigative lead development from blood and saliva samples in less than two hours using the RapidHITTM Human DNA Identification System. Forensic Sci Int Genet Suppl Ser 4: 43-44.
- Giese H, Lam R, Selden R, Tan E (2009) Fast multiplexed polymerase chain reaction for conventional and microfluidic short tandem repeat analysis. J Forensic Sci 54: 1287-1296.
- Gray K, Crowle D, Scott P (2014) Direct amplification of casework bloodstains using the Promega PowerPlex® 21 PCR amplification system. Forensic Sci Int Genet 12: 86-92.
- Hedman J, Albinsson L, Ansell C, Tapper H, Hansson O, et al. (2008) A fast analysis system for forensic DNA reference samples. Forensic Sci Int Genet 2: 184-189.
- LaRue BL, Moore A, King JL, Marshall PL, Budowle B (2014) An evaluation of the RapidHIT® system for reliably genotyping reference samples. Forensic Sci Int Genet 13: 104-111.
- Laurin N, Frégeau C (2012) Optimization and validation of a fast amplification protocol for AmpFlSTR® Profiler Plus® for rapid forensic human identification. Forensic Sci Int Genet 6: 47-57.
- Myers BA, King JL, Budowle B (2012) Evaluation and comparative analysis of direct amplification of STRs using PowerPlex® 18D and Identifiler® Direct systems. Forensic Sci Int Genet 6: 640-645.
- Park SJ, Kim JY, Yang YG, Lee SH (2008) Direct STR amplification from whole blood and blood- or saliva-spotted FTA without DNA purification. J Forensic Sci 53: 335-341.
- Vallone PM, Hill CR, Butler JM (2008) Demonstration of rapid multiplex PCR amplification involving 16 genetic loci. Forensic Sci Int Genet 3: 42-45.
- Verheij S, Harteveld J, Sijen T (2012) A protocol for direct and rapid multiplex PCR amplification on forensically relevant samples. Forensic Sci Int Genet 6: 167-175.
- Wang DY, Chang CW, Hennessy LK (2009) Rapid STR analysis of single source DNA samples in 2 h. Forensic Sci Int Genet Suppl Ser 2: 115-116.
- Connon CC, LeFebvre AK, Benjamin RC (submitted) Assessment of Four Polymerases for Low Volume, Fast PCR Amplification of STR Loci for DNA Reference Samples. J Forensic Leg Investig Sci.
- Invitrogen™ Life Technologies (2005) Instruction Manual: ChargeSwitch® Forensic DNA Purification Kits, Version A. Invitrogen Corporation, Carlsbad, CA, USA.
- Federal Bureau of Investigation (2011) Quality Assurance Standards for Forensic DNA Testing Laboratories, effective 9-1-2011. Federal Bureau of Investigation, Washington, DC, USA.
- Federal Bureau of Investigation (2011) Quality Assurance Standards for DNA Databasing Laboratories. Federal Bureau of Investigation, Washington, DC, USA.
- Tukey JW (1953) The Problem of Multiple Comparisons. Department of Statistics, Princeton University, New Jersey, USA.
- Zar JH (2010) Multiple Comparisons. In: Biostatistical Analysis. (5thedn), Pearson Prentice Hall, Upper Saddle River, New Jersey, USA.
SUPPLEMENTARY TABLES
| PCR Step | Amplification Mode | # Cycles | Annealing/ Extension | # Cycles | Final Extension | Final |
| Thermal Cycler Mode | 9600 Emulation, Max | Max | Max | Max | Max | Max |
| Polymerase Activation | 95°C 1min | 95°C 1min | 95°C 1min | 95°C 1min | 95°C 1min | 95°C 1min |
| # of Cycles | 26 | 26, 28 | 26 | 26, 27 | 27 | 26, 27 |
| Denaturation | 95°C 5sec | 95°C 5sec | 95°C 5sec | 95°C 5sec | 95°C 5sec | 95°C 5sec |
| Annealing/Extension | 61°C 40sec | 61°C 40sec | 61°C 40, 45, 50sec | 61°C 40sec | 61°C 40sec | 61°C 40sec |
| Final Extension | 72°C 5min | 72°C 5min | 72°C 5min | 72°C 5min | 72°C 5, 10min | 72°C 5, 10min |
| Hold | 25°C | 25°C | 25°C | 25°C | 25°C | 25°C |
| Total Time | 44, 55min | 44, 46min | 44, 46, 48min | 44, 46min | 46, 51min | 51min |
Supplemental table 1: Thermal Cycling Parameters for 5µl Identifiler Fast PCR Development.
The PCR step under evaluation is listed at the top of each column. Each of the thermal cycling parameters was assessed using a 96-well 9700 thermal cycler (gold or silver block). The final thermal cycling parameters that were developed for the 5µl amplification was also used for 6µl Identifiler fast PCR.
| PCR Step | Final Extension | Primer Annealing | Initial Activation | Denaturation | Annealing/ Extension | Final |
| Polymerase Activation | 95°C 3min | 95°C 3min | 95°C 1, 2, 3min | 95°C 1min | 95°C 1min | 95°C 1min |
| 26 of Cycles: | ||||||
| Denaturation | 95°C 15sec | 95°C 15sec | 95°C 15sec | 95°C 5, 10, 15sec | 95°C 10sec | 95°C 10sec |
| Annealing/Extension | 59°C 1min | 59, 61, 63°C 1min | 63°C 1min | 63°C 1min | 63°C 50sec, 1min | 63°C 50sec |
| Final Extension | 72°C 1, 5, 10min | 72°C 10min | 72°C 10min | 72°C 10min | 72°C 10min | 72°C 10min |
| Hold | 25°C | 25°C | 25°C | 25°C | 25°C | 25°C |
| Total Time | 50, 55, 59min | 59, 58, 57min | 55, 56, 57min | 51, 53, 55min | 49, 53min | 49min |
Supplemental Table 2: Thermal cycling parameters for 3µl identifiler plus fast PCR development.
The PCR step under evaluation is listed at the top of each column. Each of the thermal cycling parameters was assessed using a 384-well Veriti thermal cycler.
| 3-Step PCR | 2-Step PCR | 3-Step PCR | ||||||||
| PCR Step | Final Extension | Primer Annealing | Ramp Rates | Annealing | Extension | Denaturation | Initial Activation | Final Hold | ||
| Polymerase Activation | 96°C 2min | 96°C 2min | 96°C 2min | 96°C 2min | 96°C 2min | 96°C 2min | 96°C 1, 2min | 96°C 1min | ||
| 10 of Cycles: | 94°C 15sec | |||||||||
| Denaturation | 94°C 15sec | 58, 60, 62°C 1mina | 94°C 15sec | 94°C 15sec | 94°C 15sec | 94°C 5, 10, 15sec | 94°C 15sec | 94°C 15sec | ||
| Annealing | 60°C 30seca | 60°C 30seca,b | 60°C 15, 30sec | 60°C 15sec | 60°C 15sec | 60°C 15sec | 60°C 15sec | |||
| Extension | 70°C 30secc | 70°C 30secb,c | 70°C 30sec | 70°C 15, 20, 30sec | 70°C 30sec | 70°C 30sec | 70°C 30sec | |||
| 18 of Cycles: | 90°C 15sec | |||||||||
| Denaturation | 90°C 15sec | 58, 60, 62°C 1mina | 90°C 15sec | 90°C 15sec | 90°C 15sec | 90°C 5, 10, 15sec | 90°C 15sec | 90°C 15sec | ||
| Annealing | 60°C 30seca | 60°C 30seca,b | 60°C 15, 30sec | 60°C 15sec | 60°C 15sec | 60°C 15sec | 60°C 15sec | |||
| Extension | 70°C 30secc | 70°C 30secb,c | 70°C 30sec | 70°C 15, 20, 30sec | 70°C 30sec | 70°C 30sec | 70°C 30sec | |||
| Final Extension | 72°C 1, 5, 10min | 72°C 10min | 72°C 10min | 72°C 10min | 72°C 10min | 72°C 10min | 72°C 10min | 72°C 10min | ||
| Hold | 4°C | 4°C | 4°C | 4°C | 4°C | 4°C | 4°C | 4, 25°C | ||
| Total Time | 1hr 12min, | 1hr 12min, 1hr 10min, 1hr 8min | 1hr 0min, | 53min, | 45, 48, 53min | 48, 50, 53min | 52, 53min | 52, 51min | ||
| 1hr 16min, | 1hr 21min | 1hr 0min | ||||||||
| 1hr 21min |
Supplemental table 3: Thermal cycling parameters for 3µlPowerPlex 16 HS fast PCR development.
The PCR step under evaluation is listed at the top of each column. Each of the thermal cycling parameters was assessed using a 384-well Veriti thermal cycler. All ramp rates are 100%, unless otherwise noted.
a29% ramp rate, balso tested at 100% ramp rate, c23% ramp rate.
Citation: Connon CC, LeFebvre AK, Benjamin RC (2016) Validation of Low Volume, Fast PCR Amplification of STR Loci for Reference DNA Samples. J Forensic Leg Investig Sci 2: 008.
Copyright: © 2016 Catherine C Connon, et al. This is an open-access article distributed under the terms of the Creative Commons Attribution License, which permits unrestricted use, distribution, and reproduction in any medium, provided the original author and source are credited.